2019 Full Year Results Overview - 20 September 2019 Premier Investments Limited
←
→
Page content transcription
If your browser does not render page correctly, please read the page content below

Premier Investments Limited
2019 Full Year Results Overview
             20 September 2019

                            X
                            0
Agenda

     Premier Investments Limited                              Smiggle - Accelerated global growth
 1   FY19 overview                                       8    strategy far exceeding expectations

                                                              Peter Alexander - Delivers record result with
     Premier Investments Limited
 2   FY19 consolidated financial results                 9    growth set to continue

 3   Premier Retail - Delivers record result             10   Premier Retail summary

 4   Premier Retail FY19 EBIT                            11   Dividends

     Premier Retail - Investment continues in
 5   store network

 6   Apparel Brands - Deliver strong FY19 sales growth   13

 7   Online - Delivers record sales

                                                                                                        X
                                                                                                        1
X2

1          Premier Investments FY19 overview
Group profit
  –      Reported net profit after tax of $106.8 million, up 27.7% on FY18
  –      Underlying net profit before tax of $177.6 million, up 10.8% on FY181
  –      Record Underlying Premier Retail EBIT of $167.3 million, up 11.5% on FY181
  –      Record Premier Retail Sales of $1,271.0 million up 7.5% on FY18
            –     LFL sales up 4.2% on FY18 on a constant currency basis
            –     Apparel Brands sales up 6.9%, with LFL sales growth even stronger up 7.8%
            –     Record Online sales of $148.2 million growing to 13.4% of respective markets’ sales
            –     Record Peter Alexander sales of $247.8 million
            –     Record Smiggle sales of $306.5 million

Strong cash flow and strong balance sheet
  –      Net cash generated (operating less investing activities) for the year of $123.3 million, up $30.1 million or 32.3% on FY18
  –      Cash on hand of $190.3 million at end of FY19
  –      Balance sheet at end of FY19 shows investment in associate (Breville Group Limited) as $238.7 million. The market
         value of this investment at end of FY19 was $691.7 million
  –      Investment in Myer Holdings Limited of $46.9 million
  –      Franking credit pool of $208.5 million

Increased record full year ordinary dividends of 70 cps fully franked, up 8 cps or 12.9% on FY18 (FY18: 62 cps)

      Note:
      1. Refer Appendix B for details regarding significant and other one-off items excluded from underlying results

                                                                                                                                      3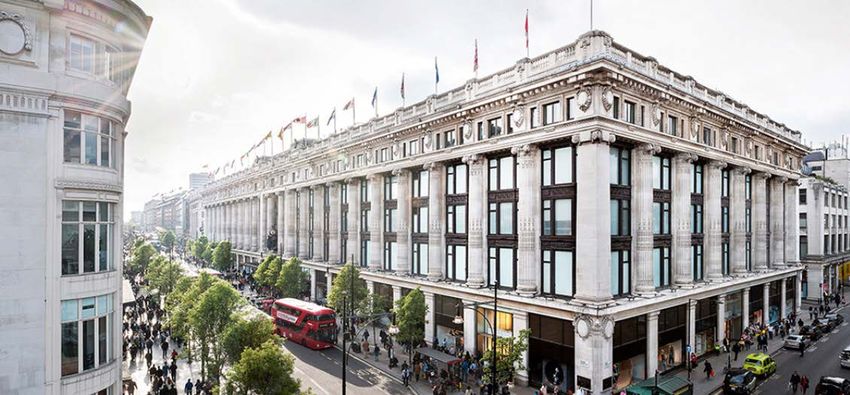
2        Premier Investments summarised consolidated income statement
    $m                                                                                                           FY19     FY18
    Premier Retail EBIT – underlying                                                                             167.3    150.1
    Premier Investments income from associate (BRG)                                                               18.9     16.1
    Premier Investments other revenue (Interest, Dividends, Rent & Other)                                          7.6      7.3
    Premier Investments expenses (ex Premier Retail)                                                              (8.5)    (7.0)
    Underlying finance costs                                                                                      (7.7)    (6.2)

    Underlying net profit before tax1                                                                            177.6    160.3

    Expenses incurred before occupying new head office property
     ‒ Depreciation, relocation and other                                                                             -    (2.8)
     ‒ Finance costs                                                                                                  -    (1.4)
    Expenses incurred in relation to investment in Myer Holdings Limited
                                                                                                                      -    (1.5)
    including preparation for legal action
    One-off UK Brexit accelerated depreciation and associated costs                                              (25.9)        -
    One-off Smiggle Europe expansion                                                                                  -    (0.7)
    Non-cash impairment charge in relation to intangible assets                                                       -   (30.0)
    Reported net profit before tax                                                                               151.7    123.9
    Income tax expense                                                                                           (44.9)   (40.3)
    Reported net profit after tax                                                                                106.8     83.6

Note:
1. Refer Appendix B for details regarding significant and other one-off items excluded from underlying results

                                                                                                                                   4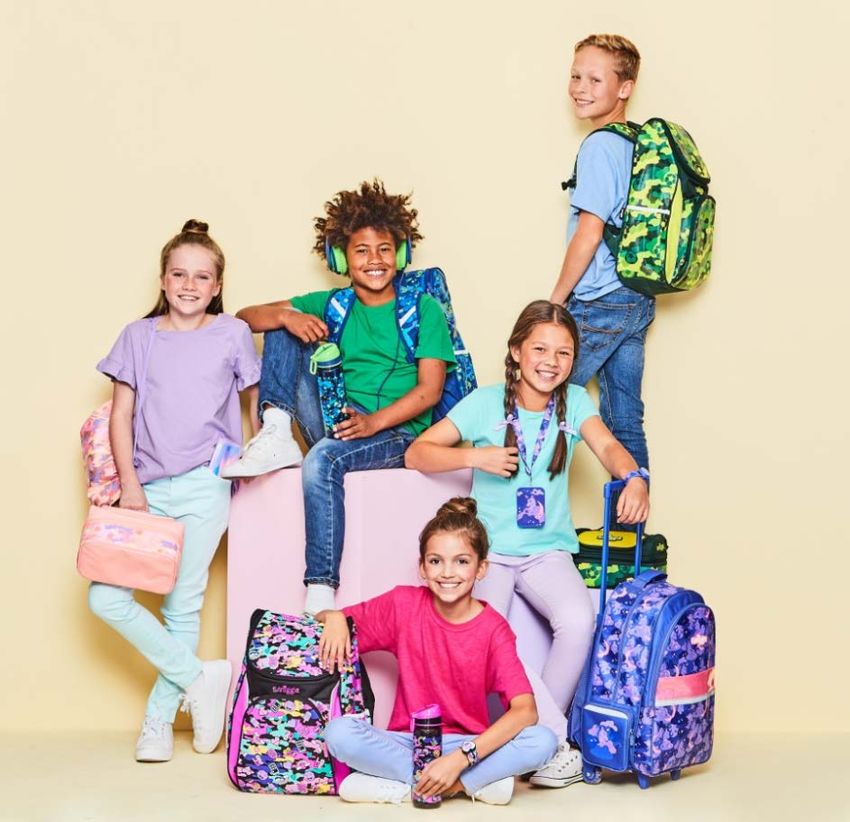
2     Premier Investments summarised consolidated balance sheet

    $m                                                 27 Jul 2019   28 Jul 2018
    Assets
    Cash and cash equivalents                               190.3         178.6
    Inventories                                             171.2         159.3
    Property, plant and equipment                           210.9         238.2
    Other assets                                             43.7          48.9
    Deferred tax assets                                      40.4          36.6
    Listed equity investment at fair value                   46.9          40.7
    Investment in associate                                 238.7         223.2
    Intangible assets                                       826.6         825.9
    Total assets                                          1,768.7       1,751.4
    Liabilities
    Interest bearing loans and borrowings                   167.5         175.7
    Deferred tax liabilities                                 63.9          63.9
    Trade payables, provisions and other liabilities        188.1         166.9
    Total liabilities                                       419.5         406.5
    Equity
    Contributed equity                                      608.6         608.6
    Reserves                                                (10.9)        (16.0)
    Retained earnings                                       751.5         752.3
    Total equity                                          1,349.2       1,344.9

                                                                                   5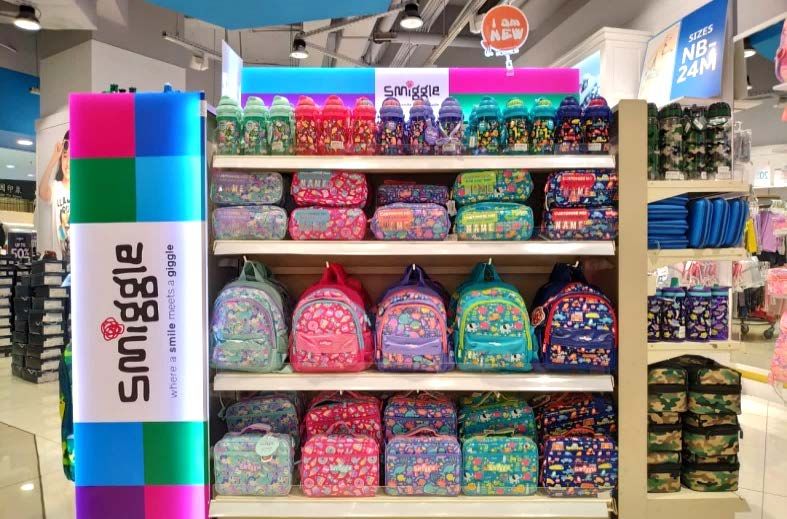
6

3           Premier Retail - Delivers record result

•   Record sales of $1,271.0 million up 7.5% on FY18, with like-for-like (LFL) sales up 4.2% on FY18 on a constant
    currency basis
•   Record Underlying EBIT of $167.3 million, up 11.5% on FY181
•   Record Underlying EBIT % to sales of 13.2%, up 47 bps on FY181
•   Record Underlying profit before tax of $162.5 million, up 11.8% on FY181
•   Apparel Brands continuing to deliver strong sales growth momentum
        •   FY19 sales up 6.9% to $716.7 million
        •   FY19 LFL sales growth of 7.8% was stronger than overall growth, with 26 Apparel stores closed during FY19
•   Record Online sales of $148.2 million, up 31.7% on a previous record FY18
•   Record Peter Alexander sales of $247.8 million, up 13.3% on a previous record FY18
•   Record Smiggle sales of $306.5 million. Smiggle’s Accelerated Growth Strategy, announced in September 2018, is
    being successfully delivered with performance to date far exceeding expectations

Note:
1. Refer Appendix B for details regarding one-off items excluded from underlying results

                                                                                                                        7
3       Premier Retail performance
                                                                                           52 weeks            52 Weeks
        $000                                                                          to 27 Jul 2019       to 28 Jul 2018         Var LY
        Sales                                                                              1,270,958            1,182,221         +7.5%
        LFL sales (constant currency)                                                         +4.2%                +3.3%
        Gross Profit                                                                         786,578              738,314         +6.5%
        Gross margin (%)                                                                      61.9%                62.5%         -56 bps
        Employee Expenses1                                                                  (301,737)            (280,268)        +7.7%
        % sales                                                                                23.7%                23.7%         +3 bps
        Rent1                                                                               (228,183)            (224,377)        +1.7%
        % sales                                                                                18.0%                19.0%       -103 bps
        Advertising & Direct Marketing1                                                      (15,896)             (15,234)        +4.4%
        % sales                                                                                 1.3%                 1.3%         -4 bps
        Depreciation, Amortisation & Impairment1                                             (29,924)             (27,535)        +8.7%
        % sales                                                                                 2.4%                 2.3%         +3 bps
        Other Costs of Doing Business1                                                       (44,444)             (42,328)        +5.0%
        % sales                                                                                 3.5%                 3.6%         -8 bps
        Other income                                                                              940                1,494
        Underlying EBIT                                                                      167,334              150,066        +11.5%
        % sales                                                                                13.2%                12.7%        +47 bps
        Borrowing costs                                                                       (4,807)              (4,672)
        Underlying Profit before tax                                                         162,527              145,394         +11.8%

Note:
1. FY19 total cost of doing business equates to 48.8% of sales (FY18 49.9%) excluding significant and other one-off items - Refer Appendix B for details

                                                                                                                                                           8
4          Premier Retail – Delivers 8 consecutive years of growth
•   8 consecutive years of Underlying EBIT growth
•   FY19 Underlying EBIT margin to Sales up 47 bps on FY18
•   Key Gross Margin and CODB strategies delivering

                                                                                                                 13.2%
                                            Underlying EBIT – 8 Year History
                                                                                                        12.7%            13.0%
                       175.0                                                                   12.4%             167.3
                                                                                   12.3%                                 12.5%
                                                                                                        150.1            12.0%
                       150.0
                                                                       11.2%
                                                                                               136.0                     11.5%
                                                                                   126.7
                       125.0                                                                                             11.0%
                                                           10.4%
                                                                       105.7                                             10.5%
                                                10.0%
                       100.0         9.7%                   92.8                                                         10.0%
                                                 83.7                                                                    9.5%
                                     80.4
                        75.0                                                                                             9.0%
                                    FY12        FY13       FY14        FY15        FY16        FY17     FY18     FY19
                                                                                 (Note 1)

                                                  Underlying EBIT $'M                      Underlying EBIT % Sales

    Notes:
    1. FY16 excludes non-comparable 53rd week which contributed $6.6m in EBIT
    2. Refer Appendix B for details regarding one-off items excluded from underlying results

                                                                                                                                 9
4 Premier Retail - Delivers record result
Gross Margin Strategies continue to deliver
• FY19 results were achieved notwithstanding significant external headwinds in the apparel sector and with Brexit
uncertainty in the United Kingdom, with retailers generally continuing to discount deeper and for longer to remain
competitive
• Long term foreign currency hedging strategies allowed for merchandise planning
• Direct sourcing initiatives continued to deliver benefits from new and existing suppliers
• Sourcing from new geographies continues
• Investing in better merchants and delivering better product remains the key focus area
The delivery of better product and disciplined execution of markdown management was integral to delivering a clean
inventory position at the end of FY19
CODB Focus continues to deliver
• CODB decreased by 109 bps as a percentage of sales to 48.8% in FY191
• Costs continue to be well controlled despite structural inflationary pressure
• Investment will continue in strategic growth initiatives including Smiggle’s Accelerated Growth Strategy, Online and
Peter Alexander
Note:
1. Refer page 8 for CODB details
104 Premier Retail - Delivers Underlying CODB reduction of 109 bps
CODB – Store Profitability Focus
• 35 stores closed during the last 12 months, a total of 138 stores closed over the last 7 years, as part of the ongoing
program to close unprofitable stores
• As consumers continue to increase their online shopping, the focus continues on individual store profitability to drive
shareholder returns. Where landlords do not continue to invest in overall shopping experiences and/or adjust their
rent expectations in line with the performance of their own centres and the major shift in consumer behaviour, further
store closures may be necessary
• Many landlords are offering other international and local fast fashion retailers significant capital and low rents to enter
their centres during development. Unless those landlords offer Premier Retail the same capital and rent they are
offering Premier Retail competitors, then Premier Retail will escalate the closure of all brands in those centres.
Premier can more efficiently allocate capital and achieve shareholder returns from investment in the online channel,
further international expansion of our key brands or opening in other shopping centres where landlords respect the
nature of Premier Retail’s seven brand portfolio
• As a direct result of unrealistic rent expectations, in July 2019 Premier Retail closed 3 prime CBD stores in Auckland
(New Zealand). This is in addition to the previously announced store closures in the once iconic Chapel Street
(Victoria) in 2019 and the closure of Just Jeans flagship store in Rundle Mall (South Australia) in April 19,
demonstrating the willingness of Premier Retail to walk away from stores with unrealistic rents that deliver
unprofitable sales
115 Premier Retail – Investment continues in store network
Premier Retail continues to invest in new stores, upgrades and
refurbishments to deliver sustainable sales growth
162 stores received capital investment, including 28 new stores and 6 new
Smiggle International Concessions opened in FY19
In FY19, 90% of capital investment in Australia and New Zealand stores
has been funded via landlord contributions
• 3 new concession stores opened in the United Kingdom
• 3 new concession stores opened in Singapore
• 2 new stores opened in Australia
• 1 new store opened in the United Kingdom Smiggle Maroochydore (QLD) - Relocated and refurbished
• 1 new store opened in Malaysia November 2018
• 3 new permanent kiosks opened in Australia
• 4 stores relocated and refurbished across Australia and New
Zealand
• 1 store refurbished in existing location in New Zealand
• 1 store received a fixture upgrade in Australia
• 9 new stores opened across Australia and New Zealand
• 2 stores relocated and refurbished in Australia
• 2 stores received fixture upgrades in Australia
Peter Alexander Maroochydone (QLD) – Relocated and refurbished
November 2018
125 Premier Retail - Investment continues in store network
• 3 new stores opened across Australia and New Zealand
• 1 store relocated and refurbished in Australia
• 1 store refurbished in existing locations in Australia
• 93 stores received fixture upgrades in Australia
• 2 new stores opened across Australia and New Zealand
• 4 stores relocated and refurbished across Australia and
New Zealand
• 6 stores refurbished in existing locations in Australia
• 4 new stores opened across Australia and New Zealand
Dotti Eaton Fair (WA) – Opened May 2019
• 4 stores relocated and refurbished in Australia
• 2 stores refurbished in existing locations in Australia
• 2 new stores opened across Australia and New Zealand
• 1 store relocated and refurbished in Australia
• 1 store refurbished in existing location in Australia
• 1 new store opened in New Zealand
• 4 stores relocated and refurbished in Australia
• 1 store refurbished in existing location in Australia
Jay Jays Tauranga Crossing (NZ) – Opened April 2019
139
6 Apparel Brands - Deliver strong FY19 sales growth
• Apparel Brands FY19 sales up 6.9% on FY18 to $716.7 million
• Apparel Brands FY19 LFL sales growth of 7.8% was stronger than overall growth, with
26 stores closed during the last 12 months as part of the ongoing program to close
unprofitable stores
• Ongoing investment in product and merchandise teams delivering growth
• Focus on better product and disciplined execution of markdown management in a highly
competitive market leaving a clean inventory position to commence FY20
16.0%
13.7% 13.6%
14.0%
12.0%
10.0%
7.8%
8.0% 6.7% 6.9% 6.9%
6.1%
6.0%
3.3% 3.2% 3.5%
4.0%
2.2%
2.0%
0.0%
-0.1%
-2.0%
JUST JEANS JAY JAYS JACQUI E PORTMANS DOTTI TOTAL APPAREL
FY19 Total Sales Growth FY19 LFL Sales Growth
149
7 Online - Delivers record sales
• Record Online sales of $148.2 million, up 31.7%
on a previous record FY18
• Online sales growing to 13.4% of the respective
markets’ sales in FY19 Online Sales Growth
• The Group surpassed its aspirational target of
180.0 13.4% 14.0%
$100 million in global annual online sales in FY18,
2 years ahead of expectations 160.0 148.2
11.0% 12.0%
• New Zealand Websites successfully launched and 140.0
far exceeding expectations in 2H19 for Smiggle, 10.0%
120.0 112.5
Just Jeans, Portmans and Jacqui E, in addition to 7.1% 8.0%
100.0
the rapidly growing Peter Alexander and Dotti
Online businesses already in New Zealand 80.0 5.2% 6.0%
68.1
4.3%
• 2013 investment in centralised and specifically 60.0
3.3% 47.2 4.0%
customised Australian Distribution Centre servicing 2.6%
40.0 34.4
1
100% order fulfilment of 100% of Premier Retail 18.9
24.6 2.0%
20.0
products in Australia
• Online channel continues to deliver significantly - 0.0%
FY13 FY14 FY15 FY16 FY17 FY18 FY19
higher EBIT margin than the Group average (Note 1)
• All global sites continuing to deliver strong growth
Online Sales ($'M)
with all brands outperforming the market
Online sales as % of the sales in countries & brands with a transactional website
• Major investment continues in technology, people
and new marketing initiatives to deliver a world
class platform and customer experience
Note:
1. FY16 excludes non-comparable 53rd week of sales
158 Smiggle - strategy to accelerate global growth far exceeding expectations
• Record sales in FY19 of $306.5 million driven by another
outstanding year in Asia
• The accelerated growth strategy announced in September
2018 is successfully being delivered with performance to
date far exceeding expectations
1. Wholesale demand far exceeding
expectations
2. Online growth both proprietary and third party
far exceeding expectations
3. Concession partnerships with iconic global
retailers continues to accelerate
4. New store growth through the continued
rollout of standalone stores remains on track
where the economics and shareholder returns
are attractive
• The four pathways to growth deliver significant global
brand presence and a much higher EBIT margin with
materially less capital, generating far higher cash flows
than the originally planned multi country own store rollout
Smiggle reaffirms its growth strategy targeting to deliver $450 million in
annual Smiggle global retail sales in calendar 2021 or calendar 2022
168 Smiggle - Wholesale launch successful and far exceeding expectations
Wholesale Update
• All 6 countries announced in March 2019 have successfully launched
• South Korea, Thailand, Indonesia, Philippines, United Arab Emirates and Canada
• In addition, launch in the Middle East now extended to Qatar
• Smiggle brand is now represented in over 180 new doors through 6 iconic retailers across 7 countries with a combined
population of over half a billion
• Potential to grow to 350+ doors with the existing 6 partners within 12-24 months
• The wholesale partners chosen in each market are best in class iconic local retail operators who are delivering on their
contractual obligations to Smiggle's high brand integrity standards around product, visual merchandising and brand
presentation
178 Wholesale partners all delivering on the brand’s high standards
United Arab Emirates Indonesia
Canada Philippines
188 Wholesale partners all delivering on the brand’s high standards
South Korea
Qatar
Thailand
198 Smiggle - Wholesale business far exceeding expectations
Wholesale Update
45
• Smiggle has received $17 million of
40
Retail Value
wholesale orders – far exceeding
35 Ordered
Sales $ million (AUD)
expectations 30
Delivered
• The $17 million of Smiggle wholesale 25 1H20
orders has the potential to deliver $35 – 20
$45 million in retail sales to consumers 15 1H20
in 1H20 10
5 2H19
• These orders alone through the existing 0
6 partners represent retail sales growth Wholesale Potential
of +20-25% on 1H19 actual total global Sales Retail Sales to
consumers via
Smiggle retail sales Wholesale
Partners
• Smiggle brand is now represented in over 180 doors through 6 iconic retailers across 7 countries with a combined
population of over half a billion and with the potential to grow to 350+ doors with the existing 6 partners within 12-24
months
• The wholesale business with the existing 6 iconic partners allows the brand to leverage off our partners iconic status,
market knowledge, store portfolio, traffic and transactional websites in each of the countries they operate in
• Retail sales to consumers from our wholesale partners across all 7 countries for the first 6 weeks of 1H20 have far
exceeded all expectations
208 All 6 iconic retail partners are delivering on the brand standards
Wholesale Update
• All wholesale ordering is done on a quarterly basis, with product then delivered and dropped into doors on a monthly
basis to ensure continual brand newness similar to the brands own standalone stores
• All wholesale revenue is received in USD currency
• All partners are contracted to deliver on the Smiggle brand instore experience including all marketing and fixture
collaterals
• All partners require authorisation and brand approval on all elements of brand presentation, product information, visual
merchandising, marketing and promotional activity
• All partners that have rolled out the over 180 current doors are delivering on these high brand standards
• All partners have significantly invested and delivered on marketing campaigns to launch Smiggle in each of their
respective markets
Smiggle’s wholesale EBIT margin is far higher than the brand’s average EBIT margin
218 Smiggle wholesale channel - long runway for future global growth
Wholesale Update
• Smiggle brand is now represented in over 180
doors through 6 iconic retailers across 7
countries with a combined population of over
half a billion and with the potential to grow to
350+ doors with the existing 6 partners within
12-24 months
• Advanced discussions are ongoing for new
wholesale partners in markets which have been
identified as high potential and with long runways of
future global growth
• Smiggle is clear on which markets it will enter next
and will announce these further countries and
number of doors as and when commercial terms are
finalised
Successful brand launch in over 180 doors with potential to deliver $35 – $45
million in retail sales to consumers in 1H20, alone representing +20-25% growth on
1H19 actual global Smiggle retail sales
228 Online channel continues to expand and is far exceeding expectations
Smiggle Online Update
• Smiggle online channel continues to far exceed expectations
• FY19 UK online sales were 18% of total UK sales and Australia online sales were 10% of total Australia sales as consumers
increasingly shop this channel
• Successful 2H19 launch of Smiggle proprietary transactional website in NZ, with sales results to date far ahead of
expectations
• Continued investment across the existing proprietary business in Australia, New Zealand and the United Kingdom
• Successful 2H19 launch of Smiggle on Amazon Europe exposing the brand to an incremental 175 million potential new
customers across France, Italy and Spain
• Third party transactional websites launched in FY19 including Selfridges (August 2018) and Harrods (November 2018) have
seen over 40% of customers shopping from locations outside of the UK
• The online channel delivers a significantly higher EBIT margin than the Smiggle brand average
• Smiggle continues to explore further third-party relationships with other key global leaders including Alibaba, focusing on
countries in which the brand does not currently operate but is in high demand
UK Online - Sales as % of Total Sales AU Online - Sales as % of Total Sales
20% 12%
18%
10%
10%
16% 15%
8% 7%
12% 11%
6%
8% 6% 4%
4%
2%
4% 2% 1% 2%
2%
0%
0% 0%
FY14 FY15 FY16 FY17 FY18 FY19 FY14 FY15 FY16 FY17 FY18 FY19
(Note 1)
(Note 1)
UK Online sales as % of Total UK Sales AU Online sales as % of Total AU Sales Note: 1. FY16 excludes
non-comparable 53rd week
of sales
238 Concession strategy with iconic retail partners continues to deliver
Concession Update
• The concession strategy enables the brand to leverage on the foot traffic generated by the iconic retail partner without the
need for long term leases and at a fraction of the capital employed to open standalone stores
• The concession model for Smiggle is extremely capital light with the deployment of capital at one tenth of an average store
• The concession performances in Selfridges and Harrods continue to perform well ahead of expectations
• Concession launch in Asia in FY19 has also been highly successful growing to 3 concessions across Singapore by end of
2H19 and with negotiations in final stages for a further 3-5 trading across Asia by Christmas 2019
• In markets where the brand already operates standalone stores Smiggle will continue to seek concession partnerships in
the interest of delivering the highest returns to shareholders with best in class iconic retail partners
Selfridges Oxford Street Store, London – new location opened August 2019
248 Concession strategy with iconic retail partners continues to deliver
Concession Update
Harrods, London – opened August 2018 Selfridges Oxford Street Store, London
– new location opened August 2019
258 Smiggle pathways to global growth update – New standalone stores
New Standalone Store Update
• The brand will continue to explore compelling opportunities to open
standalone stores in existing markets where commercial terms and
returns on investment are attractive for shareholders
• New standalone store strategy remains on track with 7 new stores
opened globally in FY19
• Whilst standalone stores remain a focus for the brand, with the ever
evolving world of retail and the profound speed of growth into new
channels, including online, the number of standalone stores and
wholesale or concessions may be interchangeable by country as the
focus will always be on delivering the highest returns for shareholders
with the lowest capital employed Castle Hill, Australia – relocated and refurbished March 2019
Empire Gallery, Malaysia – opened August 2018
268 Smiggle summary – pathways to global growth far exceeding expectations
Smiggle accelerated global growth strategy summary
• Smiggle has once again delivered a record result in FY19
• Smiggle reaffirms its growth strategy target to deliver $450
million in annual global retail sales in calendar 2021 or calendar
2022, with the four pathways to growth platforms far exceeding
expectations
• Wholesale far exceeding expectations with the Smiggle brand
now represented in over 180 doors through 6 iconic retailers
across 7 countries with a combined population of over half a
billion and with the potential to grow to 350+ doors with the
existing 6 partners within 12-24 months
• The wholesale EBIT margin is far higher than the brand’s
average EBIT margin
• Online proprietary and third-party growth continues to accelerate
with the channel delivering a significantly higher EBIT margin
than the brand average
• Concession growth continues to deliver high returns on low
capital
• Smiggle maintains a unique market position to drive long term
global growth
Smiggle reaffirms its growth strategy targeting to deliver $450 million in
annual Smiggle global retail sales in calendar 2021 or calendar 2022
278 Smiggle’s four pathways to growth are far exceeding expectations
All channels to consumers are represented in the brand’s global top 10 stores
• The four pathways to growth strategy is delivering significant global brand exposure and a much higher EBIT margin with
materially less capital, generating far higher cash flows than the originally planned multi country own store rollout
• John Cheston (Managing Director: Smiggle) continues to lead and inspire a high-quality management team that is
creating and executing a multi-format, multi-channel brand strategy in order to realise the group’s aspiration to make
Smiggle a world leader in Children’s stationery and lifestyle products
289 Peter Alexander – Delivers record result
PeterPeter
Alexander Sales Growth
Alexander Sales
260
240
220
200
180
160
Sales AUD $m
140
120 $248
$219
100 $191
80 $167
$140
60 $122
$101
40 $86
$73
$50 $61
20
-
FY09 FY10 FY11 FY12 FY13 FY14 FY15 FY16* FY17 FY18 FY19
Sales
Notes:
1. FY16 excludes non-comparable 53rd week of sales
299 Peter Alexander – 2020 Growth Plan now delivered
• Record Sales up 13.3% to $247.8 million with strong total and LFL
sales in both Australia and New Zealand
• 2020 Strategic Growth plan announced in September 2017 to
increase annual sales to $250 million by FY20 has now been
delivered one year ahead of schedule
• 9 new stores opened in FY19: Cockburn (WA), Blacktown (NSW),
Forrest Chase (WA), Moonee Ponds (VIC), Mt Maunganui (NZ),
Merrylands (NSW), Canberra DFO (ACT), Rhodes (NSW) and
Central Square Ballarat (VIC)
• 90% of capital investment in Australia and New Zealand stores has
been funded via landlord contributions
• Children’s sleepwear delivering outstanding results, with sales up
500% since FY13
• Continued expansion of P.A. Plus sizes delivering exceptional sales
growing by over 150% in the past 2 years, with the Online channel
delivering over 50% of total sales in this category
• Online has continued to deliver exceptional growth well ahead of
the market, in particular as a growth channel for the new expanded
ranges of Children’s sleepwear and P.A. Plus
309 Peter Alexander - Growth set to continue
• 2020 Strategic Growth plan announced in September 2017
to increase annual sales to $250 million by FY20 has now
been delivered one year ahead of schedule - with growth set
to continue
• Potential to open a further 20-30 stores over the next 2
years, with 5 new stores already confirmed to open in 1H20:
• Chatswood West (NSW) Oct-19
• Hornsby (NSW) Oct-19
• Helensvale (QLD) Nov-19
• Eastgardens (NSW) Dec-19
• Fashion Spree (NSW) Dec-19
• Additional opportunities exist for landlord funded
refurbishments and expansions of existing stores
• Significant growth opportunity exists by expanding Children’s
sleepwear options online only
• Significant growth opportunity exists by expanding P.A. Plus
options online only Peter Alexander Rhodes (NSW) - Opened May 2019
• Online EBIT margin far higher than the brand average
• Peter Alexander continues to be a major destination for
gifting, with innovative product design & packaging
positioning the brand as truly unique in the market
3110 Premier Retail summary FY19
Smiggle record result with the four global growth platforms far exceeding expectations
• Record result in FY19
• Record performance in Asia
• Reaffirm Smiggle growth strategy targeting to deliver $450 million in annual global Smiggle retail sales in calendar
2021 or calendar 2022
• The four pathways to growth deliver significant global brand exposure and a much higher EBIT margin with materially
less capital, generating far higher cash flows than the originally planned multi country own store rollout and are far
exceeding expectations
• Wholesale far exceeding expectations with Smiggle now represented in over 180 doors through 6 iconic retailers
across 7 countries with a combined population of over half a billion and with the potential to grow to 350+ doors with
the existing 6 partners within 12-24 months
• Potential retail sales to consumers through wholesale channel in 1H20 of $35 – $45 million, alone representing +20-
25% growth on 1H19 actual global Smiggle retail sales
• Smiggle maintains a unique market position to drive long term brand growth
• John Cheston (Managing Director: Smiggle) continues to lead and inspire a high quality management team that is
creating and executing a multi-format, multi-channel brand strategy in order to realise the group’s aspiration to make
Smiggle a world leader in Children’s stationery and lifestyle products
3210 Premier Retail summary FY19
Peter Alexander – Delivers record result
• Record Sales up 13.3% to $247.8 million with strong total and LFL sales growth in both Australia and New Zealand
• 2020 Strategic Growth plan announced in September 2017 to increase annual sales to $250 million by FY20 has now
been delivered one year ahead of schedule - with growth set to continue
• Potential to open a further 20-30 stores over the next 2 years, with 5 new stores already confirmed to open in 1H20
• Additional opportunities exist for landlord funded refurbishments and expansions of existing stores
• Significant growth opportunity exists by expanding Children’s sleepwear options online only
• Significant growth opportunity exists by expanding P.A. Plus options online only
• Strong and focused management team led by Judy Coomber (Managing Director: Peter Alexander and Dotti) and Peter
Alexander (Creative Director: Peter Alexander)
Online – Delivers record result
• Record Online sales of $148.2 million, up 31.7% on a previous record FY18
• Online sales growing to 13.4% of the respective markets’ sales in FY19
• Online channel continues to deliver significantly higher EBIT margin than the Group average
• All global sites continuing to deliver strong growth with all brands outperforming the market
• Major investment continues in technology, people and new marketing initiatives to deliver a world class platform and
customer experience
• New Zealand Websites successfully launched and far exceeding expectations in 2H19 for Smiggle, Just Jeans,
Portmans and Jacqui E, in addition to the rapidly growing Peter Alexander and Dotti Online businesses already in New
Zealand
• Strong and focused management team led by Georgia Chewing (Group General Manager: Internet and Marketing)
continuing to grow and innovate the business
3334
11       Dividends

•   Due to the continued strength of the Premier Balance Sheet and the strong performance of Premier Retail, the Premier
    Board has declared an increased record final dividend of 37 cps fully franked, up 12.1% (FY18 Final: 33 cps)

•   Total full year ordinary dividends of 70 cps fully franked, up 12.9% (FY18: 62 cps)

•   The final dividend will be payable on 15 November 2019

                                           Premier Investments
                              Full Year Ordinary Dividends per Share (cents)
                                              Fully Franked

                     75                                                                           70

                     65                                                                    62

                                                                                 53
                     55
                                                                       48
                     45                           40        42
                             36        38
                     35

                     25

                     15
                           FY12       FY13      FY14       FY15       FY16      FY17      FY18   FY19

                                                                                                                           35
36
A
 Highlights
 •     Record sales in FY19 of $306.5 million
 •     Record performance in Asia
 •     Reaffirm Smiggle growth strategy targeting to deliver $450 million in annual global Smiggle retail sales in calendar 2021 or
       calendar 2022
 •     The four pathways to growth deliver significant global brand exposure and a much higher EBIT margin with materially less
       capital, generating far higher cash flows than the originally planned multi country own store rollout and are far exceeding
       expectations
 •     Smiggle has commenced 1H20 strongly, with global sales for the first 6 weeks up 5.2% on the prior comparable period
       (excluding the wholesale channel)
Overview of Results
Sales                  $306.5m

Var LY                 +4.6%

Store movements1        Jul 18    Open      Close2    Jul 19

Australia/NZ             155        5           5      155
                                                                    Note: 1. Store
Asia                      51        1           3       49          movements table
                                                                    reflects standalone
Asia Concession           -         3           -       3           and concession
                                                                    stores only. 2. Store
                                                                    movements table
Europe                   140        1           -      141
                                                                    reflects permanent
                                                                    store closures only,
Europe Concession         1         3           -       4           and does not include
                                                                    temporary store
Global                   347        13          8      352          closures

                                                                                                                                      37
A
Highlights
• Record Sales up 13.3% to $247.8 million with strong total and LFL sales growth
in both Australia and New Zealand
• 2020 Strategic Growth plan announced in September 2017 to increase annual
sales to $250 million by FY20 has now been delivered one year ahead of
schedule – with growth set to continue
• Potential to open a further 20-30 stores over the next 2 years, with 5 new stores
already confirmed to open in 1H20
• Additional opportunities exist for landlord funded refurbishments and expansions
of existing stores
• Significant growth opportunity exists by expanding Children’s sleepwear options
online only
• Significant growth opportunity exists by expanding P.A. Plus options online only
Overview of Results
Sales $247.8m
Var LY +13.3%
Store movements Jul 18 Open Close1 Jul 19
Australia 95 8 1 102
New Zealand 14 1 - 15 Notes:
1. Store movements table reflects permanent store closures only,
Myer Concession 20 - - 20 and does not include temporary store closures
129 9 1 137
38A
Highlights
• FY19 Sales up 13.7% to $241.9m - a particularly pleasing result for the
group’s original brand founded in 1970
• FY19 LFL sales up 13.6%
• 4 stores were closed in the last 12 months as part of the ongoing program
to close unprofitable stores. The closure of these stores is EBIT positive
for the brand despite the headline loss of sales in these stores
• Just Jeans has a strong, distinctive and competitive market position
• Differentiation through the international branded denim business where
investment in width of range, instock of sizes and personal service
continues to deliver a great competitive advantage
• Ongoing investment in better merchants to drive further growth
• Focus on disciplined execution of markdown management in a highly
competitive market leaving a clean inventory position to commence FY20
Overview of Results
Sales $241.9m
Var LY +13.7%
Store movements Jul 18 Open Close1 Jul 19
Australia 197 1 3 195
New Zealand 45 1 1 45 Notes:
1. Store movements table reflects permanent store closures only,
242 2 4 240 and does not include temporary store closures
39A
Highlights
• FY19 Sales up a 6.7% to $168.7 million delivering a strong result for the
brand
• FY19 LFL sales up 6.9% - stronger than overall sales growth
• 7 stores were closed in the last 12 months as part of the ongoing
program to close unprofitable stores. The closure of these stores is EBIT
positive for the brand despite the headline loss of sales in these stores
• Jay Jays has a strong, distinctive and competitive market position
• Ongoing investment in better merchants to drive further growth
• Focus on disciplined execution of markdown management in a highly
competitive market leaving a clean inventory position to commence FY20
Overview of Results
Sales $168.7m
Var LY +6.7%
Store movements Jul 18 Open Close1 Jul 19
Australia 177 3 3 177
New Zealand 34 1 4 31
Notes:
211 4 7 208 1. Store movements table reflects permanent store closures only,
and does not include temporary store closures
40A
Highlights
• FY19 Sales up 3.5% to $128.4 million
• FY19 LFL sales up 6.1% - stronger than overall sales growth
• 4 stores were closed in the last 12 months as part of the ongoing program to close
unprofitable stores. The closure of these stores is EBIT positive for the brand
despite the headline loss of sales in these stores
• FY19 Online Sales continue to drive overall growth at a significantly higher EBIT
margin than the store portfolio
• Portmans has an extremely strong and distinctive market position
• Investment to continue in social media to maximise customer potential
• Ongoing investment in better merchants to drive further growth
• Focus on disciplined execution of markdown management in a highly competitive
market leaving a clean inventory position to commence FY20
Overview of Results
Sales $128.4m
Var LY +3.5%
Store movements Jul 18 Open Close1 Jul 19
Australia 87 1 2 86
New Zealand 12 1 2 11
Notes:
99 2 4 97 1. Store movements table reflects permanent store closures only,
and does not include temporary store closures
41A
Highlights
• FY19 Sales up 3.3% to $71.5 million
• FY19 LFL sales up 3.2%
• 2 stores were closed in the last 12 months as part of the ongoing program
to close unprofitable stores. The closure of these stores is EBIT positive
for the brand despite the headline loss of sales in these stores
• Jacqui E has an extremely strong and distinctive market position
• Ongoing investment in better merchants to drive further growth
• Focus on disciplined execution of markdown management in a highly
competitive market leaving a clean inventory position to commence FY20
Overview of Results
Sales $71.5m
Var LY +3.3%
Store movements Jul 18 Open Close1 Jul 19
Australia 78 - 1 77
New Zealand 20 1 1 20
Notes:
98 1 2 97 1. Store movements table reflects permanent store closures only,
and does not include temporary store closures
42A
Highlights
• The appointment of Judy Coomber to role of Managing Director Peter Alexander and Dotti,
together with the return of Deanna Moylan to the group as Dotti Group General Manager in
March 2018 reporting to Judy, is delivering a turnaround in performance
• FY19 LFL sales up 2.2% were stronger than overall sales, with improvement in profit
margins being delivered through changes to sourcing strategy
• 9 stores were closed during FY19 as part of the ongoing program to close unprofitable
stores. The closure of these stores is EBIT positive for the brand despite the headline loss
of sales in these stores
• Capital investment in new store concepts continued in FY19, largely funded by landlords
• New store concept investment at Melton (VIC), Eaton Fair (WA) and Mt Maunganui
(NZ), and also at the relocation and refurbishment of Maroochydore (QLD)
• 2 stores refurbished in existing locations in Australia
• 93 stores received fixture upgrades in Australia
• Online Sales continued to grow ahead of the market with this channel delivering significantly
higher EBIT margin than the Brand average
Overview of Results
Sales $106.3m
Var LY -0.1%
Store movements Jul 18 Open Close1 Jul 19
Australia 98 2 7 93 Notes:
1. Store movements table reflects permanent store closures only,
New Zealand 20 1 2 19 and does not include temporary store closures
118 3 9 112
43B
B Appendix
Notes regarding significant and other one-off items excluded from underlying results
• FY19: Recent political developments in the United Kingdom, including the appointment of Boris Johnson as Prime Minister, have added
further political and economic uncertainty to an already distressed retail and landlord environment. Many retailers including Top Shop,
Paperchase, Debenhams, House of Fraser, Monsoon and Accessorize are currently trading through UK insolvency processes (such as
CVAs – Company Voluntary Arrangements) which has led to material reductions in rent being provided by landlords to keep these
retailers open and operating. Smiggle UK successfully launched in February 2014. To date, the business’ store portfolio has generated
significantly more cash flow than the capital invested and the brand has achieved a very strong and distinct market position. To
maximise the group’s leverage with landlords to achieve significantly lower rents in a very distressed and uncertain macro-economic
environment, the Premier Board has decided to exercise the majority of the lease break clauses that were strategically negotiated as a
risk mitigation strategy upon entering the UK market. As a direct result, the Premier Board has prudently decided to accelerate the UK
store depreciation to lease break dates, incurring a one-off Brexit accelerated depreciation and associated costs charge of $25.9 million
(pre-tax) in FY19. Typically, specialty store leases un the UK are 10 years or longer. As a risk mitigation strategy, since launching
Smiggle UK in February 2014, the Premier Board has strategically negotiated 5 year break clauses in the majority of leases to provide
future flexibility. The Brexit accelerated depreciation & associated costs systematically accelerates the depreciation to the strategically
negotiated lease break dates remaining in 117 out of 134 stores. The exercising of these lease break options provides Premier
maximum flexibility and leverage to achieve lower rents in a distressed retail and landlord environment.
• FY18: During 2008, Premier Investments acquired Just Group Limited, and in line with Accounting Standards upon acquisition,
recognised $477.1 million in goodwill and $376.2 million in brand names. In accordance with Accounting Standards, the carrying values
of intangible assets are reviewed annually for impairment. In line with the changing structure of retail, the Board prudently decided to
recognise an impairment expense of brand names within the casual wear cash generating unit (CGU) of $30 million (pre and post
tax). After this impairment expense, Premier reported statutory net profit after tax of $83.6 million. The applicable Accounting Standards
do not allow for the uplifting value either in total or in specific brands beyond the original cost allocation. Therefore, the financial
statements do not reflect the significant value creation enjoyed by Premier shareholders since the 2008 acquisition for the Just Group
as a whole, and specifically in the case of Smiggle and Peter Alexander. As an example, the combined sales of these two brands
delivered sales of $512 million in FY18 compared to $66 million in FY08. This result is a function of Premier’s strategy to grow its unique
assets and compete in the apparel industry. The impairment expense for the FY18 year was non-cash
• FY18: Premier’s other one-off charges in FY18 totalled $6.4 million pre-tax (FY17: $7.7 million pre-tax) and included costs incurred on
relocation and pre-moving costs associated with the new Premier owned head office of Premier Retail, costs in relation to Premier’s
investment in Myer Holdings Limited and one-off Smiggle Europe expansion costs.
44B
B Appendix
Overview of Premier’s non–IFRS financial information
• IFRS financial information is financial information that is presented in accordance with all relevant accounting standards.
• Non-IFRS financial information is financial information that is presented other than in accordance with all relevant accounting
standards. For example: significant, one-off items, non-recurring costs, like for like sales, underlying EBIT, underlying NPBT and
underlying NPAT.
• Any non-IFRS financial information is clearly labelled to differentiate it from reported/IFRS financial information. Premier Investments
provides reconciliations in the footnotes and appendix in order to allow the reader to clearly reconcile between the IFRS and non-
IFRS financial information.
• Premier Investments’ management believes that the presentation of additional non-IFRS information in its results presentations
provides readers of these documents with a greater understanding into the way in which management analyses the business as well
as meaningful insights into the financial condition or Premier’s overall performance.
• The Australian Securities and Investments Commission (ASIC) acknowledges the relevance of non-IFRS financial information in
providing “meaningful insight” as long as it does not mislead the reader.
Forward looking statements
• Any forward looking statements contained in this document have been based on expectations at the date of preparation of this
document about future events. The forward looking statements included in this document may generally be identified by use of
forward looking words such as believe, target, aim, expect, planned or other similar words. Similarly, statements that describe
Premier’s objectives, plans, goals or expectations are, or may be, forward looking statements. Forward looking statements involve
known and unknown risks, uncertainties, assumptions and other important factors that could cause actual results to differ materially
from the expectations. Nothing contained in this document is, or may be relied on as, a promise or representation as to the accuracy
or likelihood of fulfilment of any forward looking statements, except to the extent required by law. You are therefore cautioned not to
place undue reliance on any such forward looking statements.
• Subject to any obligations under the Corporations Act or the ASX Listing Rules, Premier does not give any undertaking to update or
revise any forward looking statements after the date of this document to reflect any change in expectations in relation thereto or any
change in events, conditions or circumstances on which any such statement is based.
45You can also read