Metsä Board Corporation Investor presentation - January - June 2019
←
→
Page content transcription
If your browser does not render page correctly, please read the page content below
Metsä Board Corporation
Investor presentation
January – June 2019
Contents
            This is Metsä Board …………………………       3    H1 2019 Results …………………………..           32
            Planned investments ………………………..      14   Sustainability ……………………………….           45
            Profitability drivers …………………………..   19   R&D …………………………………………                   56
            Operating environment ……………………..     27   Owners, management, contacts ………....   67

    Investor presentation
2
    1–6/2019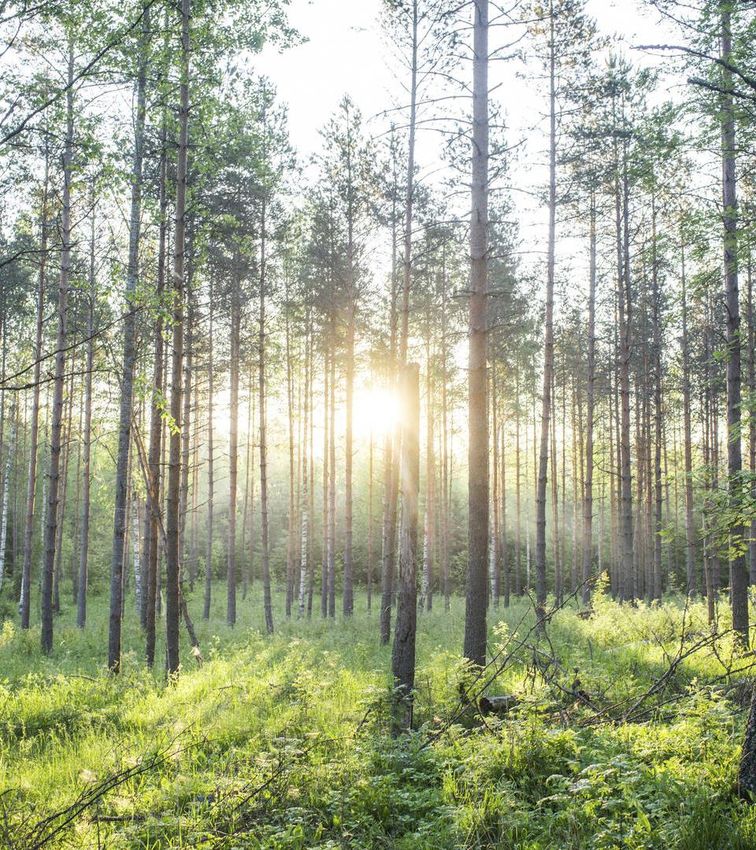
Metsä Board in brief                                                                                           Sales split by product
            Year 2018: Sales EUR 1.9bn, comparable operating result EUR 252m,                                               Market
            ROCE 14.4%, Capex EUR 70m, Personnel 2,352                                                                       pulp                 Folding
                                                                                                                            18 %                  boxboard
                                                                                                                                                  56 %
             Total paperboard capacity                                                                                                FY 2018:
                            2Mt/a                                          8                                               White
                                                                                                                                     EUR 1,944m

                     Net pulp balance                                production units                                  kraftlainer
                                                                 in Finland and Sweden                                       26 %
                      +600,000t/a

             MAIN CUSTOMERS                                    STRONG MARKET POSITION                                       Sales split by region
             Brand-owners, converters, merchants               #1 in folding boxboard and white kraftliner in Europe                 APAC
             and manufactures of corrugated products           #1 in coated white kraftliner globally                                 8%
                                                               Largest European importer of folding boxboard to US
             TOP10 customers: ~25% of sales
             Largest customer:
Metsä Board is focused on premium fresh fibre
paperboards with various end-uses
Folding boxboards         Food service boards          White kraftliners
Packaging solutions for   Solutions for food service   E-commerce, retail-ready
consumer goods                                         tray and point-of-sale solutions
Our fresh fibre paperboards offer solutions for global trends

GLOBALISATION AND     SUSTAINABILITY     FOOD SAFETY          E-COMMERCE
URBANISATION
                      We use only        We have good         Our paperboards
We offer recyclable   renewable fresh    control of raw       offer a strong
products that are     fibres from        materials, which     promotion and
ideal for the         sustainably        guarantees purity    branding
circular economy      managed northern   and safety in food   experience
                      forests            contact uses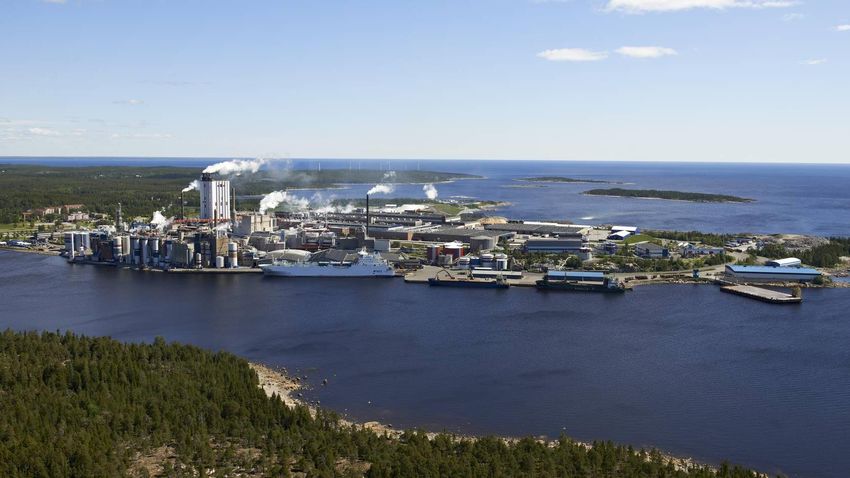
We have a leading position in Europe in our
                  main products
                     Folding boxboard                     White kraftliner
                                                                                      • Regional sales split of
                         in Europe                          in Europe                   paperboard deliveries:
                   Total capacity 3.8m tonnes         Total capacity 2.1m tonnes
                                                                                            • 70% EMEA
                                                                                            • 23% Americas
                      Others                 Metsä        Others              Metsä
                                                                                            • 7% APAC
                                             Board   #5                       Board
                                              #1                               #1     • In APAC we focus on high-
                    #5

                    #4
                                 35%                 #4
                                                               32%                      quality FBB segment
                                                                                      • We are the largest European
                                                                                        importer of FBB to US

                            #3
                                                          #3                          • We are #1 in coated white
                                        #2                               #2
                                                                                        kraftliners globally

    Investor presentation
6
    1–6/2019
Our production is close to our main raw material
                            Total paperboard capacity:                             Our net balance in pulp in 2019,
                   Folding boxboard (FBB): 1,345,000 t/a                           including the 24.9% ownership in
                      White kraftliner (WKL): 675,000 t/a                          Metsä Fibre, is 600,000 t/a
                                                            Wood sourced from
                                                            Finland, Sweden,
                                        Kemi                Baltics and Russia.   Äänekoski
                                        425,000 t/a WKL                           255,000 t/a FBB
                                        610,000 t/a Pulp*                         1.3 million t/a Pulp*

                                        Husum, SWE                                Simpele
                                        400,000 t/a FBB                           290,000 t/a FBB
                                        250,000 t/a WKL
                                        730,000 t/a Pulp

                                        Kaskinen                                  Joutseno
                                        370,000 t/a BCTMP                         330,000 t/a BCTMP
                                                                                  690,000 t/a Pulp*

                                        Kyro                                      Tako
                                        190,000 t/a FBB                           210,000 t/a FBB

               *Metsä Fibre mill
    Investor presentation
7
    1–6/2019
We have good control of wood raw materials,
                  from forests to pulp and board production
                 •      High availability of Northern wood
                 •      Consistent quality of fibres that are tailor-made for the end products

                                                                  METSÄ GROUP

                                                           METSÄLIITTO COOPERATIVE
                                           Group’s parent company, owned by 104,000 Finnish forest owners

                            METSÄ                METSÄ                   METSÄ                 METSÄ              METSÄ
                            FOREST               FIBRE                   WOOD                  BOARD              TISSUE

                     Wood supply and       Pulp and sawn          Wood products         Paperboard          Tissue and
                     forest services       timber                                                           cooking papers

                                                                   METSÄ BOARD
                                                                    OWNS 24.9%

                                                       Through Metsä Fibre’s ownership Metsä
                                                         Board’s annual net pulp balance is
    Investor presentation
8
    1–6/2019
                                                            600,000 tonnes long in 2019
We have been growing well above average market growth rate
during past years …
                               Metsä Board’s annual paperboard deliveries and current capacity, 1,000 tonnes

                                                                            Total paperboard capacity 2 million tonnes
                2 000                                                                                                       2 000

                1 500                                                                        658              615           1 500
                                                                             580                                                              Annual global
 1,000 tonnes

                                                             539                                                                             demand growth
                1 000                       444                                                                             1 000               for folding
                        373
                                                                                                                                              boxboard and
                                                                                                                                             white kraftliner is
                                                                                             1144             1215                           estimated to be
                 500                                                         988                                            500                     3%
                        763                 801              865

                   0                                                                                                        0
                        2013               2014              2015           2016             2017            2018
                               White kraftliner deliveries     Folding boxboard deliveries      Total paperboard capacity
                                                                                                                                    Source: Metsä Board´s own research
… driven by paperboard capacity increases

                               Capital expenditure and depreciation                  Investments in growth 2011–2018:

                                                                                     2018         New baling line in Kaskinen BCTMP mill:
                        180                                                                       30,000 new BCTMP capacity
                        150                                                                       New sheeting line in Äänekoski (to be in
          EUR million

                                                                                                  production 9/2019)
                        120
                                                                                     2017         New extrusion coating line in Husum:
                         90                                                                       100,000 t/a PE coating capacity
                         60                                                          2015–16      New folding boxboard production line in
                                                                                                  Husum: 400,000 t/a of FBB and linerboard
                         30                                                                       production line conversion: 250,000 t/a of
                                                                                                  WKL
                          0
                              2011 2012 2013 2014 2015 2016 2017 2018 2019E          2011–12      Debottlenecking in Simpele, Äänekoski and
                                                                                                  Kyro mills: total 150,000 t/a of FBB
                                 Maintenance capex        Growth capex
                                 Depreciation

10
     Investor presentation      Note! 2019E Capex does not include the planned investments announced on 26 April 2019
     1–6/2019
Our focus is now on profitability and a strong
balance sheet …
Comparable ROCE: Net debt/comparable EBITDA: Dividend policy:
At least 12% Maximum level 2.5x Payout ratio at least 50% of net result
76
< 2.5x
14.4 2,0
44 50 51
11.3 11.2 11.7 > 50%
> 12%
8.1 1,2 1,2 1,2
1,0
2015 2016 2017 2018 H1/19 2015 2016 2017 2018 6/19 2015 2016 2017 2018
In April, Metsä Board removed its earlier growth target for annual paperboard volumes. The target was to exceed average market growth.
Other financial targets and the dividend policy remained unchanged.
Investor presentation
11
1–6/2019… and our aim is to create the highest possible
shareholder value
CAGR in dividend
+30%
Dividend, EUR and payout ratio, % in 2012–2018 Enterprise value, EUR million
0,30 100%
3500
0,25 3000
75%
0,20 2500
0,15 50% 2000
1500
0,10
25% 1000
0,05
500
0,00 0%
2012 2013 2014 2015 2016 2017 2018 0
2012 2013 2014 2015 2016 2017 2018 6/2019
Dividend, EUR Dividend/EPS, %
Note! Year 2018 total distribution consists of a Net debt Market capitalization, EUR million
dividend of EUR 0.10 and other distribution of
equity of EUR 0.19 per share
12 Investor presentation
1–6/2019Capital allocation in 2019
Free cash flow in EUR million and % of EBITDA
• Free cash flow
– Since 2016 improved FCF as a result of improved EUR million %
profitability, decreased capex and good working 200 Comparable 80
EBITDA, LTM,
capital discipline EUR 323 million
150 60
• Our capital allocation for 2019
100 40
– EUR 103 million dividend paid in April
– Approximately EUR 100 million to reduce debt 50 20
– CAPEX: return-based allocation (ROCE above 12%), 0 0
ongoing pre-engineering phase regarding the
renewal of Husum pulp mill -50 -20
-100 -40
2013 2014 2015 2016 2017 2018 LTM
FCF, EUR million FCF/EBITDA,%
13
Investor presentation FCF=Cash flow from operations after investments
1–6/2019
LTM = 07/2018–06/2019Investment plans by Metsä Board and Metsä Fibre
Metsä Board and Metsä Fibre are planning three major
investments with total value of EUR 2 billion
The aim is to further improve the competitiveness of pulp and energy production
and move towards fossil-free production

Metsä Board: Husum, SWE          Metsä Fibre: Kemi, FIN          Metsä Fibre: Rauma, FIN
Renewal of the pulp mill         New bioproduct mill             New pine sawmill line
EUR ~300 million (first phase)   EUR ~1.5 billion                EUR ~200 million

                                            Metsä Board owns 24.9% of Metsä Fibre
Investment in Husum pulp mill
would enable the long-term
development of the integrate
First phase: A new recovery boiler and a new turbine
– Reduced energy costs, improved reliability of production
and decreased duration of maintenance
– Self-sufficiency in electricity would increase to over 80%,
and be entirely based on renewable biomass
– Annual production capacity remains at 750,000 tonnes
Second phase: Replacing the old fibre lines with one
new fibre line
Cost efficient, long-term energy production solution
will create a solid foundation to increase paperboard
capacity in the future.
Investor presentation
16
1–6/2019Estimated time schedule for the Husum pulp mill renewal
Prefeasibility Final
study on the investment
New
renewal decision ~24 months after the investment decision recovery
concluded expected
boiler and
to be made in
turbine in
Q4 2019, at
operation
06 / 19
the earliest
2019 2020 2021 2022
The investment value of the first phase is ~EUR 300 million,
divided between the years 2019–2022
The second phase of the investment would take place during
the 2020s after the first phase is fully completed.
Investor presentation
17
1–6/2019Metsä Fibre is planning
two major investments
New bioproduct mill* in Kemi, Finland
• Size of the investment EUR 1.5 billion
• Annual capacity 1.5 million tonnes of chemical pulp and
several other bioproducts
• Final investment decision expected in the summer of 2020
New sawmill line in Rauma, Finland
• Size of the investment EUR 200 million
• Annual capacity 750,000 cubic meters
• If realised, would be the most modern and efficient sawmill
line in the world
• Final investment decision in the beginning of 2020
*)
would replace the existing pulp mill in Kemi, with
Investor presentation
18
1–6/2019 annual capacity of 630,000 tonnes of chemical pulpMain contributors in Metsä Board’s profitability
Our main profit components and sensitivities
            Component                                      Change            Impact on EBIT

            Folding boxboard    Price                      +/- 10%         > EUR 100 million

            White kraftliners   Price                      +/- 10%          > EUR 50 million

            FX                  USD/EUR                    +/- 10%            EUR 70 million

                                SEK/EUR                    +/- 10%            EUR 50 million

            Pulp                Pix price of SW/HW         +/- 10%            EUR 25 million
                                per tonne
                                                                                               In 2018, Metsä Board sourced 5.5 million m3
            Wood                Price per m3 in             +/-10%           EUR 30 million*
                                                                                               wood, of which 37% from Sweden, 28%
                                Finnish mills
                                                                                               Finland, 20% Baltics and 15% Russia.
                                Price per m3 in             +/-10%            EUR 20 million   Including the 24.9% share from Metsä Fibre,
                                Husum                                                          the total sourcing was 8.5 million m3

     Investor presentation                        * incl. ownership in Metsä Fibre
20
     1–6/2019
FX impacts and sensitivies
FX impact, including hedges:
• Q2 2019 vs Q1 2019: Neutral Annual transaction exposure
• H1 2019 vs H1 2018: EUR +21 million total EUR 1.1 billion
• Q3 2019 vs Q2 2019, estimated: Neutral
Other
currencies
GBP 2%
FX sensitivities excluding hedges 7%
10% strengthening of foreign currency vs. EUR
would have an impact on Metsä Board’s EBIT of
Currency Next 12 months
USD
SEK 57 %
USD, $ EUR +65 million
34 %
SEK, kr EUR -40 million
GBP, £ EUR +8 million
Investor presentation
21
1–6/2019Main cost components and expected development
Metsä Board’s cost split in 2018
incl. 24.9% share from Metsä Fibre’s costs
Cost Near-term outlook
component
Other fixed
Wood Prices in Finland and Sweden are expected to remain 14 %
stable. In the Baltics, the price level will depend on the Wood
demand in export markets 28 %
Logistics In line with general cost inflation Personnel
13 %
Chemicals In line with or below general cost inflation
Energy Stabilisation following the oil and electricity price hikes in
Energy
2018 14 %
Logistics
Personnel Approximately +2% y-on-y, mainly based on collective 16 %
agreements Chemicals
15 %
Other fixed In line with or below general cost inflation
Total costs in 2018: EUR 1.7 billion
(2017: EUR 1.6 billion)
Investor presentation
22
1–6/2019Price development of pulp in Europe (PIX)
With a net long position in pulp, Metsä Board gains from higher pulp prices
Price per tonne, USD and EUR
1250 1250
1200 Long-fibre, USD 1200
1150 1150
1100 1100
1050 Short-fibre, USD 1050
1000 1000
950 950
900 900
850 850
800 800
750 750
700 Long-fibre, EUR 700
650 650
600 600
550 550
500 Short-fibre, EUR 500
450 450
400 400
350 350
'10 '11 '12 '13 '14 '15 '16 '17 '18 '19
Source: Fastmarkets Foex
Investor presentation
23
1–6/2019Price development of folding boxboard and
white kraftliner in Europe
EUR/ tonne EUR/ tonne
Folding boxboard
1200 1200
1100 1100
1000 1000
900 900
White-top kraftliner
800 800
700 700
600 600
500 500
2010 2011 2012 2013 2014 2015 2016 2017 2018 2019
Sources: Fastmarkets RISI & Fastmarkets FOEX
Investor presentation
24
1–6/2019Price development of roadside pulpwood in Finland
and Sweden
Pulpwood roadside prices in Finland, EUR/m3 Pulpwood roadside prices in Sweden*, SEK/m3
40 400
38 380
36 360
34 340
32 320
30 300
28 280
26 260
24 240
22 Spruce Birch Pine 220 –Spruce –Birch –Pine
20 200
2010
2011
2012
2013
2014
2015
2016
2017
2018
2019
2010
2011
2012
2013
2014
2015
2016
2017
2018
2019
Sources: Luke (Natural Resources Institute Finland) and Skogsstyrelsen (The Swedish Forest Agency)
Investor presentation
25
1–6/201926
1–6/2019
1,13
1,16
1,22
1,25
1,28
1,19
1,1
Investor presentation
29.12.2017
29.1.2018
28.2.2018
EUR/USD
31.3.2018
30.4.2018
31.5.2018
30.6.2018
31.7.2018
31.8.2018
30.9.2018
31.10.2018
30.11.2018
31.12.2018
31.1.2019
28.2.2019
31.3.2019
30.4.2019
31.5.2019
30.6.2019
10,1
10,5
10,7
10,9
10,3
9,7
9,9
29.12.2017
29.1.2018
EUR/SEK
28.2.2018
31.3.2018
30.4.2018
31.5.2018
30.6.2018
31.7.2018
Metsä Board gains from strong USD and weak SEK
31.8.2018
30.9.2018
31.10.2018
30.11.2018
31.12.2018
31.1.2019
FX rates development: EUR/USD and EUR/SEK
28.2.2019
31.3.2019
30.4.2019
31.5.2019
30.6.2019Operating environment for fresh fibre paperboards
Paperboard is the packaging material of the future

    The total packaging market is USD 850 billion       Average annual growth rate of paperboard packaging

                  Glass                                      350
                                  Paperboard                        +3% per year 2017–2022
        Metal          7%                                    300

                 13%                                         250
                              36%

                                                    USD bn
                            USD                              200
                            300 bn
                                                             150
                 34%
                                                             100
                              10%
       Plastic                       Other                   50
                                     fibre-
                                     based                    0
                                                                   2012 2013 2014 2015 2016 2017      2022F
                                                                                                   Source: Smithers Pira
We have good growth opportunities in premium
paperboards
FSB
36%
Americas EMEA FBB APAC
Other
fresh fibre
grades
FSB FSB
28%
FBB FBB 41%
Other Other Recycled
fresh fibre fresh fibre CWKL grades
grades 38%
grades WKL
Recycled WKL
Recycled CWKL White
77% grades White
grades WKL testliner testliner
White testliner
Cartonboard White linerboard Cartonboard White linerboard Cartonboard White linerboard
Total annual 10 million 3 million 10 million 5 million 22 million 3 million
demand: tonnes tonnes tonnes tonnes tonnes tonnes
FSB = food service board, FBB = folding boxboard, SBS & CUK = other fresh fibre grades, WLC = recycled grades
WKL = uncoated white kraftliner, CWKL=coated white kraftliner
Investor presentation
29 Source: Metsä Board research based on several sources,
1–6/2019
e.g. CEPI Cartonboard and Containerboard, RISIWe sell globally, but have a regional approach
The Americas is the biggest growth area
AMERICAS EMEA APAC
SHARE OF TOTAL PAPERBOARD SHARE OF TOTAL PAPERBOARD SHARE OF TOTAL PAPERBOARD
DELIVERIES IN 2018 DELIVERIES IN 2018 DELIVERIES IN 2018
23% 70% 7%
Demand drivers: Demand drivers: Demand drivers:
• Emerging environmental • Acceleration in • Growing upper and middle
considerations environmental classes, and increased
commitments and purchasing power
• Trend for lightweight regulations
packaging – but limited • More brand-aware
local capacity in FBB • Stricter food safety consumers
requirements • Continued shift to modern
retail and mobile
commerce
Investor presentation
30
1–6/2019Branding and personalisation
becoming more important in
E-commerce
• Functionality, durability and consumer experience are the
key words
• Demand for white kraftliner driven by
– Increasing branding of the packaging
– Trend towards shipping the product in its own container
– Personalisation of boxes, supported by advanced technology
in digital printing
• The global value of E-commerce is expected to grow by
20% per year on average, increasing its share of the retail
trade from 10% to 18% in 2017–2021
Investor presentation Sources: eMarketer, Smithers Pira
31
1–6/2019Results for January – June 2019
Key financials
                                                                        Change                   Change
                                                                         Q2/19                    H1/19
                                                        Q2/19   Q2/19            H1/19   H1/18            FY 2018
                                                                          vs.                      vs.
                                                                         Q1/19                    H1/18

               Sales                           EUR, m   477     519      -9%     964     1,011    -5%        1,944
               EBITDA*                         EUR, m    68      84      -19%    158     178      -11%        344
               Operating result*               EUR, m    41      59      -31%    103     128      -20%        252

                 % of sales*                     %       8.6    11.4             10.7    12.7                 13.0
               Metsä Fibre’s share of
                                               EUR, m    16      30      -47%     38      58      -34%        124
               operating result*
               Earnings per share               EUR     0.10    0.12     -17%    0.27    0.27                 0.57

               ROCE*                             %       9.7    13.9             11.7    15.1                 14.4

               Capex                           EUR, m    18      15      20%      24      26      -8%           70

               Cash flow from operations       EUR, m    31      36      -14%     67      67                  151

               IB Net debt, at end of period   EUR, m   380     388      - 2%    380     388      -2%         335

33   Investor presentation   *comparable
     1–6/2019
Q2 in summary
• Steady market situation in folding
boxboards, more uncertainty in white
kraftliners
• Pulp prices continued to weaken
• Several planned maintenance shutdowns
at the Finnish mills
• Metsä Board and Metsä Fibre launched
pre-engineering phases for three major
investments
Investor presentation
34
1–6/2019Total paperboard delivery volumes in Q2 slightly
up from Q1
-9%
White kraftliner Folding boxboard +1%
489
500
440 445
400 161
173 170 171 149 134 138 146
163 152
1,000 tonnes
1,000 tonnes
300
200
304 299 297 328 297 302 299
265 276 293
100
0
Q1 2017 Q2 2017 Q3 2017 Q4 2017 Q1 2018 Q2 2018 Q3 2018 Q4 2018 Q1 2019 Q2 2019
H1 2018 total: H1 2019 total:
957k tonnes 886k tonnes
35
Investor presentation -7%
1–6/2019Paperboard delivery split in H1 2019 vs. H1 2018
Stable in FBB, main changes in white kraftliners in EMEA
Folding boxboard (FBB) deliveries in H1 2019 (H1 2018) White kraftliner (WKL) deliveries in H1 2019 (H1 2018)
1,000 tonnes 1,000 tonnes
APAC APAC
50k 4k (3)
(64)
Americas 8% Americas
120k 97k EMEA
(127) (93) 183k
EMEA 35% (237)
22% 432k 65%
(433)
71%
Total WKL deliveries
Total FBB deliveries H1 2019: 284,000 tonnes
H1 2019: 602,000 tonnes (H1 2018: 332,000)
(H1 2018: 624,000)
Investor presentation
36
1–6/2019Sales and profitability behind year-on-year levels
Sales Comparable operating result
EUR million EUR million and % of sales
2000
300 13.0% 12.7% 15,0
1600 Operating result,
240 10.5% 10.7% % of sales:
12,0
EUR million
EUR million
1200 8.0% Q2/19: 8.6%
180 9,0
Q1/19: 12.7%
800 519 477 Q2 120 6,0
59 Q2
400 41
60 3,0
492 487 Q1 69 62 Q1
0 0 0,0
2016 2017 2018 H1 2018 H1 2019 2016 2017 2018 H1 2018 H1 2019
Investor presentation
37
1–6/2019Higher FBB prices supported operating result in H1 2019,
negative from lower pulp prices and higher production
costs
Comparable operating result Comparable operating result
Q1 2019 vs. Q2 2019 H1 2018 vs. H1 2019
- market pulp - production costs
- annual maintenance - lower delivery volumes
Q1 2019:
H1 2018: - market pulp
EUR
EUR
62 million
128 million
Q2 2019: H1 2019:
+ FBB prices EUR EUR
+ paperboard production 41 million + improved prices in 103 million
costs paperboard
+ changes from FX
Investor presentation
38
1–6/2019H1 2019 ROCE at 11.7%
Return on capital employed, %
16%
14%
R12m
Target level > 12% 13.3%
12%
10% Q2/19:
9.7%
8%
6%
4%
Q1/16 Q2/16 Q3/16 Q4/16 Q1/17 Q2/17 Q3/17 Q4/17 Q1/18 Q2/18 Q3/18 Q4/18 Q1/19 Q2/19
Quarterly Rolling 12m Target
Investor presentation
39
1–6/2019Pulp prices in Europe have continued to slide
throughout H1 2019
Pulp price (PIX) development in Europe and China
• In 2019, activity in the pulp market picked
up in Q1, especially in China, but Long-fibre pulp, Europe Long-fibre pulp, China (net)
weakened again in Q2 USD
1 400
• The PIX price of NBSK in Europe has
1 200
declined by $200/tonne from the beginning
1 000
of year
800
• Annual maintenance shutdowns and 600
production curtailments by some producers
400
will reduce short term supply
200
• Producers’ inventory levels globally are 0
still very high
2012
2013
2014
2015
2016
2017
2018
2019
Source: Thomson Reuters Datastream/ Fastmarkets Ltd, Metsä BI
Investor presentation
40 Note! The specifications of PIX China Net index were renewed
1–6/2019
in the beginning of 2017. Earlier data not comparable with newCash flow from operations EUR 67 million in H1 2019
250
250
200
200
150 150
EUR million
EUR million
106
100 100
79
68
59 54 43
50 30 36 30 36 31 50
23 29
20 13
0 0
-3
-50 -50
Q3/17 Q4/17 Q1/18 Q2/18 Q3/18 Q4/18 Q1/19 Q2/19
Cash flow from operations, quarterly Free cash flow, quarterly
Cash flow from operations, rolling 12 months Free cash flow, rolling 12 months
Investor presentation
41
1–6/2019 Free cash flow = cash flow from operations − investmentsNet debt increased from Q1, leverage at 1.2x
600 3,0
Net debt / EBITDA target level:Debt and its maturity
Metsä Board’s both credit ratings are investment grade
30 June 2019
Rating agency Rating and Last update
• Interest-bearing debt on 30 June was EUR 466 million (30.6.2018: outlook
EUR 483 million) S&P Global BBB- 02/2018
stable Upgrade from BB+
• Interest-bearing net debt on 30 June was EUR 380 million
(30.6.2018: EUR 388 million) Moody‘s Investor Baa3 01/2019
Services stable Upgrade from Ba1
Long-term interest-bearing debt maturity profile 30 June 2019
250
200
EUR million
150
100
50
0
2019 2020 2021 2022–26 2027
Bonds Loans from financial institutions Pension loans Other loans
43
Investor presentation In addition, Metsä Board has an undrawn revolving credit facility of EUR 150 million maturing in
1–6/2019 2020 and unraised pension loans of EUR 166 millionNear-term outlook
• Paperboard delivery volumes in Q3 are expected to
remain roughly at the Q2 level
• Good market situation for FBB,
some uncertainty with white kraftliners
• Average market pulp prices will be lower in H2 2019
compared to H1 2019
• Planned maintenance shutdowns in Q3:
– Kemi integrate, Husum integrate (partly)
– Metsä Fibre’s Rauma pulp mill
• Stable production costs and FX impacts in Q3
compared to Q2
• Metsä Board’s comparable operating result for
Q3 2019 is expected to weaken compared to
Q2 2019
Investor presentation
44
1–6/2019Sustainability
“Our comprehensive approach
                                                                          to reducing our environmental
              Sustainability is on                                          impact means looking at all

              everybody’s agenda                                           aspects of our business, how
                                                                          they intersect and how we can
                                                                             integrate new solutions to
                                                                               create meaningful and
                                                                                 sustained change.”
             • Growing consumer awareness:
                                                                               – Starbucks website
               Origin and transparency of
               materials, renewability, resource
               efficiency and recylability
             • Brand owners are committed to
               reducing their carbon footprints:   “We want low-carbon to become
                                                   the new normal, so we’re taking
               Lighter packaging reduces CO2       action to reduce GHG emissions
               emissions across the value chain      throughout our value chain.”

                                                         – Unilever website

     Investor presentation
46
     1–6/2019
Alternative to plastics:
Paperboard adds value to packaging
• Consumers regard paperboard as a more responsible choice than plastic packaging –
willingness to pay more for it
• Paperboard cartons preserved the cherry tomatoes at least as well as the plastic equivalent
• The climate effect of a recycled PET container was calculated at six times higher than the average
value for the paperboard cartons
A detailed consumer study with cherry tomatoes was carried out in Finland by Sense N Insight,
Luke (Natural Resources Institute Finland) and Metsä Board
Investor presentation
47
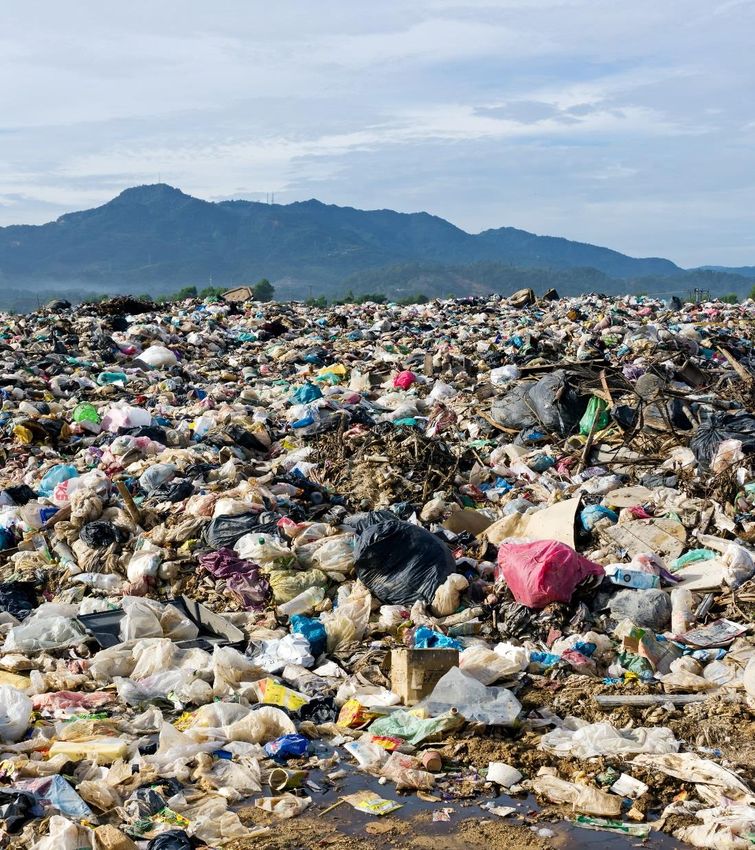
1–6/2019Fresh fibre paperboards offer solutions to major challenges Increased waste Replacing fossil- Reducing carbon Ensuring food generation due to based materials, footprint safety urbanisation i.e. plastics The solution: The solution: The solution: The solution: renewable energy, pure and safe Paperboard is renewable and efficient energy fresh fibres in food recyclable biodegradable and water usage in packaging – and widely wood fibre production recycled
Lighter packaging reduces CO2 emissions across the
value chain – Our fossil CO2 emissions per product tonne
have reduced by almost 50% since 2009

  Less energy, water and
  raw material consumed

                                          Less waste
                                          generated

                           Less
                           transport
                           weight
Wood is our main raw
material
• Metsä Board sources its
wood mainly from Finland
and Sweden (65 %)
• All wood used is 100% traceable and
comes from sustainably managed forest
sources ensuring the bio-diversity and
recreational use of forests
• 79% of wood sourced is certified
(remaining 21 % from controlled forest
sources)
Investor presentation
50
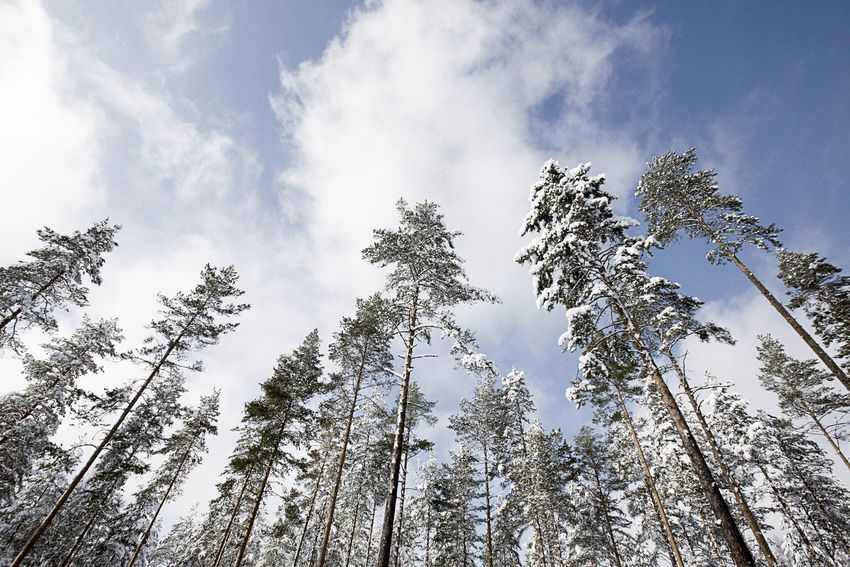
1–6/2019Finland – the largest forest cover in Europe
The area of Finland
5% Cities, villages and roads
Annual growth of Finnish forests is 10%
100+
MILLION M3
over 100 million m3 – more than ever
10%
Fields and agricultural use
Lakes and rivers
Forests grow more than they are used,
annual harvesting 72 million m3 (2017)
Four seedlings are planted for each
harvested tree 75% Forest
Over 20% of the Finnish export comes
from forest-based products
51We have decreased our
process water use by 20%
since 2010
• Metsä Board uses only
surface water in its processes
• Water is been recirculated
in processes several times
• 99% of the water used is returned
back to the close-by waterways
after thorough purification
Investor presentation
52
1–6/2019Primary energy used in 2018
(total 12.0 TWh)
Our energy efficiency has improved
Fossil-based
by almost 12% during 2009–2018 18 %
Renewable,
mainly
wood-based
Nuclear
55 %
power
• Over 80% of primary energy we use is fossil free 27 %
• After OL31) starts up, we will be nearly self-sufficient in
electricity in Finland
Electricity sourced in 2018
− Including the electricity used in Husum mill, (total 2.4 TWh)
self-sufficiency will be nearly 80% Outsourced
generation
• Metsä Board’s shareholding in PVO2) is 3.2% 3% Own
generation
− Fair value as per 31 December 2018 was EUR 266 million 3)
21 %
Purchased
electricity
44 %
Through
1) Olkiluoto Nuclear Power Plant PVO
shareholding
2) Pohjolan Voima Oyj is a non-listed public limited liability company. 32 %
It supplies electricity and heat for its shareholders at cost price
Investor presentation 3) Out of 44% share of purchased energy, 14% is from Metsä Fibre
53
1–6/2019Metsä Board’s strategic 2030 sustainability objectives and targets
WE BRING WE WORK FOR A WE OFFER WE CREATE
THE FOREST TO YOU BETTER SUSTAINABLE CHOICES WELL-BEING
CLIMATE AND
Certified wood fibre ENVIRONMENT
• Share of certified fibre >90%
Fossil free mills Fossil free raw materials Responsible corporate culture
Increasing the amount of • Fossil CO2 emissions • Share of fossil free raw • Ethics barometer 100%
carbon stored in forests and 0 tCO2 (Scope 1) materials 100%
products Accident-free work
• Area of regeneration and Fossil-free purchased energy Sustainable supply chain environment
management of young stands • Fossil CO2 emissions, • Sustainable suppliers 100% • Accident frequency LTA1 0
+30% vs. 2018 0 tCO2 (Scope 2) • Traceability of raw
• Amount of carbon stored in materials 100%
products (t)
Resource efficient production
+30% vs. 2018
• Utilisation of side-streams
100%
Safeguarding biodiversity • Process water use per
• Increasing the amount of product ton (m3/t)
decayed wood: high – 30% vs. 2018
biodiversity stumps in • Energy efficiency
improvement
90% of thinnings and
>10% vs. 2018
retention trees in all
regeneration logging sites
Investor presentation
54
1–6/2019External recognition and commitments
Metsä Board has been included on the CDP
Water A List every year since 2015 and on Metsä Board scored the highest Metsä Board received a rating of
the CDP Climate A List since 2016. In recognition level “Gold” in AAA (on a scale of AAA-CCC) in
addition, Metsä Board has scored A- in the EcoVadis’ CSR ranking in 2018, Metsä Board was awarded
the MSCI ESG Ratings
CDP Forest programme since 2015, and is and is included in the top 1% of “Prime” status in ISS-oekom
assessment in June 2018.
included on the Supplier Engagement suppliers assessed across all corporate responsibility rating in
leader board in 2019 for its efforts to address categories. May 2018.
climate change.
As a member of Pack2Go Europe Metsä Metsä Board is committed to Metsä Board as a part of Metsä Metsä Board has an overall ESG
Board is committed to the environmental, Science Based Targets to Group is committed to the UN score of 86/100 and is
health and safety aspects within the on-the- reduce its GHG emissions in line Global Compact corporate considered a Leader in
go food and beverage packaging industry. with the goal of the Paris responsibility initiative and its Sustainalytics’ assessment in
Agreement. principles in the areas of human May 2018.
rights, labour, environment and
Investor presentation
55
1–6/2019
anti-corruption.Research and Development
Our key product development focus areas
               LIGHTWEIGHTING                         BARRIER BOARDS
                 • Improved BCTMP                     • Dispersion barriers
                 • Microfibrillated cellulose (MFC)   • Bio-based raw materials
                 • Strength additives

     Investor presentation
57
     1–6/2019
Our R&D and innovation work
is based on sustainability
• Metsä Board launched its renewed FBB
portfolio in April helping customers tackle big
issues in packaging: To save resources and
reduce carbon footprint
• A new R&D excellence centre to be established
in Äänekoski to boost the development of new
paperboard and packaging solutions of the
future
Investor presentation
58
1–6/2019The role of packaging is to promote the brand and
protect the product – in a cost-effective way
Metsä Board’s
Solid bleached board folding boxboard
(SBB)
PROMOTION
Brightness
Folding boxboard
(FBB)
Coated unbleached kraft
(CUK)
White lined chipboard
(WLC)
PROTECTION
Investor presentation Stiffness
59
1–6/2019We achieve high bending stiffness
from a strong outer layers and a
thick and light inner layer
Top coating
Bleached chemical pulp
High yield pulp (BCTMP)
or groundwood pulp
Bleached chemical pulp
Investor presentation
60
1–6/2019High-yield pulp makes the difference between folding boxboard
and other grades …
Light weight High strength and High brightness Consistent quality
– better yield bending stiffness and smoothness – improved
and sustainability – secure – excellent production
protection printability efficiency… and leave more trees standing
SBS =
(100% chemical pulp)
5 m3 of wood per tonne of pulp
Metsä Board FBB
(up to 70% BCTMP, =
30% chemical pulp )
3.4 m3 of wood per tonne of pulp
Investor presentation
1–6/2019Lighter-weight paperboards: Better with Less
The weights equal to a print job of 30 000 sheets on a standard size printing press
Metsä Board
lightweight paperboard
Average FBB –
Folding boxboard
SBB –
Solid bleached board
WLC –
White lined chipboard
Investor presentation
63
1–6/2019Metsä Board enhances its leading
position in premium lightweight
paperboards
In April 2019, we announced of our new, improved FBB
portfolio, that answers to increasing demands for
sustainability, product safety and brand promotion
– Further opportunities for lightweighting
– Enhanced visual properties
– Industry-leading quality consistency
– Improved supply security and availability
Enabled by our improved high-yield BCTMP and full
R&D focus on paperboard
Investor presentation
64
1–6/2019Brand-owners seek more
sustainable packaging solutions
• Fresh fibre paperboards can help replace non-
renewable packaging materials
• Metsä Board’s eco-barrier paperboard
– is developed especially for food service use with
short food contact time and when light grease
resistance is sufficient
– has an industrial compostability certification
Investor presentation
65
1–6/2019Getting familiar with terminology:
Barrier boards types
Examples of materials used in coating
BIODEGRADABLE Note!
Biobased material
PVA (polyvinyl alcohol) =
PLA (polylactide): often
NON-BIOBASED
PBS (polybutylene Renewable material
based on corn starch
succinate)
BIOBASED
≠
Compostable
≈
PE: made from fossil raw
Green PE: made from
materials, used in Biodegradable
biomaterials
extrusion coating
NON-BIODEGRADABLE
Investor presentation
66
1–6/2019Owners, management and contact information
Market cap and ownership distribution
                Metsä Board shares are listed on Nasdaq Helsinki

               Market cap and foreign owners                                                        Ownership distribution
               30 June 2019                                                                         30 June 2019
               EUR million                                                              %            Foreign
                 3 000                                                                  25           owners
                                                                                                      15%
                 2 500                                                                  20
                 2 000
                                                                                        15                                      Metsäliitto
                 1 500                                                                                                         Cooperative
                                                                                             Domestic
                                                                                                                                  41%
                                                                                        10     private
                 1 000                                                                       investors
                                                                                        5       22%
                   500

                       0                                                                0
                             12/2014   12/2015   12/2016   12/2017   12/2018   6/2019

                                           Market cap, EUR million                                              Domestic
                                                                                                               institutional
                                           Share of foreign owners, %                                           investors
                                                                                                                   22%

     Investor presentation
68
     1–6/2019
Metsä Board Corporate Management Team
Mika Joukio Jussi Noponen Sari Pajari
CEO CFO SVP, Marketing and Sales
Chairman of CMT since 2014 Member of CMT since 2016 Member of CMT since 2011
MG employee since 1990 MG employee since 2000 MG employee since 2007
Share ownership: 297,700 Share ownership: 73,000 Share ownership: 66,075
Harri Pihlajaniemi
Ari Kiviranta SVP, Production Camilla Wikström
SVP, Development SVP, HR
Member of CMT since 2017
Member of CMT since 2014 MG employee in 2001-2004 Member of CMT since 2019
MG employee since 1993 and since 2017 MG employee since 2001
Share ownership: 50,000 Share ownership: no ownership Share ownership: 17,807
Share ownerships are B-shares.
Investor presentation MG = Metsä Group
69
1–6/2019Contact information
Katri Sundström
Vice President, Investor relations
Tel +358 400 976 333
katri.sundstrom@metsagroup.com
Metsä Board Corporation
P.O. Box 20
02020 Metsä, Finland
www.metsaboard.com
Investor presentation
70
1–6/2019Disclaimer
This presentation includes forward-looking statements. The words “believe,” “expect,” “anticipate,” “intend,” “may,” “plan,”
“estimate,” “will,” “should,” “could,” “aim,” “target,” “might,” or, in each case, their negative, or any similar expressions
identify certain of these forward-looking statements. Others can be identified from the context in which the statements are
made. By their nature, forward-looking statements are subject to assumptions, risks and uncertainties. Although we
believe that the expectations reflected in these forward-looking statements are reasonable, actual results may differ, even
materially, from those expressed or implied by these forward-looking statements. We urge presentation participants not to
place undue reliance on such statements.
The information and views contained in this presentation are provided as at the date of this presentation and are subject to
change without notice. Metsä Board does not undertake any obligation to publicly update or revise forward-looking
statements, whether as a result of new information, future events or otherwise, except to the extent legally required.
Viewers should understand that this presentation does not constitute, and should not be construed as, an offer to buy or
subscribe for Metsä Board’s securities anywhere in the world or an inducement to enter into any investment activity
relating to the same. No part of this presentation should form the basis of, or be relied on in connection with, any contract
or commitment or decision to invest in Metsä Board securities whatsoever. Potential investors are instructed to acquaint
themselves with Metsä Board’s annual accounts, interim reports and stock exchange releases as well as other information
published by Metsä Board to form a comprehensive picture of the company and its securities.
Metsä Board publishes inside information according to Market Abuse Regulation (MAR) and rules of the Nasdaq Helsinki.
Investor presentation
71
1–6/2019You can also read