Bekaert Investor Presentation - September 2021

Page created by Rebecca Dunn
 
CONTINUE READING
Bekaert Investor Presentation - September 2021
Bekaert Investor
 Presentation

    September 2021
Bekaert Investor Presentation - September 2021
Introduction to Bekaert

                                  OVERVIEW
                                   • The global leader in steel wire transformation and coating technologies
                                   • Leading market position across diverse markets and geographies
                                                                                                                        1 800
                                   • Rich 140-year history of value creation and technological innovation           patents and patent
                                   • Global presence with deep understanding of local needs                               rights

                                  STRATEGY
                                   • Optimizing value by actively managing and renewing the core business
                                     portfolio
                                                                                                                         120
                                   • Unlocking further growth through value-creating innovation, digital and          countries with
                                     sustainable opportunities, active portfolio management, and selective M&A in
                                     existing and adjacent markets
                                                                                                                    customers served

                                  CAPITAL ALLOCATION
                                   • Well-capitalized to invest in R&D, organic growth, and accretive M&A
                                     opportunities
                                                                                                                       27 000
                                   • Net debt / underlying EBITDA has been reduced from 2.7x to 0.7x                engaged employees
                                   • Dividend pay-out ratio policy targeted at 40% of net income                         globally

Investor presentation - Bekaert                                                                                                          2
Bekaert Investor Presentation - September 2021
Global presence across diverse end markets
Combined sales, including sales of joint ventures in Brazil of ~€0.7Bn in 2020

2020 SALES BY END MARKET
                                                                                 23%
                                                                14%                                        33%

            44%
            19%
                          Tire & Automotive
                          Construction - Infrastructure
                                                                       30%
             9%           Agriculture
             9%          Basic materials
              8%         Energy & utilities
              6%         Equipment
              5%         Consumer goods                                                Bekaert production plants
                                                                                       Bekaert offices
                                                                                       Bekaert Technology Centers

Investor presentation - Bekaert                                                                                     3
Bekaert Investor Presentation - September 2021
140+ years of innovation, growth and value creation

  PIONEERING                         INNOVATING                        GROWING                        PERFORMING                          PURSUING

 Established in Belgium in          First patent application in   Global expansion programs                 Performance                    Partnerships and
1880 as a small barbed wire                 June 1881                 throughout history                      culture                        collaboration
      manufacturer
                                   Tire cord development 1952       Early presence in Latin             Delivery on priorities              better together
 First acquisition abroad in                                         America and China
                                    In-house Engineering and                                        € 200 million paid in dividends   Operational and commercial
 1920 – first investment in
                                    R&D centers since 1960’s      Largest acquisition (Pirelli)               since 2018                      excellence
   Latin America in 1948
                                                                  and merger (Bridon): 2014-
                                                                            2016

     Pioneering in new             Preferred innovation partner    Organic/inorganic growth            Significant performance           Actions to unlock the
 technologies that address         of global technology leaders    plans in target markets:           improvement since 2019            company’s full potential
       mega trends:
                                    1 800+ patents in portfolio   Mobility | energy & utilities |    Very strong balance sheet          Innovation, digital, and
new mobility | urbanization |                                       lifting & hoisting | agri |                                          sustainability strategy
                                     Services and adjacent                                           Strong margin performance
   connected & smart |                                            construction & infrastructure
                                           solutions:                                                    in all Business Units           Value creation for all
   renewable energy |
                                                                                                    Lorem ipsum dolor                       stakeholders
  sustainability | reverse           Creativity beyond steel                                            Guidance revision
       globalization                                                                                 amet consectetur
                                                                                                            2021-2026
                                                                                                      adipiscing elit.
 Investor presentation - Bekaert                                                                                                                                  4
Bekaert Investor Presentation - September 2021
Bekaert Group Executive
Leading with a shared ambition

                                                                                 Oswald Schmid
                                                                                        CEO

 Stijn Vanneste                                  Arnaud Lesschaeve                           Curd Vandekerckhove                            Yves Kerstens
  Divisional CEO                                    Divisional CEO                                Divisional CEO                           Divisional CEO
Steel Wire Solutions                             Rubber Reinforcement                       Bridon-Bekaert Ropes Group                  Specialty Businesses
                                                                                                                                       Chief Operations Officer

                       Taoufiq Boussaid                                 Kerstin Artenberg                         Juan Carlos Alonso
                       Chief Financial Officer                           Chief HR Officer                          Chief Strategy Officer
                                                                                                                                                                  5
Bekaert Investor Presentation - September 2021
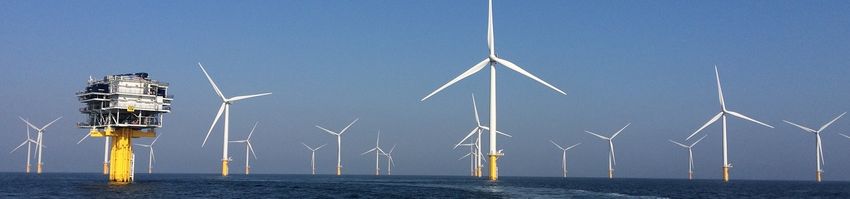
Technological leadership drives innovation

                                  € ~60 million       International R&D teams in     1 800 patents
                                  R&D annually        Belgium – China – India – UK   and patent rights

        LEADERSHIP APPROACH                                                   STRATEGIC PARTNERSHIPS
          Co-creation with customers and suppliers
          Internal and external ecosystem to power business engines
             • international team of technologists
             • cooperation with internationally renowned research centers &
               universities
             • venture capital and R&D partnerships
          Intellectual property protection
          Commitment to increase R&D investments significantly

Investor presentation - Bekaert                                                                          6
Bekaert Investor Presentation - September 2021
Preferred partner
For the most challenging projects and the most innovative solutions

     HAMPTON ROADS, BRIDGE &                           PROVENCE GRAND LARGE,                         SYNTHETIC DRAGLINE BHP,                           LTSA
       TUNNEL, VIRGINIA, US                                   FRANCE                                       AUSTRALIA                                   TRICO

        Dramix® steel fibers are a solution to            Steel and synthetic mooring lines              The largest landside crane in the world   50% of global wiper systems
        low-carbon concrete: 30-40% reduction in          anchor windmills in the largest floating       uses Bridon-Bekaert ropes that can lift   carry the Bekaert wiper blade
        CO2 footprint compared to traditional steel.      offshore wind farms.                           the heaviest construction modules.        solution.

        ST/UT tire cord products of Bekaert save          Queensferry Crossing in Scotland, the          Bekaert’s lifting solutions move          80µm is the diameter of a human
        1.5 billion kg of CO2 exhaust per year and        world’s longest three-tower, cablestayed       1 million elevators in the world.         hair – our field of play in thin
        our TAWI® coating excludes the need for           bridge, was built with Bekaert strands.                                                  metal fibers is 1µm to 50µm!
        cobalt in rubber compounds.
Investor presentation - Bekaert                                                                                                                                                    7
Bekaert Investor Presentation - September 2021
STRATEGY DISCUSSION

Investor presentation - Bekaert   8
Bekaert Investor Presentation - September 2021
Growth strategy
Drive sustainable, value creating growth

 Megatrends                    Focus on key markets                Leadership positions        Moving beyond the core

 •   New mobility              •   Mobility                        • Partner of choice         • Closer to the end
 •   Renewable energy          •   Construction & infrastructure   • Technology competences      customer
 •   Urbanization              •   Lifting & hoisting              • Global scale with         • Differentiating services
 •   Connected and Smart       •   Energy & utilities                Local presence              and solutions
 •   Reverse Globalization     •   Agriculture                     • Responsive supply chain   • Increase value added
                                                                                                 profit pool
 •   Sustainability            • Energy & utilities
 •   w mobility                • Agriculture
 • Renewable energy
 • Urbanization                                                                                                        9
Bekaert Investor Presentation - September 2021
Bekaert’s strategic imperatives

                       We PERFORM           We TRANSFORM              We GROW

                   Execute relentlessly    Continually optimize     Grow organically,
                    to generate strong         our business          with innovation
                         operating             portfolio and      driving sales growth,
                    performance while      innovate to meet our     and inorganically
                   maintaining financial     customers’ future      through selective
                         strength                 needs                    M&A

Investor presentation - Bekaert                                                           10
2021 H1 results
Strong sales – vigorous margin growth – strong balance sheet                                                                                                      We PERFORM   We TRANSFORM     We GROW

 Consolidated Sales                                     uEBIT%                                uROCE                                     Operating FCF                                           Net Debt

                         +30%                                   +7.2ppt                                  +19.2ppt                                         x2.5                                                  € -436m

                                                                                                                                                                                          2.6             2.5       0.7

   H1 2019     H1 2020     H1 2021            H1 2019    H1 2020     H1 2021            H1 2019    H1 2020     H1 2021               H1 2019    H1 2020     H1 2021                   H1 2019         H1 2020       H1 2021

     € 2 306 m                                     12.4%                                     26.9%                                     € 155 m                                          € 519 m
uEBIT% = Underlying EBIT% / uROCE is uEBIT relative to the weighted average capital employed / Operating FCF: Cash flows from operating activities - capex (net of disposals of fixed assets) post income taxes
Investor presentation - Bekaert                                                                                                                                                                                               11
Rubber Reinforcement
Market leading position with 30% share of global tire cord market; providing innovative solutions                                                                  We PERFORM   We TRANSFORM      We GROW

that help our customers sustainably transform the industry

    In mln €                                                                          % on sales                                                                                                        THROUGH OUR
                                                                                                             GROWTH DRIVERS                                LOCAL SERVICE                                GLOBAL FOOTPRINT
     160                                                                                 20%
                                                                                                                          tire rim size

     140
                                                                                         18%
                                                                                                                          mileage driven                                        13 816                      employees
                                                                             139
     120
                                                                                         16%                              innovation

                                                                                                                          sustainability
                                                                                                                                                                                22             manufacturing plants
                                                                                         14%
                                                              116
     100
                                                                                         12%
                                                                                                                          CAGR tire markets
                                                                                                                                                                                1.7            billion in combined revenue

                  94
      80                                                                                 10%
                                 78
      60
                                                                                         8%                                               RECENT DEVELOPMENTS
                                                                                         6%                  Organic sales growth of 42.8% in H1 2021 compared to H1 2020
      40
                                                                                                              due to volume rebound and positive mix
                                                                                         4%
      20                                        28                                                           uEBIT margin of 13.8% and uEBITDA margin of 18.4% in H1 2021
                                                                                         2%                   following efforts to lower the cost structure and improve the
                                                                                                              business mix. Positive impact from inventory valuation.
        -                                                                                0%
                H1/19          H2/19          H1/20          H2/20         H1/21                             Capex of € 12 million in H1 2021 mainly related to investments in
                                                                                                              EMEA and Asia
                 uEBIT              uEBIT margin                  uEBITDA margin

Investor presentation – Bekaert – employee numbers, manufacturing plants and combined revenue in the infographic are 2020 combined figures (including joint ventures)                                                        12
Steel Wire Solutions
Solidifying our diversified portfolio through business optimization, technology leadership and                                                                     We PERFORM   We TRANSFORM      We GROW

strategic partnering in growth areas

    In mln €                                                                          % on sales                                                                                                        THROUGH OUR
                                                                                                             GROWTH DRIVERS                                LOCAL SERVICE                                GLOBAL FOOTPRINT
     140                                                                                 18%
                                                                                                                          technology

     120
                                                                                         16%                              infrastructure spending
                                                                                                                                                                                8 317                       employees

     100
                                                                             116         14%                              5G data
                                                                                                                                                                                26             manufacturing plants
                                                                                                                          renewable energy
                                                                                         12%
                                                                                                                          downstream integration                                1.9             billion in combined revenue
      80                                                                                 10%                              GDP growth

      60                                                                                 8%
                                                                                                                                       RECENT DEVELOPMENTS
                                                               56                        6%
      40                                                                                                     Organic sales growth of 35.3% in H1 2021 compared to H1 2020 due
                                                40                                       4%                   to positive price mix and strong volume growth
      20          28                                                                                         uEBIT margin of 13.4% and uEBITDA margin of 15.9% in H1 2021 due
                                 23                                                      2%
                                                                                                              to high volumes, improved mix, cost control, pricing discipline and
                                                                                                              positive inventory valuation
        -                                                                                0%
                H1/19          H2/19          H1/20          H2/20         H1/21                             Capex of € 11 million in H1 2021, including investments in all regions
                 uEBIT              uEBIT margin                  uEBITDA margin

Investor presentation – Bekaert – employee numbers, manufacturing plants and combined revenue in the infographic are 2020 combined figures (including joint ventures)                                                         13
Specialty Businesses
Expanding our technology leadership position in growth markets and pushing the boundaries                                                             We PERFORM   We TRANSFORM      We GROW

of application opportunities; 40% global market share for concrete reinforcement fibers and thin metal fibers

    In mln €                                                                         % on sales                                                                                            THROUGH OUR
                                                                                                            GROWTH DRIVERS                         LOCAL SERVICE                           GLOBAL FOOTPRINT
     45                                                                                 25%
                                                                                                                         technology

     40                                                                                                                  infrastructure spending                   1 395                       employees
                                                                             40
     35
                                                                                        20%                              sustainability trends

                                                                                                                         lightweight solutions
                                                                                                                                                                   10             manufacturing plants

     30
                                                                                        15%
                                                                                                                                                                   389               million in revenue

     25                         27
                 25
                                               24
     20
                                                              21                        10%                                           RECENT DEVELOPMENTS
     15
                                                                                                            Organic sales growth of 24.1% in H1 2021 compared to H1 2020
     10                                                                                                      and above pre-pandemic levels
                                                                                        5%
                                                                                                            uEBIT margin of 17.3% and uEBITDA margin of 20.4% in H1
      5
                                                                                                             2021, far above previous reporting periods
       -                                                                                0%                  Capex of € 8 million in H1 2021 included investments in all sub-
               H1/19          H2/19          H1/20          H2/20          H1/21                             segments
                 uEBIT               uEBIT margin                  uEBITDA margin

Investor presentation – Bekaert – employee numbers, manufacturing plants and revenue in the infographic are FY2020 figures                                                                                    14
Bridon-Bekaert Ropes Group
The leading innovator and provider of the best performing ropes and advanced cords globally                                                             We PERFORM   We TRANSFORM      We GROW

    In mln €                                                                         % on sales                                                                                              THROUGH OUR
                                                                                                            GROWTH DRIVERS                           LOCAL SERVICE                           GLOBAL FOOTPRINT
     30                                                                                 20%
                                                                                                                    floating wind turbine projects
                                                                                        18%
                                                                                                                    oil & gas investments
                                                                                                                                                                     2 337                       employees
     25
                                               24
                                                                             23
                                                                                        16%                         Mining activity
                                                                                                                                                                     17             manufacturing plants
                                                                                        14%                         Infrastructure spending
     20
                                                                                        12%                         synthetic ropes applications
                                                                                                                                                                     424               million in revenue

     15                                                                                 10%

                                                                                        8%                                            RECENT DEVELOPMENTS
     10
                                                              10                        6%                  Organic sales growth of 4.5% in H1 2021 compared to H1 2020
                                                                                                             driven by higher volumes, particularly in Advanced Cords
                                                                                        4%
      5           6              6                                                                          uEBIT margin of 9.8% and uEBITDA margin of 16.5% in H1 2021,
                                                                                        2%                   slightly below H1 2020
       -                                                                                0%                  Closed plant in Pointe-Claire Canada, as all North American ropes
               H1/19          H2/19          H1/20          H2/20          H1/21                             activities have been consolidated in the US
                 uEBIT               uEBIT margin                  uEBITDA margin                           Capex of € 10.5 million in PP&E in H1 2021, mainly in the UK, US
                                                                                                             and in Advanced Cords Belgium
Investor presentation – Bekaert – employee numbers, manufacturing plants and revenue in the infographic are FY2020 figures                                                                                      15
Key elements of our business strategy
                                                                                        We PERFORM   We TRANSFORM   We GROW

       PORTFOLIO                  ORGANIZATIONAL
      MANAGEMENT                                       DIGITAL         INNOVATION                         SUSTAINABILITY
                                   CAPABILITIES

  • Invest for growth               • Leadership     • Operations   • Continuous                     • Clear commitment to:
                                                                      improvement
  • Scale-up                        • Performance    • Customer                                             − Environment
                                      management                    • Transform the core
  • Turnaround or divest                             • Process                                              − Social
                                    • Capability &                  • Grow beyond the
                                      competence     • Products       core                                  − Governance

Investor presentation - Bekaert                                                                                               16
We are actively managing our business portfolio
                                                                                                                                           We PERFORM   We TRANSFORM   We GROW

       ACTIVE PORTFOLIO MANAGEMENT                                              ACTION FOCUS                                               BUSINESS MIX

                           Strategic                              Invest for    Exit loss-making businesses without turnaround                     Sales                         EBITDA
                                                                                 potential
                           Scale-Up                                 Growth
                                                                                         diamond sawing wire
                                                                                         commodity activities of SWS

                                                                                Turn around SWS and BBRG through profit
   Market Attractiveness

                                                                                 restoration and footprint adjustments

                                                                                Cost savings and other structural improvements

                                                                                Grow small-sized businesses with high potential
                                                                                          fiber technologies
                                                                                          synthetic ropes

                                                                                Invest in core businesses with strong positions
                                                                                 and further growth potential
                                                                                          tire reinforcement (Vietnam, Russia, Brazil)
                           Turn-around or exit                                            building products (Czech Republic, India, CCL
                                                                                           partnership)
                                                                                          SWS and BBRG growth markets (wind energy,
                                       Bekaert’s Ability to Win                            utilities)
                                                                                          advanced cords (elevator, other industrial)        2020         2025E                 2020   2025E

Investor presentation - Bekaert                                                                                                                                                                 17
Thoughtful approach to accretive growth
                                                                                        We PERFORM   We TRANSFORM   We GROW

                    Develop innovative services     Move into services
                     that address mega trends.

                                                      Go downstream       Move beyond the core and closer to the end customer
                                                                          by providing differentiated services and solutions.

                                                    Develop adjacencies

                                                            v             Create opportunities in adjacent markets
                                                                          through strategic partnerships with recognized
       Active portfolio management to improve the                         market leaders.
        business mix and to meet the needs of our
                                       customers.   Reinforce the core

Investor presentation - Bekaert                                                                                               18
Our business focus is aligned with mega trends
                                                                                       We PERFORM   We TRANSFORM   We GROW

                                  NEW MOBILITY
                                  Light-weight, smart and green materials for tires

                                        URBANIZATION
                                        Advanced cords for vertical city requirements; smart glazing solutions
                                        with thin fiber technologies; low-carbon concrete reinforcement

                                          RENEWABLE ENERGY
                                          Light-weight mooring for offshore floating wind turbines; new fibers
                                          for hydrogen electrolysis

                                        CONNECTED & SMART
                                        5G & data transmission technology for fiber optic
                                        networks
                                  REVERSE GLOBALIZATION
                                  Agile and digital supply chain; regional footprint

Investor presentation - Bekaert                                                                                              19
Creativity is at the center of our strategy

                                                                                          DIGITALIZATION
                              INNOVATION                                                  Beyond digital working to
                                                                                          Data intelligence platforms
                              Beyond products to
                           New solutions & services

                       Beyond existing
                   areas of expertise to
                  Emerging subsegments
                                                            CREATIVITY
                                                           BEYOND STEEL
                                                      to shape the way we live and move             CULTURE
                                                                                                     Beyond us to
                                                                                                     A closer collaboration
                                                                                                     with innovative partners,
                                                                                                     together in one team

                                                                                          Beyond our
                                                                                          engineering mindset to
                    SUSTAINABILITY                                                        A new way of thinking:
                 Beyond better performance to                                             (end) customer centric
                    More sustainable outcomes

Investor presentation - Bekaert                                                                                                  20
Investing in innovative solutions
                                                                                  We PERFORM   We TRANSFORM   We GROW

         STRONG INVESTMENTS                            REBALANCING OUR PIPELINE
             TO INNOVATE                              WITH THREE BUSINESS ENGINES
                                                                             Focused and prioritized
                  €60M              Cost and process improvements
                                    World-class operations
                                                                        E0   Efficient - accelerate through digital and
                                                                             smart and remote serviced processes
                 T&I Investments
                                    Product and solution development         Driven by customer needs

                   +600             From incremental innovation
                                    towards offering elevation
                                                                        E1   More ambitious platforms
                                                                             Stronger portfolio governance
                        Experts                                              Incubation in ring-fenced
                                    Anticipation of major disruptions
                                    Develop smart products and               entrepreneurial teams
                                                                        E2
                +1 800              solutions
                                    Solutions for new growing markets
                                                                             External ecosystem collaboration and
                                                                             partnerships
                        Patents

                                    Investments

             +50%
             Increased investment
                                    2020       E0     E1        E2
                                                                                  +15%
                                                                                Sales from new solutions
               over next 5 years                                                         by 2025
                                    2025E     E0           E1    E2

Investor presentation - Bekaert                                                                                           21
Digitalization is employed across the organization
                                                                                              We PERFORM   We TRANSFORM   We GROW

                   CUSTOMER                          PRODUCT                  PROCESS                      OPERATION

          Customer Data-driven                   Smart        Accelerated     Enterprise      Intelligent End-to-End
          Experience pricing                    solutions        R&D             2.0          production Supply chain

          Engagement              Advanced      Data driven   Digital twins     Intelligent      Intelligent                        E-buying
                                   insights   business models                  automation        processes
        Feedback loops                                         Advanced
                         AI-enabled             Smart wires   testing and       E2E data      Digital ways of Digital S&OP
       Digital marketing forecasting            & sensoring    modelling      transparency       working      and forecasting

Investor presentation - Bekaert                                                                                                                22
Focused on delivering sustainable solutions
                                                   We PERFORM   We TRANSFORM   We GROW

    CUSTOMERS
                                               COMPETITIVE ADVANTAGE
    • Increasing requirements on suppliers
                                                                    • First mover advantage
    • Sustainable solutions outgrow others
                                                                  • Significant cost savings
    • End-industry disruptions
                                                            • Opportunity to differentiate

    PEOPLE & COMMUNITIES
                                              INVESTORS & REGULATORS
    • Increase top talent attraction and
      engagement                                                        • ESG target investing
    • Positive impact on our                                          • Lower financing costs
      local communities                             • Expectation for Science-based
                                                targets and towards net-zero policies

Investor presentation - Bekaert                                                              23
Committed to ambitious sustainability goals
2030 goals vs. 2019 baseline                                                                                 We PERFORM   We TRANSFORM   We GROW

                        ENVIRONMENTAL                              SOCIAL                                        GOVERNANCE

      Towards Carbon Neutrality                          Working conditions                         Highest Ethical Standards
                         Reduce GHG emissions in line                                               Ethics and Code of Conduct
     -45%                with Science Based Targets        0      Strive for zero accidents
                                                                                                    Strict compliance management
                         Aim for Carbon Net Zero by
                         2050
      Sustainable Solutions                              Diversity & Inclusion                      Fair sourcing + transparency
                         of our sales to be from
    ~65%                 sustainable solutions           40% Female  managers/
                                                             white collars                          100%              of strategic suppliers
                                                                                                                      EcoVadis listed
                                                         Positive working environment for all our                     of spend with suppliers who
                                                         employees                                  95%               sign off Code of Conduct

      Water                                              Community relations                        Best in class governance & reporting
                         relative freshwater intake in   Actively engage with communities on        Transparent and integrated reporting
     -15%                stressed regions                priority sustainability themes

Investor presentation - Bekaert                                                                                                                    24
Innovation in action
                                                                                                               We PERFORM   We TRANSFORM   We GROW

               DIGITALIZATION                                    NEW MOBILTY                                       CLEAN ENERGY

Together with VisionTek, BBRG developed the first     Bekaert invested in Cargo Sous Terrain and is   Bekaert participates in a consortium to develop
     mobile 3D rope measuring and visioning                 technology advisor on the Board             the next generation electrolysers for green
equipment to monitor, control, predict and optimize                                                                Hydrogen production
               the lifecycle of ropes

  Investor presentation - Bekaert                                                                                                                    25
Enabling new, sustainable solutions
                                                                            We PERFORM   We TRANSFORM   We GROW

    ENERGY AND UTILITIES

    Beyond current markets and
    solutions
                                  Digital Twin   Synthetic & hybrid    Strategic                               Bezinox®
                                    models           solutions        Partnerships                           cable armoring
    Enabling the
    future
Investor presentation - Bekaert                                                                                           26
Reducing environmental impact
                                                                                                      We PERFORM   We TRANSFORM   We GROW

                  Dramix® solutions reducing input intensity                         SigmaSlabTM, a new Dramix® solution
                                                                                 co-developed with post-tensioning leader CCL

                Heavy, labor-intensive     More efficient and easy to use
               traditional reinforcement   steel fiber reinforced concrete

            Construction Reinforcement                                       Typical transformation
            Low Carbon concrete                                              (SigmaSlabTM example)

            Reducing                                                         •     70% less steel reinforcement
                                                                             •     20% less concrete
            material                                                         •     30-40% reduction in CO2 footprint
            intensity
Investor presentation - Bekaert                                                                                                             27
Better together
With our customers, employees, shareholders and communities

      We make our                         We are truly                      We commit to                       We care for
   customers succeed                     better together                  high performance                 the world around us

  Customer centricity is at the     The true strength of Bekaert lies   Our commitment to high            We develop solutions that
  heart of everything we do.        at the heart of every employee’s    performance benefits all our      contribute to a clean environment
                                    passion to go the extra mile for    stakeholders, including our       and raise our efforts to become a
  Our aim is to be our customer’s
                                    our customers.                      shareholders.                     truly sustainable business.
  partner of choice by offering
  differentiated solutions and      Our values are ingrained in our     We want to create value for our   We support initiatives that help
  services, and by driving          culture and connect us all as       stakeholders by delivering on     improve the social conditions in the
  sustainable innovations.          One Bekaert team.                   our high ambitions.               communities where we are active.

Investor presentation - Bekaert                                                                                                               28
Financial Outlook

Investor presentation - Bekaert   29
Sales growth driven by strategic focus

STRATEGIC FOCUS                   consolidated sales in billions of euro

• market positioning
• mix improvements
• pricing discipline
• customer success
• operational excellence

Investor presentation - Bekaert                                            30
Increased profit from sales growth and stronger business model

SALES GROWTH                      underlying EBIT in millions of euro and as a % on sales

• in the right markets
• with higher-end solutions
• with successful customers
• at the right price

BUSINESS MODEL
• Improved footprint
• structural savings
• high degree of resilience
• capital allocation strategy

Investor presentation - Bekaert                                                             31
Cash flow generation is at the center of our strategy

WORKING CAPITAL                                                          CAPITAL ALLOCATION
• Decreased by 40% in 2 years (YE 2020 vs YE 2018)                       • ROCE improved by +50% in 2 years (FY 2020 vs FY 2018)
• Average working capital on sales decreased                             • H1 2021: very high ROCE of 27%
  from 20% (FY 2018) to 13% (H1 2021)
                                                                         • Objective is to reach a ROCE greater than 20%
• Objective is to maintain a level of 15-16%                               through the cycle

    Working capital in millions of euro and as a % on sales               % underlying ROCE

                                                              mid-term         2018     2019   2020   through the cycle

Investor presentation - Bekaert                                                                                                    32
Solid cash generation from higher profitability

SOLID CASH GENERATION                                                     OCF in millions of euro

• Objectives:

    − step up OCF (1)
    − FCF yield (2) of ~100%

• Funding opportunities to grow:
    − organic and inorganic
    − investments in innovation,
      sustainability, digital
    − dividend

(1) OCF = uEBITDA + delta working capital – capex. Pre-income taxes (2) FCF yield = FCF / net result

Investor presentation - Bekaert                                                                        33
Continuous focus on maintaining conservative balance sheet

              net debt on
              uEBITDA

Investor presentation - Bekaert                              34
Liquidity position is strong and debt maturities are balanced

Investor presentation - Bekaert                                 35
Focused on shareholder returns through dividend policy

                      250                                                                                                                                       80%

                      200
                                                                                                                                                                60%

                      150

                                                                                                                                                                      Pay-out ratio
                                                                                                                                                      45%
   In millions of €

                                                                                                                                                      40%       40%
                      100

                                                                                                                                                                20%
                       50

                        0                                                                                                                                       0%
                            2011           2013            2014        2015          2016          2017               2018           2019           2020

                              Result Attributable to the Group    Dividend pay-out    Pay-out policy over the years          Average pay-out % over the years

                            At the Annual General Meeting of Shareholders in May 2021, a gross dividend of € 1.00 was
                            approved, in line with the company’s pay-out policy.

Investor presentation - Bekaert                                                                                                                                                       36
Value creation in our financial projections 2021-2026

                                            Consolidated                           uEBIT                            FCF                           Net debt
                                               sales                               margin                           yield                         leverage

Restated mid-term targets                  3%+ CAGR                               9%-11%                          ~100%                            < 1.5
       (2022-2026)                               organic                      through the cycle               FCF/net result                net debt/uEBITDA

  Restated short-term                       € ~4.6 bln                              10%+                                                           < 1.0
    guidance (2021)

 Changes versus previous guidance:
 Mid-term underlying EBIT margin target: from 8-10% to 9-11%
 FY 2021 outlook: consolidated sales from ≥ € 4.4 billion to € ~4.6 billion – underlying EBIT margin from ≥ 8% (≥ 80bps above FY 2020 level of 7.2%) to 10% or better.

                                                                                                                                                                         37
Conclusion

Investor presentation - Bekaert   38
Why invest in Bekaert

                                  PERFORMANCE-DRIVEN MARKET LEADER
                                   • Delivering on priorities and focused on higher value opportunities
                                   • Global scale, partnerships and intellectual property to protect and enhance position in key end
                                     markets

                                  FOCUSED EXECUTION OF STRATEGIC PLAN
                                   • Strong track record of consistently improving business portfolio
                                   • Capabilities and ability to execute on investments in innovation, digitalization and sustainability

                                  DELIVERING GROWTH THROUGH INNOVATION
                                   • Clear capital allocation strategy to maximize return on investment
                                   • Unlocking growth potential through R&D and focus on creative new applications
                                   • Focused on creating value for all stakeholders, including our shareholders

Investor presentation - Bekaert                                                                                                            39
Save the date

                       Third quarter trading update 2021                                               19 November 2021

                       Full year results 2021                                                           25 February 2022

                       Integrated report 2021                                                             22 March 2022

                       Capital Markets Day - See the content or watch the replay of the of 28 May 2021 on Our performance

                       Bekaert Investment Case – IR presentations – Let’s Meet

                       Recent publications: H1 2021 Results - Annual Report - Sustainability Report

Investor presentation - Bekaert                                                                                             40
Contact

     Investor Relations:
                                   Katelijn Bohez                                                                            Dries Van Hamme
                                   katelijn.bohez@bekaert.com                                                                dries.vanhamme@bekaert.com

      Documentation:
                                   Christine Clarysse

                                   Christine.clarysse@bekaert.com

    Shareholders, investors and other interested parties wishing to receive the Group's annual report, the shareholders guide, the annual
     accounts of NV Bekaert SA or other information published by the Group may contact the Investor Relations department at any time.

  This presentation may contain forward-looking statements. Such statements reflect the current views of management regarding future events, and involve known and unknown risks,
  uncertainties and other factors that may cause actual results to be materially different from any future results, performance or achievements expressed or implied by such forward-looking
  statements. Bekaert is providing the information in this brochure as of its date and does not undertake any obligation to update any forward-looking statements contained in this brochure in
  light of new information, future events or otherwise. Bekaert disclaims any liability for statements made or published by third parties and does not undertake any obligation to correct inaccurate
  data, information, conclusions or opinions published by third parties in relation to this or any other publication issued by Bekaert.

Investor presentation - Bekaert                                                                                                                                                                         41
H1 2021 Financial Supplement

Investor presentation - Bekaert   42
Our business context in Q2 2021
Macro-economic developments

                                  • Significant surge of demand

                                  • Global supply chain interruptions

                                  • Commodity price increases

                                  • Reverse globalization trend

                                  • Continued uncertainties about Covid-19

Investor presentation - Bekaert                                              43
Our business context in Q2 2021
Demand developments for Bekaert

                                  • Very strong tire markets in EMEA and India and pick-up in North America
                                  • Tailing off demand in China at the end of Q2
                                  • Demand from automotive OEM not yet to pre-Covid levels due to global chip shortage

                                  • Strong demand from construction markets in Latin America throughout H1
                                  • Progressive demand improvement in the rest of the world and solid demand for elevator solutions
                                  • Stimulus programs and de-globalization trends have been beneficial

                                  • Strong demand in energy & utility markets
                                  • Positive evolutions for flexible pipe armoring and offshore wind applications
                                  • Robust demand for overhead power cable solutions

                                  • Solid demand from agriculture, fishing & marine, and mining markets
                                  • Increased demand for hose reinforcement and filtration solutions
                                  • Growing interest for digital solutions

Investor presentation - Bekaert                                                                                                       44
Focus and priorities in H1 2021

Actions geared towards three main areas                                       Further development and deployment of
                                                                              our strategic transformation
o        Capture the growth from volume recovery to pre-Covid-19 levels       Strategy validation and start of implementation:
            ̵   global demand rebound
              ̵ customer-centric and go-to-market strategy & focus
                                                                                                 Innovation
          ̵     supply chain excellence: delivery continuity

o        Structural improvement of the overall Bekaert performance
          ̵       Product and business mix improvements
            ̵     Pricing discipline aligned with raw material price trends
              ̵   Acceleration of commercial and operational excellence
                ̵ Continued effective working capital and cost control

o        Seizing the opportunities from temporary tailwinds
          ̵   Positive inventory valuation impact from raw material prices
            ̵ Excluding this impact, uEBIT margin reached ~10%                Sustainability                        Digital

Investor presentation - Bekaert                                                                                             45
2021 H1 results
Strong sales – vigorous margin growth – strong balance sheet

 Consolidated Sales                                     uEBIT%                                uROCE                                     Operating FCF                                    Net Debt

                         +30%                                   +7.2ppt                                  +19.2ppt                                         x2.5                                     € -436m

                                                                                                                                                                                   2.6       2.5       0.7

   H1 2019     H1 2020     H1 2021            H1 2019    H1 2020     H1 2021            H1 2019    H1 2020     H1 2021               H1 2019    H1 2020     H1 2021             H1 2019    H1 2020     H1 2021

   € 2 306 m                                         12.4%                                   26.9%                                    € 155 m                                       € 519 m
uEBIT% = Underlying EBIT% / uROCE is uEBIT relative to the weighted average capital employed / Operating FCF: Cash flows from operating activities - capex (net of disposals of fixed assets) post income taxes

Investor presentation - Bekaert                                                                                                                                                                                   46
2021 H1 Sales
  In millions of €

  Consolidated sales                                                      H1 2020                   H1 2021                Variance               Organic            FX
  Rubber Reinforcement                                                            709                      991                  +40%               +43%              -3%
  Steel Wire Solutions                                                            639                      849                  +33%               +35%              -3%
  Specialty Businesses                                                            185                      227                  +23%               +24%              -1%
  BBRG                                                                            229                      236                    +3%               +5%              -1%
  Group                                                                               9                        3                         -               -             -
  Total consolidated sales                                                     1 770                    2 306                   +30%               +33%              -2%

  Total combined sales                                                         2 065                    2 782                   +35%               +39%              -5%

                            Consolidated sales                                                                                          Combined sales

    Rubber Reinforcement                                         43%                                        Rubber Reinforcement                             39%
       Steel Wire Solutions                                 37%                                                Steel Wire Solutions                            45%
      Specialty Businesses           10%                                                                      Specialty Businesses           8%
                        BBRG         10%                                                                                        BBRG         8%
Combined sales are sales of consolidated companies plus 100% of sales of joint ventures and associates after intercompany elimination

Investor presentation - Bekaert                                                                                                                                            47
Consolidated income statement: key figures

 In millions of €                                  Underlying                    Reported
                                               H1 2020          H1 2021    H1 2020        H1 2021

 Sales                                            1 770           2 306         1 770          2 306

 Cost of sales                                  (1 518)          (1 833)      (1 521)        (1 847)
 Gross profit                                      252              473          249            459
       Selling expenses                            (81)             (88)         (81)           (87)
       Administrative expenses                     (59)             (78)         (60)           (76)

       R&D expenses                                (25)             (29)         (26)           (29)
       Other operating revenue and expenses          4                9               4             21
 EBIT                                               92              285              87         288

  Overheads increase in absolute numbers but decrease as a % on sales: -80bps to 8.5%

Investor presentation - Bekaert                                                                          48
EBIT-Underlying bridge: Consolidated view

In millions of €

   300
                                                                                      16
   280
                                                                                                  (13)
   260
                                                                       61
   240
   220
   200
                                                             65
   180
                                                                                                                285
   160
   140
   120                                            65

   100
     80                 92            0
     60
              EBIT-Underlying     FX effects   Inventory   Volume   Price-Mix   Structural cost   Other   EBIT-Underlying
                  H1 2020                      Valuation                        improvement                   H1 2021
                                                                                    actions

Investor presentation - Bekaert                                                                                             49
Rubber Reinforcement

                   SALES                        uEBIT               H1|H2 MARGINS                       Joint Venture Brazil
                                                                                                          € 81 mln sales
                                                                                        18.3%   18.4%         +58%
                                                                15.3%
                                                                        14.4%
                                                                                11.1%
                                                                                               13.8%          CAPEX
                                   991                                                     12.6%
                                                         139                                                 € 12 mln
            709                                                 9.1%
                                                                        8.2%

                                           28                                   3.9%
                                                                                                             uROCE
          H1|20                   H1|21   H1|20         H1|21   H1|19 H2|19 H1|20 H2|20 H1|21

                                                                        uEBIT%           uEBITDA%            24.6%

Investor presentation - Bekaert                                                                                                50
Steel Wire Solutions

                   SALES                        uEBIT               H1|H2 MARGINS                     Joint Venture Brazil
                                                                                                       € 397 mln sales
                                                                                                            +57%
                                                                                              15.9%

                                                                                      11.6%
                                                                              10.2%           13.4%
                                   849                                                                      CAPEX
            639                                                 7.1%   7.1%                                € 11 mln
                                                         116
                                                                                      8.0%
                                                                              6.0%
                                           40
                                                                3.5%   3.2%
                                                                                                           uROCE
          H1|20                   H1|21   H1|20         H1|21   H1|19 H2|19 H1|20 H2|20 H1|21

                                                                       uEBIT%         uEBITDA%             43.2%

Investor presentation - Bekaert                                                                                              51
Specialty Businesses

                   SALES                        uEBIT               H1|H2 MARGINS

                                                                                                    CAPEX

                                                                                            20.4%
                                                                                                    € 8 mln
                                                                            16.6%
                                                                15.7% 15.8%
                                                                                    14.6%
                                   227
                                                                                            17.3%
            185                                          40                 12.9%
                                                                12.0% 12.4%
                                                                                    10.1%
                                           24
                                                                                                    uROCE

          H1|20                   H1|21   H1|20         H1|21   H1|19 H2|19 H1|20 H2|20 H1|21       35.4%
                                                                      uEBIT%        uEBITDA%

Investor presentation - Bekaert                                                                               52
Bridon-Bekaert Ropes Group

                   SALES                        uEBIT               H1|H2 MARGINS

                                                                                                        CAPEX
                                                                                17.2%
                                                                                                16.5%   € 10 mln
                                                                                        12.7%

            229                    236                                 10.0%
                                                                8.0%
                                           24            23
                                                                                                9.8%
                                                                                10.3%

                                                                                        5.1%            uROCE
                                                                2.6%     2.3%
          H1|20                   H1|21   H1|20         H1|21   H1|19 H2|19 H1|20 H2|20 H1|21           10.9%
                                                                        uEBIT%          uEBITDA%

Investor presentation - Bekaert                                                                                    53
Consolidated income statement: key figures
                                                                                                                                        ETR1
 In millions of €                                                         H1 2020                  H1 2021
                                                                                                                                53%
 EBIT                                                                                  87                     288
                                                                                                                                                26%

 Interest income / expense                                                           (28)                     (23)
                                                                                                                                H1|20           H1|21
 Other financial income and expenses                                                 (15)                         4
                                                                                                                                  Share in JVs2
 Result before taxes                                                                   44                     268
                                                                                                                                                    34

 Income taxes                                                                        (23)                     (71)
                                                                                                                                 13

 Result after taxes (consolidated companies)                                           21                     197
 Share in the results of joint ventures and                                                                                     H1|20           H1|21
                                                                                       13                       34
 associates
                                                                                                                                      Net result3
 Result for the period                                                                 34                     231
                                                                                                                                                    208

 Attributable to non-controlling interests                                                                      23
                                                                                                                                 33

 Attributable to equity holders of Bekaert                                             33                     208               H1|20           H1|21

(1) Effective tax rate / (2) Share in the results of JVs / (3) Result of the period attributable to equity holders of Bekaert
Investor presentation - Bekaert                                                                                                                           54
Working capital: key figures

               In millions of €                      WORKING CAPITAL                     H1|20      YE|20         H1|21

                   1000                       896
                                  757                         758                            720
                                        683                                                                 667
                                                    626 660
                                                                                                     535
                     500
                                                                                                                                13%
                        0
                                                                                                                          Working capital
                                                                                                                                on sales
                    -500

                                                                    -663
                                                                           -809
                  -1000
                                                                                  -987

                  -1500
                                    inventories       accounts             accounts                  total
                                                      receivable           payable               working capital

Investor presentation - Bekaert                                                                                                         55
Key figures per share

                                     H1 2020      H1 2021
 Share price                              17.45        37.58
 Number of existing shares           60 408 441   60 414 841
 Book value                               22.61        28.23
                                                               x6
 Earnings per share (EPS)                  0.59         3.66   EPS
 Weighted average number of shares   56 543 997   56 813 437

Investor presentation - Bekaert                                  56
Business units with multiple growth drivers
Consolidated sales by business unit (FY 2020)

  Rubber Reinforcement (RR)                     Steel Wire Solutions (SWS)            Specialty Businesses (SB)                  Bridon-Bekaert Ropes
                                                                                                                                     Group (BBRG)
     Tire cord, bead wire, hose                    Steel wire products and                 Building products, fiber               Ropes and advanced
      reinforcement wire and                     solutions serving industrial,            technologies, combustion                 cords businesses
            conveyor belt                        agricultural, consumer and                     technologies
           reinforcement                            construction markets

                      5%                                      6%                                      2%                                11%
                                                        7%                                       9%
                                                                        28%                                                                          29%
                                                                                            8%                                   14%
                                                  10%
                                                                                          6%
                  €1.6Bn                                     €1.3Bn                              €0.4Bn                                  €0.4Bn
                                                  14%
                                                                                                                  75%             18%
                                                                       20%                                                                          28%
                              95%                        15%

                                                                        6%
                                                                       31%
                                                                       11%
                                                                       14%
                                                                       16%
          Construction            Agriculture   Consumer Goods        Tire & Automotive      Energy & Utilities     Basic Materials     Equipment    Other

Investor presentation - Bekaert                                                                                                                              57
You can also read