Roadshow & Conference Presentation - June 2019 - Investor Relations
←
→
Page content transcription
If your browser does not render page correctly, please read the page content below
Roadshow & Conference
Presentation
June 2019
Agenda Highlights Technology Overview Business Overview Financials Appendix – Financials
Highlights from FY 2018
                                                                                                                8.4 %
                                                                                                                                                            as of   (bandwidth) as of
                                                                                                                                                    13 Mar. 2018        21 Aug. 2018
                                                           7.0 %

                                                                                          EBIT margin FY 2018
                                                                   EBIT margin forecast
Revenue Forecast FY 2018

Revenues Voltabox Group FY 2018

                                                                                                                                                                    € 66.9m
  Continued top line growth +145%
                                                 EBIT margin better                                                     than expected and including burden
                                                                                                                of new Triathlon contract at 8.4%
                   Equity ratio decreases to 85,3%
                                                                                                                                               Liquid funds at € 28.2m
     Main drivers in FY18:          and                                                                          Slightly higher CAPEX: € 13.6m

                                            Forecast for 2019: Revenues of € 105-115m, EBIT margin between 8-9%

June 2019                                            Roadshow & Conference Presentation                                                                                            3
Voltabox Corporate Development
+ EV-Buses + stationary
2019e: € 105 – 115m Revenue,
2019 ff. + Start Intralogistics in-house development energy storages
+ Gardening & Cleaning 8-9 % EBIT margin
+ Entry into Intralogistics US market + Rail & Port + OEMs > ~ 300 FTE
+ Acquisitions of Concurrent Design & E-Bikes / € 66,9m Revenue,
2018 ACCURATE (Branch: Korntal-Münchingen) 8,4 % EBIT margin
+ Start of Intralogistics direct sales Pedelecs 235 FTE
Change of legal form to AG & IPO Agriculture & € 27,3m Revenue,
2017 Construction -10,3 % EBIT margin
+ Branch Aachen
99 FTE
€ 14,5m Revenue,
2016 Mining -25,4 % EBIT margin
67 FTE
Material Handling € 7,4m Revenue
2015 -31,6 % EBIT margin
(Intralogistics) Motorcycles
62 FTE
2014 Foundation Voltabox Deutschland GmbH € 4,6m Revenue
+ Branch Austin (TX, USA) Trolleybuses -9,7 % EBIT-Marge
41 FTE
Strategic Milestones Market Development Results
June 2019 Roadshow & Conference Presentation 4
Location Overview                                                                                                     AG              R&D Center Voltaforce (under construction)

                                                   R&D Center Voltamotion                                                            600 square feet

With 277 FTE*, technology
hubs and state-of-the-art
production facilities,
Voltabox is well positioned to
                                                790 square feet
grow its business on a global
scale.                                                                                                                                                              Markgröningen
                                                                  Aachen
                                                                               2,700 square feet

                                                                                                           Delbrück                                               Kunshan Co., Ltd.
of North America, Inc.         of Texas, Inc.

                                                                                                                                                         3,400 square feet
2,294 square feet
                                                                                                                                                                        Kunshan (China)
                                                                       81 FTE in Research & Development (29%)
                    Austin, TX (USA)
                                                                  Administration     Production    Research & Development   * Full time equivalents (FTE) incl. 42 temporary employees, as of 31 Dec. 2018.
                                                                                                                                                                              ** In the course of formation.

June 2019                                                                Roadshow & Conference Presentation                                                                                                    5
Product segments                                                               16 FTE

               Voltapower – Voltamotion – Voltaforce

                           DC-DC                        Onboard
                          converter                     charger

                                       Battery system
                          Master                  Slave BMS
                           BMS
            Auxiliary                                               Electric
                                                  Slave BMS
            batteries                                              machines
                         Electronics
                                                  Slave BMS
                                                        …
                                                        Inverter

June 2019                 Roadshow & Conference Presentation                            6
Key Developments in Product Segments in FY2018
                                                                                                                                   Revenues in 2018:

                                                                                                                                    € 63.3m

                                                                                               EBIT margin FY 2018
            Rearrangement of Triathlon cooperation
            already proving to be absolutely right                                                                                                                            Prototypes delivered and transfer to
                                                     New order from Dayton // Development
                                                                                                                                                                              series production
                                                     of standard battery container completed

                                                                                                                     Battery Hauler in series production //
                                                                                                                     Basis set for acceleration of projects
                                                                     Revenues in 2018:
                                                                         € 2.3m                                                                                       Revenues in 2018:
                                                                                                                                                                          € 3.1m

                                                                                                                                         Sales through development services for
                                          First revenue contribution from                                                                various reference projects
                                          ACCURATE - very good market prospects
June 2019                                                               Roadshow & Conference Presentation                                                                                                           7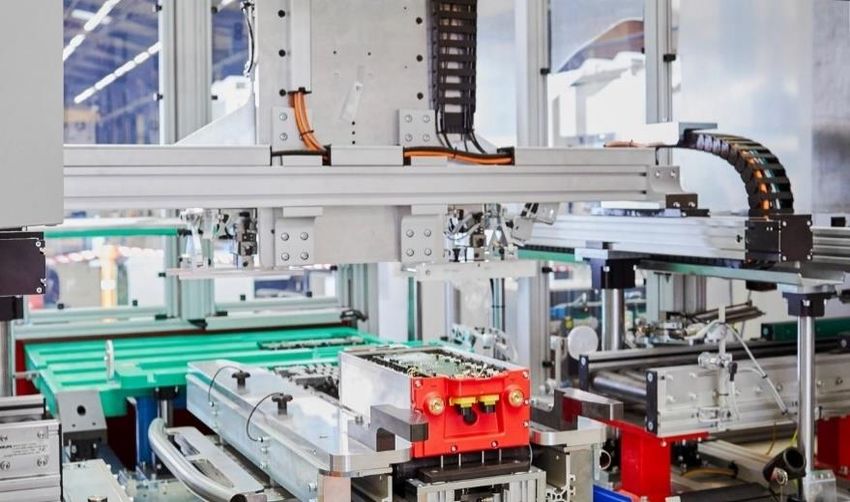
Agenda Highlights Technology Overview Business Overview Financials Appendix – Financials
E-Mobility Pure Play
E-Mobility Value Chain
Robust housing with
integrated fixing points
Recycling Master ECU
Module cases with
integrated Data interfaces
• Cooling Devices Electric Vehicles Power switchers
• BMS Slave Circuit DC/DC converters
Board
Drivetrain components Compensators
• Sensors
Power Electronics Fuses / Resistors
• Wiring Loom
Climate systems
• Lids (Chargers, cable
Battery Systems
• Sealings rewinds)
BMS & Assembly
• Rupture Discs
in various low and high
The Sweet Spot of Cylindrical cells
voltage versions Battery Modules
Packaging Prismatic cells
Electromobility
Pouch cells
Separator
Battery Cells in various Li-Ion
Anode Cell-agnostic approach
chemistries
Cathode
• LFP
Electrolyte
Cell Housing Raw and Processed Materials • NMC
Insulation Strips • LTO
• NCA
June 2019 Roadshow & Conference Presentation 9
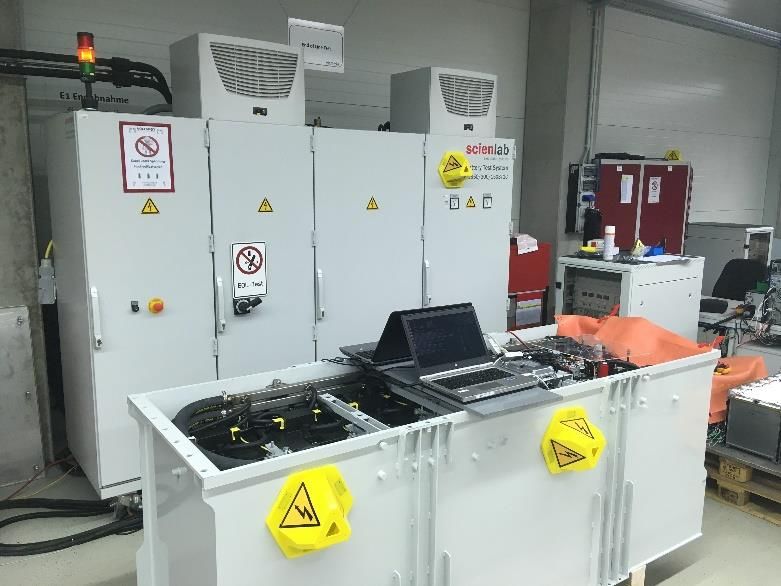
Production Steps - From the Cell to the Complete System
   Procurement of cells and    Packaging of the cells according                             Connecting the cells, adding of
   preparation of production   to the module characteristics                                BMS and further components

                                                In case of large battery systems e.g. for                          Assembling of produced
                                                mining applications: Comprehensive                                 modules to systems
                                                End-of-Line Tests

June 2019                                Roadshow & Conference Presentation                                                                 10
TCO-Advantages Driving Substitution of Lead-Acid by Li-Ion
Li-Ion Technology Lead-Acidtechnology
Lead-Acid Technology
Up to 240 Wh/kg Energy density 40 Wh/kg
Up to 95% Charging efficiency Up to 70%
Additional advantages:
No memory effect Up to 30,000 cycles
Cycle life 1,200
at 80% DOD
(opportunity charging)
Very low self-discharge
No maintenance Up to 80% in 6 min
Fast charging 50% in 3 hrs.
Full functionality at low (10C)
temperatures
Optimum control and Gassing &
Zero emissions Emissions
(remote) monitoring water loss
June 2019 Roadshow & Conference Presentation 11Cell Expertise in the Group
Dr. Fabian Wohde
Cell Expert at Voltabox
“ On paper, lithium-ion technology has been convincing
right from the start. However, after we have installed
numerous Li-Ion-based systems in the market over the
past few months, the strengths of the cell chemistries we
Cell Supplier Base use are also evident in practice. Lithium-ion battery
systems impress with their flexibility, high charging rates,
long service life and massive advantages in terms of total
cost of ownership".
June 2019 Roadshow & Conference Presentation
” 12Voltabox is Cell Agnostic!
Cylindrical Prismatic Pouch
Cell Types
A prismatic design indicate a flat battery Rather than rigid metallic casing, conductive
A spirally wound design (jelly-roll). design. The stacks can be wound (as shown foil-tabs are welded to the electrodes and
Designated by size, e.g. 26650 cylindrical in the photo) or stacked (with alternating seal the battery fully. The tacks inside can be
battery (Diameter: 26mm, length: 65.2 mm; cathode/separator/anode structure). The wound or stacked. Swelling and gassing
code for cylindrical shape: 0) stacks are usually inserted into rigid casing to could be a concern for pouch cells
form prismatic
Lithium Iron Phosphate (LFP) Nickel Manganese Cobalt (NMC) Lithium Titanium Oxide (LTO) Nickel Cobalt Aluminum Oxide (NCA)
Nominal cell voltage: 3.2 V to 3.3 V Nominal cell voltage: 3.6 V to 3.7 V Nominal cell voltage: 2.3 V Nominal cell voltage: 3.6 - 3.7 V
Cell Chemistries
No risk of thermal runaway (in High cycle stability of at least Highest cycle stability of up to (vs. graphite)
case of an accident) 6,000 cycles at 80% DoD 30,000 cycles at 80% DoD Very wide operating temperature
High cycle stability of up to 4,000 Great operating temperature High level of safety thanks to LTO range of -20 /+75°C
cycles at 80% DoD range of -30/+ 60 °C anode High cycle stability of up to 1,500
Large operating temperature range High energy density (136 - 230 Great operating temperature cycles at 80-70% DoD
-20/+ 55 °c Wh/kg and at least 309 Wh/l) range of -30/+ 55 °C High energy density (140 - 280
High energy density (125 Wh/kg Energy density of 96 Wh/kg or 202 Wh/kg and 300 - 590 Wh/L)
and 292 Wh/l) Wh/l Currently being tested or upscaled
Using only a small portion of rare Great SoC range useable with the by many cell manufacturers
earths highest performances
Source: IDTechEx.
June 2019 Roadshow & Conference Presentation 13Li-Ion Battery System Supplier for Defying Applications
Voltabox is a pioneer in the
Robust Housing
electrification of industrial applications.
In 2018, the Group expanded its Data-Interfaces
solution portfolio in order to open up
further mass markets in the future. Climate System
Mindset focus on applications
(authentic added value solutions) Master ECU / BMS
Exceptional integration power
(experience in automotive interfaces)
Superior realization processes Compensators / DC/DC Converters
Insulators
(short time-to-market with modular kit) Power-Switches
June 2019 Roadshow & Conference Presentation 14Characteristics of selected battery systems
systems modules Current System for Seattle order systems Battery system for yard loader
33 x 3x8 LFP module in 33s1p 5 x 48V module in 5s1p
Public >> 435.6 V nominal, 26.1 kWh Agriculture >> 252V nominal, 6.7 kWh
transport [System with electrical room and HV system] vehicles [A system can consist of either one or two battery troughs,
buses so a maximum of 13.4 kWh at 252V nominal is possible]
More than 1.000 form factors
Various battery systems with 24V, Starter battery for Motorsport applications
Forklifts Motorsport (10 Ah)
48V and 80V and preferred NMC
cell technology 40 x 3,3V LFP round cells in 4s10p
>> 13,2V nominal, 330 Wh
Extender
Starter battery for high-performance
8 x 24V NMC module in 4s2p
AGVs Motorcycles motorcycles (10 Ah)
>> 100.8 V nominal, 10.6 kWh
16 x 3,3V LFP round cells in 4s4p
>> 13,2V nominal, 132 Wh
Mining Mass Battery system for Fazua Pedelec drive
BH 18/20 Battery system
vehicles Markets system
108 x 4x9 LFP module in 18s6p
20 x 3,6V NCA round cells in 10s2p
>> 237.6 V
>> 36V nominal, 252 Wh
nominal, 156.7 kWh
[System in two separate housings with one
additional, separate electronics housing]
June 2019 Roadshow & Conference Presentation 15Agenda Highlights Technology Overview Business Overview Financials Appendix – Financials
Market Dynamics
Global battery market value in USD bn.
Overall usage of batteries will increase 12
CAGR
due to E-mobility mega trend 27%
Ongoing substitution of lead acid 11,0
10
batteries resp. diesel generators by
lithium-ion batteries in occupied 9,5
submarkets 8
12% global market growth expected 7,8 Li-Ion
for battery systems in current Voltabox 6
> 50%
end markets in 2019
5,5
Intralogistics submarket expected to CAGR
4
show fastest adoption of Li-Ion 4,3 7%
Source: IdTechEx (2017)
technology due to TCO advantages
2,7 2,9 3,0
Market penetration of Li-Ion expected 2 2,5
2,3
to exceed 50% of new sales by 2023 in
intralogistics
0
2019 2020 2021 2022 2023
Intralogistics (Lead-Acid and Li-Ion) Other VBX end markets*
* HEV/PHEV Buses over 5 meters, mining vehicles, agriculture & construction, motorcycles, pedelecs/e-bikes.
June 2019 Roadshow & Conference Presentation 17Intralogistics: New Sales Strategy for the booming market
“ The intralogistics market is preparing itself for the future right now. This led us to the
conclusion, that Voltabox has to act proactively in order to take on a pioneering role in
terms of electrifying the intralogistics market. In 2019, our strategy for worldwide Dr. Patrick Ries
Head of Sales Voltapower
sales in this market will be implemented clearly visible.
”
Germany &
Europe North America
1. 2. 3. 4.
Voltabox Voltabox
JT Energy Direct sales Direct sales
What? Mass-produced modules for What? Completely in-house produced and What? Voltabox (replacement) battery What? Tailor-made Voltabox battery
Triathlon & Jungheinrich systems technologically leading Voltabox systems systems for the North American market
How? Call-offs according to sales (Replacement) battery systems How? Order via integrated on-demand How? Direct sales via own Voltabox
agreements How? Direct sales via own Voltabox sales option for Voltabox systems in the sales team
To whom? Small and medium-sized team ForkOn platform To whom? OEMs and large fleet
fleet operators & Jungheinrich To whom? OEMs and large fleet To whom? all customers of the ForkOn operators
operators fleet management software
June 2019 Roadshow & Conference Presentation 18Intralogistics: Notes on the business with Triathlon
Deutsche Bundesbank on 21 Nov. 2018: Granting of „Investment Grade“ for Triathlon
Extension of payment terms in H2/2018 has ended at 31 Dec. 2018
Current payment terms: mainly 30 days net
Triathlon pays on time (Q4/18: € 5.7m paid prematurely due to forward-looking cash planning)
Triathlon‘s share of Voltabox‘ sales in 2018 remained on previous year‘s level
In 2019e: share reduction by 2/3!
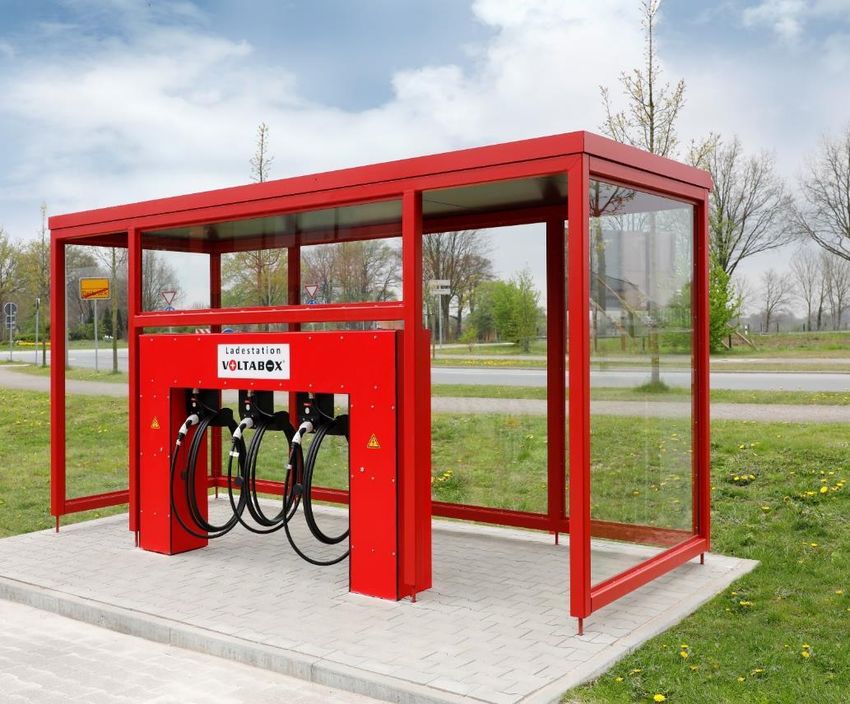
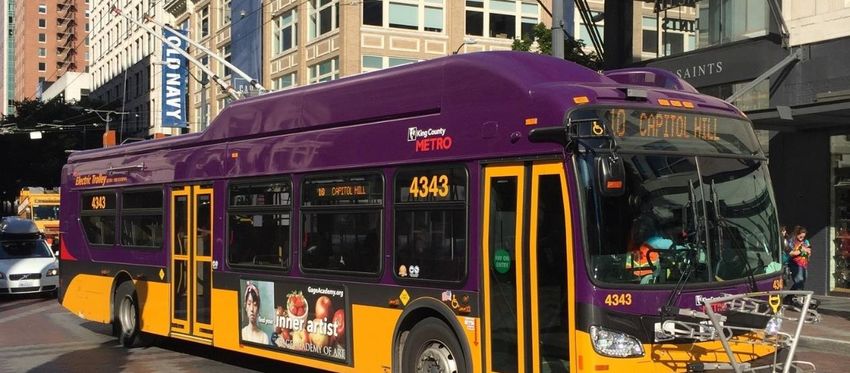
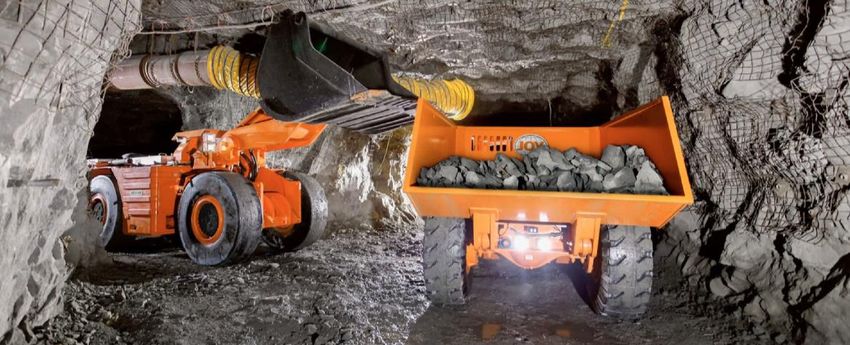
June 2019 Roadshow & Conference Presentation 19Voltabox of Texas: It’s all about Seizing Opportunities
Image sources: Komatsu Mining, Kijng County Metro
Mining
June 2019 Roadshow & Conference Presentation 20Mass Markets: ACCURATE as a key
Appealing design possible –
no longer large bricks at the
seat post
Fully merged into the Group in Q2/2018 (The brand Protection against
dust and filth
ACCURATE disappears)
Highly profitable business and production – Market for
Pedelecs/E-Bikes evolves rapidly
Powertrain completely
electrified, incl. BMS Protection against
and charging theft
equipment
System approach supports entering further mass
markets like Gardening or Medical Devices in near future
Battery Market Value Pedelecs/E-Bikes
In USD bn. (Lead Acid & Li-Ion)*
3
The business is expected to generate significant
2
revenues in FY 2019
1
2018 2026
* Source: IDTechEx.
June 2019 Roadshow & Conference Presentation 21Mining: Updated Roadmap* for the Komatsu projects
2019 2020 2021 2022
Battery Hauler (BH)
BH 18/20 Project Atlas Current series production
BH 18/20 (MSHA**) Project Phoenix Prototype Validation Series production (e)
BH 30 Validation Series production (e)
BH 10 (MSHA*) Validation Series production (e)
Shuttle Car Validation Series production (e)
Jumbo Face Drill Project Badger Prototype Validation Series production (e)
SR Proof of Concept Project Armadillo Prototype Validation
Load Haul Dump (LHD)
4t LHD Validation Series production (e)
7t LHD Validation Series production (e)
Image sources: Komatsu Mining
10t LHD Validation Series production (e)
14t LHD (Big Bertha) Prototype Validation Series production (e)
20t LHD Validation
* Series production also includes pre-series production processes and intermittent production of small batches.
** Mine Safety and Health Administration.
June 2019 Roadshow & Conference Presentation 22Installation of Energy by End Markets
MWh Units
90 1600
80 1400
70
1200
60
1000
50
800
40
600
30
400
20
10 200
0 0
2013 2014 2015 2016 2017 2018
Trolleybuses Intralogistics Mining Agriculture Starter Batteries Systems
June 2019 Roadshow & Conference Presentation 23Multiple Growth Paths Horizontal diversification
Market penetration
Starterbatteries for Pedelecs / Golf Medical
Motorbikes and Performance E-Bikes Trolleys equipment
Motorcars
Public transport Underground
Intralogistics
(Trolleybuses and EV-Buses) Mining
Vertical diversification
Voltapower* – Voltaforce* – Voltamotion**
Image sources: Komatsu Mining, Artega GmbH
DC-DC Onboard
converter charger
Market development
Master Slave BMS
BMS
Power Electronics and Drive Trains
Auxiliary
battery
Slave BMS Electric
machine
Electronics
Slave BMS
…
Surface Mining Agricultural Construction Ground support Rail
Inverter
Vehicles Vehicles equipment
June 2019 Roadshow & Conference Presentation 2460-Months Cumulative Order Book*
Total 60-months order book* 60-months cumulative order book* with
amounts to around € 1.1bn. 100% weighting as of 31 Dec. 2018
Thereof approx. 64% signed orders
and framework agreements
North America
(weighted with 100%) 18%
Estimated order backlog is weighted
according to the expected lifetime and
the probability of occurrence
Serves as base for planning
Evaluation system in place since
inception in 2011
Europe
82%
* As defined by the company.
June 2019 Roadshow & Conference Presentation 25Keyfacts for Revenues 2019e
Megatrend Electrification:
Intralogistics Agriculture / Construction
_ Direct sales
Mining
_ Triathlon share
(JT Energy)
Port / Rail
Bus industry
Mass markets Electric Vehicles
(Starter batteries, Pedelecs, …)
June 2019 Roadshow & Conference Presentation 26Agenda Highlights Technology Overview Business Overview Financials Appendix – Financials
Financial Highlights Q1 2018

      ↗ € 12.6 million                                                          ↗ 243 employees*
             Revenues (previous year: € 5.1 m)                                            (31 December 2018: 235)

                     Targets achieved according to plan –
                 Forecast for further strong growth confirmed

     ↗ € 2.5 million                           Margin: 19.9 %
                                                                                   ↗ € 0.6 million                              Margin: 4.4 %
            EBITDA (previous year: € -0.0 m)                                          EBIT (previous year: € -0.8 m)

                                                                                                         * Excluding 42 temporary employees, as of 31 December 2018.

June 2019                                            Roadshow & Conference Presentation                                                                           28
Further Strong Top Line Growth – Profit to rise
In €‘000
+ 118 %
18
16,520
+ 150 %
16
14 12,630
12 + 155 %
10 9,032
7,575
8
6 5,056
n.a. n. a. n.a.
4 3,544
+7%
2 837
560 354
0
-221 -206
-768 -989
-2 -1,301
-4
Revenue Total operating Gross profit EBIT Financial result EBT Group result
performance
Q1 2018 Q1 2019
June 2019 Roadshow & Conference Presentation 29Cash Flow Statement
Decrease in trade receivables (while increase in previous year); significant decrease in trade payables and other
liabilities
Buildup of inventories against the backdrop of production expansion
Payments for investments in property, plant and equipment due to facility expansion in the U.S.
Payments for investments in intangible assets after 3 months: € 1.7m
Cash flow from Cash flow from Cash flow from
operating activities* investment activities* financing activities*
€ -12.8m € -2.7m € 0.6m
(prior year: (prior year: (prior year:
€ -7.3m)* € -4.1m)* € -0.2m)*
Balanced Free Cash Flow expected
Q1 2019 FCF: € -15.7m 2019: by the Management Board
(Previous year: € -11.4m)
* 1 Jan. 2019 – 31 Mar. 2019.
June 2019 Roadshow & Conference Presentation 30Operating Cash Flow Bridge Q1 2019 (y-o-y)
Operating Cash Flow Bridge [in €m]
0 5.2
-2
-7.3
-4 1.0 0.1
1.3
-6 -12.8
0.9
-8 6.6
-10
-12 0.3
-14 5.8 0.1
Q1 2018 EBT D&A Financial Other non- Decrease in Increase in Increase in Interest paid Other Q1 2019
result cash expenses trade inventories trade payables
receivables & & other
other assets liabilities
June 2019 Roadshow & Conference Presentation 31Key Cash Flow Developments in 2018
EBITDA / Free Cash Flow Bridge [in €m]
10
2.5
0
-15.7
-10
14.1 0.3
1.1 0.1
2.8
0.0
-20
EBITDA Net Working Capital Interest paid Other CAPEX M&A Interest received FCF
June 2019 Roadshow & Conference Presentation 32Corrections to the Consolidated Financial Statements 2017 Voltabox AG made adjustments from the previous year in the 2018 consolidated financial statements, which mainly relate to the recognition of deferred taxes and expenses from the IPO, which were allocated to other operating expenses and offset against the profit carried forward. The resulting corrections for fiscal year 2017 are explained in the notes to the consolidated financial statements for fiscal year 2018 and have been published on May 6, 2019 in accordance with Section 109 (2)(1) of the German Securities Trading Act (WpHG). VBX FY 2017 (€m) Before Amendment After Nature EBIT 0.6 -3.4 -2.8 Inclusion of reallocated operating expenses from IPO Tax -0.1 -2.9 -3.0 Disallowance of deferred tax losses at Voltabox of Texas Reallocation 9.9 -9.9 0.0 Profit from paragon transfer agreement recognized directly in equity Net income 9.7 -16.2 -6.5 The above effects Number of shares (m) 11.3 4.7 Weighted average calculation corrected for timing of debt conversion EPS (€) 0.86 -2.25 -1.39 Net assets 3.3 -3.0 0.4 Deferred tax assets disallowed June 2019 Roadshow & Conference Presentation 33
CAPEX Investments
FY 2018 CAPEX Investments: CAPEX Investments in 2018
€ 10.0 million in GER and € 3.6 million in
the US
13.4
Own work capitalized mainly for following Difference to Forecast
projects Investments (€ 13.4m): € -0,2m Investment Plan 2019
Development of battery system for Komatsu Intangible
BH18/20 vehicle (as well as for 14t LHD) € 11.9m Intangible Assets Assets
Development of standard container for Trolley-
and EV-Buses
Further developments of Battery Systems for
Schäffer Front Wheel Loader and KUKA AGV € 6.0m
PPE*
In 2018, capitalized development costs fell € 1.6m
€ 8.0m
significantly due to direct revenue
recognition in the context of long-term, PPE*
combined development and series supply i.a. site expansion in Austin, Tx,
contracts equipment for EOL battery
production, shaker and climatic
chamber
FY 2019 CAPEX Investments: Virtually unchanged at approx. € 14m
Capitalized development costs amount to about 57 % of the investment total
*Property, Plant and Equipment.
June 2019 Roadshow & Conference Presentation 342018: Expectations Met – 2019: Ambitious Business Goals
Further expansion of direct sales activities in Europe - Upcoming (additional)
orders in Germany and further European countries expected for 2019
UL Certification of battery system for US intralogistics market – First Voltabox of
2019
Texas sales with intralogistics systems expected for H2/2019
Acceleration of projects with Komatsu - transfer of validation projects to series
production
Start of parts of Voltaforce production in Kunshan plant, China – Expansion of
production facilities at Austin branch
Opening up new mass market segments
June 2019 Roadshow & Conference Presentation 35Forecast 2019
↗ € 105-115 m
Revenues 2019 (e)
↗ ca. 8-9 %
EBIT Margin 2019 (e)*
*Considering € 1.5m add. expenses from rearrangement of
intralogistics partner agreement
June 2019 Roadshow & Conference Presentation 36Forecast and Analyst Consensus
Financial performance
indicators of Voltabox AG
2018 2019
[in € million / as indicated] Latest Forecast Results Forecast
Group revenue 65 – 70 66.9 Approx. 105 – 115
EBIT margin 7 %* 8.4 % Approx. 8 – 9 %**
Investments 13.4 13.6 Approx. 14
thereof: IAS 38 5.8 3.0 Approx. 8
Analyst estimates 2018 2019
Group revenue 65.5 112.1
EBIT margin 6.8 % 9.5 %
* Considering € 2m add. expenses from rearrangement of intralogistics partner agreement.
** Considering € 1.5m add. expenses from rearrangement of intralogistics partner agreement.
June 2019 Roadshow & Conference Presentation 37Performance of Voltabox Share (VBX) since IPO
140%
130%
120%
110%
100%
90%
80%
70%
60%
50%
40%
30%
20%
Voltabox AG TecDAX SDAX DAX CXKH
June 2019 Roadshow & Conference Presentation 38Voltabox on the Road – Trade Fairs and Exhibitions
21-22 Nov. 2018,
Solingen
3-7 Oct. 2018, 19-21 Feb. 2019,
Cologne Stuttgart 10-12 Sep. 2019,
Novi, MI
15-17 May 2018,
Hannover
May 2018 September 2019
20-27 Sep. 2018,
Hannover
12-22 Sep. 2019,
Frankfurt/Main
5 July 2018, 8-11 Jan. 2019, 7-9 May 2019,
Aachen Las Vegas, NV Stuttgart
11-13 Sep. 2018,
Novi, MI 20 Nov. 2018,
Essen
June 2019 Roadshow & Conference Presentation 39Financial Calendar 2019 January 10-11 ODDO BHF FORUM, Lyon January 31 Bankhaus Lampe German Corporate Conference, London February 19-20 ODDO BHF German Conference, Frankfurt am Main April 1 Annual Report – Consolidated Financial Statements 2018 April 3-5 Bankhaus Lampe German Conference, Baden-Baden April 11 Solventis Aktienforum, Frankfurt am Main May 13 Group Interim Report as of March 31, 2019 – First quarter May 16 Annual General Meeting, Delbrück August 21 Group Interim Report as of June 30, 2019 – Half year September 2-3 Equity Forum Fall Conference, Frankfurt am Main November 13 Group Interim Report as of September 30, 2019 – 9 months November 25-27 Eigenkapitalforum, Frankfurt am Main June 2019 Roadshow & Conference Presentation 40
Agenda Highlights Technology Overview Business Overview Financials Appendix – Financials
Continuous Dynamic Top Line Growth in FY 18
In €‘000
                                        + 156 %

  90
                + 145 %
                                                  80,069
  80

  70                      66,909

  60
                                                               + 159 %
  50
                                                                         37,822
  40
                                    31,291
  30       27,273
                                                                                          + n.a. %
                                                                                                                     n.a.                                                 n. a.                          n.a.
  20                                                       14,630
                                                                                                     9,593                                   + 21 %
  10                                                                                                                        5,611                                                  5,464
                                                                                                                                                                                                                 2,579

    0
                                                                                      -389*                                          -697*            -147
                                                                                                               -2,819*                                             -3,516*
  -10                                                                                                                                                                                             -6,514*
              Revenue              Total operating         Gross profit                 EBITDA                      EBIT            Financial result                      EBT                     Group result
                                    performance
                                                                                              FY 2017        FY 2018
                                                                                                                                                  *As retrospectively amended in FY 2018 consolidated financials statements.

  June 2019                                                                       Roadshow & Conference Presentation                                                                                                      42
Cash Flow Statement FY 18
Significant increase in net working capital due to increase in trade receivables resulting from
very good business development and
sales financing support for main Voltabox partner (limited to H2/2018, ended at Dec. 31)
as well as due to higher inventories resulting from
ensuring delivery capability in the context of entering the direct intralogistics business and
preparation for revenue recognition in the first quarter of 2019
Cash flow from Cash flow from Cash flow from
operating activities* investment activities* financing activities*
€ -54.8m € -19.1m € -0.5m
(prior year: (prior year: (prior year:
€ -4.7m)** € -6.0m)** € 112.4m)**
2018 Free Cash Flow***: € -68.4m
(Previous year: € -11.0m)** * 1 Jan. 2018 – 31 Dec. 2018.
** As retrospectively amended in FY 2018 consolidated financials statements.
*** Adjusted for transactions.
June 2019 Roadshow & Conference Presentation 43Key Factors for Profitability Development in FY 18
↑
2019
%
Economies of scale
through highly
automated production
9M 2018
8,4
2018*
↑
%
7,0%
Optimized Material
-10,3 Input Ratio
9M 2017
-10,7%
↑
High Total Operating
Performance
*As retrospectively amended in FY 2018 consolidated financials statements.
June 2019 Roadshow & Conference Presentation 44Key Developments of Assets in FY 18
Increase of noncurrent assets by € 23.7m
Assets in € million
Intangible assets € +11.5m – capitalized development
200
expenses and extended scope of consolidation
Cash and cash
Goodwill € +6.5m – Acquisitions of Concurrent Design and 180
equivalents
ACCURATE 160 Other current assets
Other assets € +5.0m – predominantly attributable to long-
140
term accrued expenses and contractual assets Trade receivables
120
Decrease of current assets by € -10.0m
Inventories
Inventories € +23.0m – expansion of the operating business 100
and in this context entry into the intralogistics direct business 80 Other noncurrent assets
Trade receivables € +34.0m – temporary extended payment
60
terms to the customer Triathlon Property, plant and
40 equipment
Liquid funds € -74.4m – short-term capital commitment in
operating activities due to the Group’s business expansion Goodwill
20
Other current assets € +6.2m – prepaid expenses and Intangible assets
0
recognition of contractual assets Dec. 31, 2017* Dec. 31, 2018
*As retrospectively amended in FY 2018 consolidated financials statements.
June 2019 Roadshow & Conference Presentation 45Key Developments of Equity and Liabilities in FY 18
Decrease of noncurrent provisions and liabilities Dec. 31, 2018 Dec. 31., 2017*
Equity 154,484 152,111
by € -0.5m
Subscribed capital 15,825 15,825
Noncurrent loans € -3.4m
Capital reserve 127,992 127,992
Deferred tax liabilities € +2.9m
Profit/loss carried forward 7,614 14,038
Increase of current provisions and liabilities Consolidated net income 2,579 -6,514
by € 11.8m Currency translation differences 474 770
Current loans € +3.0m Noncurrent provisions and
7,808 8,287
liabilities
Trade payables € +5.7m
Noncurrent finance lease liabilities 17 16
Liabilities to related parties € -1.3m Noncurrent loans 141 3,532
Other current liabilities € +3.5m Deferred tax liabilities 7,650 4,739
Increase of equity by € +2.4m Current provisions and liabilities 19,224 7,375
Trade payables 9,257 3,591
Equity ratio at 85.3 % (Dec. 31, 2017: 90.7 %) as
expected resulting from the rise in total assets Liabilities to related parties 557 1,813
Other current liabilities 5,871 1,439
181,516 167,773
*As retrospectively amended in FY 2018 consolidated financials statements.
June 2019 Roadshow & Conference Presentation 46Operating Cash Flow Bridge (y-o-y)
Operating Cash Flow Bridge [in €m]
10 3.4 0.1
5.5
0
-4,7 * 0.3
-10
-20
-30 -59,5
-40
45.3
-50
3.7 0.7
-60
0.1
-70 22.5
2017 EBT D&A Financial Other non- Increase in Increase in Increase in Interest paid Other 2018
result cash expenses trade inventories trade payables
receivables & & other
other assets liabilities
*As retrospectively amended in FY 2018 consolidated financials statements.
June 2019 Roadshow & Conference Presentation 47Key Cash Flow Developments in FY 18
EBITDA / Free Cash Flow Bridge [in €m]
20
9.6 *
0
-20
-73.9
-40
1.8
-60 64.1
0.3
13.6
-80 7.3
EBITDA Net Working Capital Other Selling of intangible CAPEX M&A FCF
assets
*As retrospectively amended in FY 2018 consolidated financials statements.
June 2019 Roadshow & Conference Presentation 48Disclaimer This presentation is given to you in strict confidence. By attending the presentation, you agree that no part of this presentation or disclaimer may be disclosed, distributed or reproduced to any third party without the consent of Voltabox AG (“Voltabox”). This presentation is being provided for the sole purpose of providing the recipients with background information about Voltabox‘s business. This presentation, including the information contained in this disclaimer, does not constitute an offer, invitation or recommendation to subscribe for or purchase any security and neither the presentation, disclaimer nor anything contained in them forms the basis of any contract or commitment. This presentation does not purport to summarize all information that an investor should consider when making an investment decision. It should be read in conjunction with Voltabox’s other continuous disclosure announcements. Before making an investment decision you should consider whether it is suitable for you in light of your own investment profile and objectives and financial circumstances and the merits and risk involved. No representation, express or implied, is made as to the fairness, accuracy, completeness or correctness of information, opinions and conclusions contained in this presentation, including the accuracy, likelihood of achievement or reasonableness of any forecasts, prospects, returns or statements in relation to future matters contained in the presentation (“forward-looking statements”). Such forward-looking statements are by their nature subject to significant uncertainties and contingencies and are based on a number of estimates and assumptions that are subject to change (and in many cases are outside the control of Voltabox and its Directors) which may cause the actual results or performance of Voltabox to be materially different from any future results or performance expressed or implied by such forward-looking statements. Forward looking statements are provided as a general guide only and should not be relied upon as an indication or guarantee of future performance. To the maximum extent permitted by law, neither Voltabox nor its related corporations, directors, employees or agents, nor any other person, accepts any liability, including, without limitation, any liability arising from fault or negligence, for any loss arising from the use of this presentation or its contents or otherwise arising in connection with it. You represent and confirm by attending and/or retaining this presentation, that you accept the above conditions. June 2019 Roadshow & Conference Presentation 49
Company Contact
Voltabox AG
Investor Relations
Dr. Kai Holtmann
Artegastraße 1
D-33129 Delbrück
Phone: +49 (0) 5250 9930-964
E-Mail: investor@voltabox.ag

June 2019                      Roadshow & Conference Presentation   50
You can also read