Financial conditions for renters before and during the COVID-19 pandemic - CFPB Office of Research Research Brief No. 2021-9
←
→
Page content transcription
If your browser does not render page correctly, please read the page content below

CONSUMER FINANCIAL PROTECTION BUREAU   |   SEPTEMBER 2021

Financial conditions for
renters before and during
the COVID-19 pandemic

CFPB Office of Research
Research Brief No. 2021-9

Alexandra Dobre, Marie Rush, and Eric Wilson prepared this
report
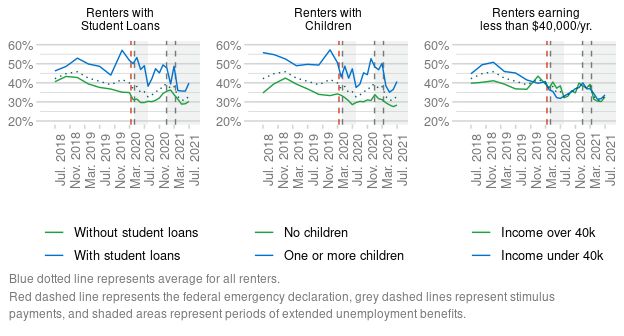
Table of contents
Table of contents......................................................................................................... 1

1.   Introduction ........................................................................................................... 2

2.   Data and Demographics ....................................................................................... 6
      2.1    About the data .......................................................................................... 6
      2.2    Comparing renter and homeowner demographics .................................. 7

3.   Financial conditions for renters and homeowners .......................................... 10
      3.1    Pre-pandemic financial conditions for renters and homeowners ......... 10
      3.2    During the pandemic .............................................................................. 14

4.   Looking ahead .................................................................................................... 23

Appendix A:            Comparisons to other datasets ..................................................... 24

Appendix B:            Debt balances by housing status .................................................. 30

1      CONSUMER FINANCIAL PROTECTION BUREAU
1. Introduction
Before the COVID-19 pandemic, economic conditions among some renters appeared to be
improving. Between 2016 and 2019, median incomes and median net worth among renters grew
6 percent and 18 percent respectively. 1 And between 2011 and 2018, the share of renters paying
                                                 0F

more than 30 percent of their incomes in rent declined from 50.7 percent to 47.5 percent. 2                       1F

The onset of the pandemic has intensified the economic headwinds many renters may face,
however. Our data suggest that, in June 2020, 22 percent of renters with a credit record were
unemployed, compared to 12 percent of homeowners. According to the U.S. Census Bureau, 16
percent of renters said that their household is not current on their rent payment as of June
2021. 3 And as of May 2021, renters owed an estimated $29.7 billion in back rent. 4 Rental
         2F                                                                                            3F

assistance from more recent relief bills has been slow to arrive. 5              4F

Against this backdrop, we document how financial conditions faced by renters evolved, relative
to those faced by homeowners, over the course of the pandemic. To do so, we use two waves of
the Consumer Financial Protection Bureau’s Making Ends Meet survey and its association with
consumer credit data. We compare renters to homeowners on a variety of financial outcomes
from before the pandemic, during its early stages in spring 2020, and through spring 2021. We
also examine outcomes for several subgroups of renters who were more likely to be recipients of
certain pandemic supports. Renters are not an entirely homogenous group. Some renters may
have been doing better than others and not all renters qualified for, or received, financial
pandemic supports. Our data do not allow us to identify which, if any, financial supports were
received.

1   Board of Governors of the Federal Reserve System, “Changes in U.S. Family Finances from 2016 to 2019: Evidence
    from the Survey of Consumer Finances,” September 2020. Available:
    https://www.federalreserve.gov/publications/files/scf20.pdf.
2   Joint Center for Housing Studies of Harvard University, “America’s Rental Housing,” 2020. Available:
    https://www.jchs.harvard.edu/sites/default/files/reports/files/Harvard_JCHS_Americas_Rental_Housing_2020.
    pdf. Note that the population of renters with annual incomes over $75,000 has accounted for a significant portion of
    the growth in the
3   US Census Bureau, “Week 33 Household Pulse Survey: June 23 – July 5,” July 14, 2021. Available:
    https://www.census.gov/data/tables/2021/demo/hhp/hhp33.html. According to Housing Table 1b, an estimated
    total of 7,433,895 renter households were not caught up on rent payments during the survey period.
4   Moody’s Analytics June 2021 baseline economic outlook.
5   In December 2020, Congress appropriated $25 billion towards emergency rental aid. Between January and the end
    of July, only $5.1 billion had been spent. Michael Casey, “Feds report most rental assistance has still not gone out,”
    Associated Press, August 25, 2021. Available: https://apnews.com/article/lifestyle-business-health-coronavirus-
    pandemic-68d5f61397c203fb9bd023f10671ee18.

2         CONSUMER FINANCIAL PROTECTION BUREAU
Renters and homeowners differ in many ways and, based on demographic factors, we would
expect renters’ financial conditions to be less favorable than those of homeowners. On average,
renters are younger and have lower incomes than homeowners, characteristics that are typically
correlated with lower financial status.6 Given that renters are younger, they are also more likely
to be credit invisible.7 It is important to note that, due to the nature of our sample and its
association with credit data, we only focus on renters with a credit record, which we discuss
further below.
Prior to the pandemic, average credit scores among renters were 86 points lower than those of
mortgagors, and 106 points lower than those of homeowners who reported paying no mortgage.
Renters’ Financial Well-Being Scores8 were nearly eight points lower9 than those of mortgagors,
and over 13 points lower than those of homeowners who reported paying no mortgage.
Renters’ credit portfolios also differed considerably from those of homeowners before the
pandemic. In June 2019, renters were more likely than homeowners to have student debt and to
have recently used alternative financial services such as payday, auto title, or pawn loans.
Comparing renters and homeowners over the course of the pandemic, we find the following:
• Despite adverse labor market conditions, renters’ financial circumstances appeared, on
average, to improve as much as or more than those of homeowners. 10 Renters’ credit 9F
scores grew by 16 points during the pandemic, compared to 10 points for mortgagors and
seven points for other homeowners. 11 These increases are significant even given the
10F
trends before the pandemic. Renters’ Financial Well-Being Scores also appeared to
6 See Scott Fulford, Marie Rush, and Eric Wilson, “Changes in consumer financial status during the early months of
the pandemic,” April 30, 2021. Available: https://www.consumerfinance.gov/data-research/research-
reports/changes-in-consumer-financial-status-during-early-months-pandemic/.
7 See Kenneth P. Brevoort, Philipp Grimm, and Michelle Kambara, “Credit Invisibles,” May 2015. Available:
https://files.consumerfinance.gov/f/201505_cfpb_data-point-credit-invisibles.pdf.
8 The CFPB’s Financial Well-Being Scale is a five or ten question survey created to measure financial well-being. See
section 3.1 for more details on the Financial Well-Being Scale and how it differs for renters and homeowners. For a
detailed description of how this scale is constructed and its distribution from a national survey, see: “Financial well-
being in America,” September 2017, CFPB report. Available:
https://s3.amazonaws.com/files.consumerfinance.gov/f/documents/201709_cfpb_financial-well-being-
inAmerica.pdf.
9 For comparison, an eight-point increase in Financial Well-Being Score is what we would expect to see from someone
whose household income shifted from $40,000 or less to between $70,000 and $100,000. See Table 3 in Fulford,
Rush, and Wilson, “Changes in consumer financial status.”
10 Throughout this report, we refer to homeowners who report paying a mortgage as “Mortgagors” and those who
report not paying a mortgage as “Other Homeowners.” See Section 2.2 for details.
11 Homeowners’ credit scores may have had less room to improve than those of renters, since they were higher.
3 CONSUMER FINANCIAL PROTECTION BUREAUimprove more than those of homeowners, though our limited sample makes this finding
less conclusive.
• Renters’ financial conditions have been significantly more responsive to changes in
public policy throughout the pandemic. Delinquency, credit card utilization, and credit
card debt among renters appeared to move up and down in response to stimulus
payments and changes in federal unemployment benefits. Homeowners did not show the
same degree of sensitivity.
• Among renters, some credit outcomes for recipients of certain pandemic supports
appeared to be more responsive to federal policy changes than those of other groups. For
example, credit scores among renters with student debt leapt during the first months of
the pandemic after the CARES Act paused federal student loan payments. Delinquency
among renters with children saw a considerable decline following stimulus payments,
which were larger for households with children.
Taken together, our findings indicate that renters’ finances have been highly sensitive to policy
during the pandemic, likely a combined product of renters’ existing financial vulnerabilities and
how pandemic policies were designed. Before the pandemic, renters were more likely to be
financially vulnerable, partly because they were younger on average and had lower incomes.
These factors made them both more likely to receive a larger stimulus payment 12 and more likely 1F
to receive student loan forbearance. During the pandemic, renters were also more likely to face a
period of unemployment, and so more were likely to be recipients of extended unemployment
benefits.
Our findings are limited by the sample available from the Making Ends Meet survey. The survey
is representative of the population with a credit record rather than the population at large, and
has approximately 3,000 respondents, about one quarter of whom were renting in June 2019.
Our sample also has fewer high-income renters and older renters than the overall population. 13 12F
We also fix housing status in June 2019; some people who were renting bought homes during
the subsequent months while some homeowners sold and started renting. 14 Our approach 13F
nonetheless produces results similar to those in other studies. Others have concluded, for
example, that COVID-19 had a larger impact on employment for renters than for homeowners,
12 Stimulus payments were also based on the number of children in a household.
13 See Appendix A for a detailed comparison of our sample to other national datasets.
14 About five percent of those who rented in June 2019 had a mortgage by June 2020, and ten percent had a mortgage
by June 2021 (although it is possible that their mortgage was held by a spouse or partner). We currently leave these
in the “Renter” group for the purposes of consistency. Dropping these individuals from our sample does not appear
to change our results significantly: For example, our estimates for renters’ average Financial Well-Being Scores in
June 2019 and June 2020 drop by less than half a point when these individuals are excluded.
4 CONSUMER FINANCIAL PROTECTION BUREAUbut that liquid savings balances increased more (in percentage terms) for renters than for
homeowners. 15 14F
The fiscal supports we focus on have either ended or are scheduled to end in the coming months.
Additional unemployment benefits expired on September 6th, the updated CDC eviction
moratorium has ended, 16 and student loan forbearance will end on January 31, 2022. Our
15F
results suggest that renters’ finances are likely vulnerable to the cessation of these supports.
Similarly, our results suggest that renters’ finances will be sensitive to the amount and timing of
funds from the Child Tax Credit (CTC) and distribution of rental assistance in the coming
months.
15 Fiona Grieg, Chen Zhao, Alexandra Lefevre, “Renters vs. Homeowners: Income and Liquid Asset Trends during
COVID-19,” March 2021. Available: https://www.jpmorganchase.com/institute/research/household-debt/renters-
homeowners-income-and-liquid-asset-trends-during-covid-19.
16 Alabama Association of Realtors, et.al v. Department of Health and Human Services, et.al., 594 U.S., 2021 WL
3783142 (August 26, 2021).
5 CONSUMER FINANCIAL PROTECTION BUREAU2. Data and Demographics
2.1 About the data
We use the first two waves of the Making Ends Meet survey to understand renters’ financial
conditions and compare them to those faced by homeowners. The survey results provide a
deeper understanding of how often U.S. consumers have difficulty making ends meet, how they
cope with these shortfalls, and the consequences of the shortfalls. The Bureau conducted Wave 1
of the survey starting in May 2019 and Wave 2 starting in May 2020. Most respondents took
several weeks to respond, so typical responses occurred in June in each year. We refer to June as
the month the surveys occurred.
The survey sample is drawn from the Bureau’s Consumer Credit Panel (CCP), a 1-in-48 random
and de-identified sample of credit records maintained by one of the three nationwide credit
reporting agencies. 17 This connection to the CCP is a key advantage of the survey and allows us
16F
to understand how consumers’ credit and debts evolve before, during, and after the survey
waves. In addition, the survey results include information about race, ethnicity, income, gender,
education, and other demographic variables which are not typically known by the credit bureau.
Ultimately, 2,990 consumers responded to Wave 1 either on paper or online. Of those, 1,834—or
about 61 percent—responded to at least the first questions in Wave 2. In this brief, we use data
from the larger sample in Wave 1 to understand pre-pandemic financial conditions as well as
trends in credit outcomes we observe for the same respondents in the CCP. We also use data
from Wave 2 to understand changes over time in the survey-based outcomes we study.
Additional details on the Wave 1 and Wave 2 sampling methodology and survey protocol are in
the initial report on Wave 1 and a second report that uses Wave 2 data. 18 17F
17 The CCP excludes any information that might reveal consumers’ identities, such as names, addresses, and Social
Security numbers. For more information on the privacy protections associated with this survey, see the Consumer
Experience Research Privacy Impact Assessment, available at
http://files.consumerfinance.gov/f/201406_cfpb_consumer-experience-research_pia.pdf and System of Records
Notice CFPB.022, Market and Consumer Research Records, available at
http://www.consumerfinance.gov/privacy/system-records-notices/market-and-consumer-research-records-2/.
18 Scott Fulford and Marie Rush, “Insights from the Making Ends Meet Survey,” July 13, 2020. Available:
https://www.consumerfinance.gov/documents/8990/cfpb_making-ends-meet_survey-results_2020-07.pdf.
Fulford, Rush, and Wilson, “Changes in consumer financial status.”
6 CONSUMER FINANCIAL PROTECTION BUREAU2.2 Comparing renter and homeowner
demographics
According to our data, 68 percent of adults with a credit record are homeowners, 27 percent are
renters, and five percent neither rent nor own their own home. Because this report is about the
financial challenges faced by renters, we exclude this last group from our analysis. Also, in many
areas throughout this report, we split the homeowner group into two categories: “mortgagors”
and “other homeowners.” We do so to allow for comparisons between renters and homeowners
who face regular housing costs in the form of mortgage payments. We define “mortgagors” as
homeowners who report paying a mortgage on their home, while “other homeowners” as
homeowners who report that they do not pay a mortgage on their home. 19 18F
Table 1, below, shows that renters are more likely than homeowners to be Black or Hispanic. On
average, renters have lower incomes, are younger, and are more likely to be women compared to
homeowners. Renters are also less likely to have a collegiate or postgraduate degree. These
differences are key to understanding many of the disparities in finances between renters and
homeowners, because the renter population tends to overlap with demographic groups who,
previous research has shown, often face worse financial conditions than others. 20 19F
TABLE 1: DEMOGRAPHICS OF RENTERS AND HOMEOWNERS IN THE MAKING ENDS MEET SURVEY
Demographic
Renters (Percent) Homeowners (Percent)
Group
Race/Ethnicity - -
Non-Hispanic White 53.1 74.0
Black 25.1 8.8
Hispanic 14.5 8.9
Other 7.3 8.4
19 This group could consist of homeowners who inherited their home, who bought their home with cash, or who have
finished paying their mortgage, for example.
20 Fulford, Rush, and Wilson, “Changes in consumer financial status.”
7 CONSUMER FINANCIAL PROTECTION BUREAUTABLE 1: DEMOGRAPHICS OF RENTERS AND HOMEOWNERS IN THE MAKING ENDS MEET SURVEY, CONT.
Demographic Group Renters (Percent) Homeowners (Percent)
2018 Household
- -
Income 2120F
$40,000 or less 56.9 23.7
$40,001 to $70,000 24.0 26.3
$70,001 to $100,000 11.3 21.1
More than $100,000 7.7 29.0
Geographic group 22 21F - -
Metro (RUCC 1, 2, 3) 90.6 85.1
Some urban (RUCC
6.9 10.5
4, 5, 6)
Rural (RUCC 7, 8, 9) 2.5 4.4
Gender - -
Male 43.0 53.6
Female 57.0 46.4
Educational
- -
Attainment in 2019
High school or less or
38.6 27.1
vocational
Some college 29.9 30.5
College or post-
31.5 42.4
graduate
21 When asked about their total household income, survey respondents were asked to select from one of the following
ranges: $15,000 or less, $15,001 to $20,000, $20,001 to $40,000, $40,001 to $70,000, $70,001 to $100,000, and
more than $100,000. In this report, we combine those who selected the lowest three income options and report as
$40,000 or less.
22 Metro and non-metro areas are based on whether the respondent’s county contains an urban area of 50,000 or
more population. The definitions are based on the Department of Agriculture’s 2013 Rural-Urban Continuum Codes
(RUCC) with Metro counties containing a metro area (defined as RUCC 1, 2 and 3); some urban counties containing
a smaller urban area or adjacent to a metro area (defined as RUCC 4, 5, and 6); and fully rural counties lacking any
substantial urban area and not adjacent to a metro area (defined as RUCC 7, 8, and 9). RUCC are discussed more
here: https://www.ers.usda.gov/data-products/rural-urban-continuum-codes/.
8 CONSUMER FINANCIAL PROTECTION BUREAUTABLE 1: DEMOGRAPHICS OF RENTERS AND HOMEOWNERS IN THE MAKING ENDS MEET SURVEY, CONT.
Demographic Group Renters (Percent) Homeowners (Percent)
Age group - -
Age =62 14.6 36.6
How many children
live in your - -
household?
No children 58.6 59.5
1 child 18.8 17.4
2 or more children 22.7 23.0
9 CONSUMER FINANCIAL PROTECTION BUREAU3. Financial conditions for
renters and homeowners
3.1 Pre-pandemic financial conditions for
renters and homeowners
Prior to the pandemic, renters faced greater financial challenges along several dimensions than
those who reported owning a home. As of June 2019, their average credit scores were 86 points
lower than those of mortgagors, and 106 points lower than those of other homeowners. Their
Financial Well-Being Scores were nearly eight points lower than those of mortgagors, and over
13 points lower than those of other homeowners. 23 The CFPB’s Financial Well-Being Score is a
2F
measure that broadly gauges consumers’ subjective financial outlook. Between 2015 and 2017,
the CFPB produced a consumer-driven definition of financial well-being and a validated scale
for measuring it. The survey items that make up this scale include questions to determine the
extent to which statements like “My finances control my life” and “I am just getting by
financially” apply to respondents. 24 Both waves of the Making Ends Meet survey included the
23F
five-question version of the Financial Well-Being scale, which is then used to calculate
respondents’ Financial Well-Being Scores.
Figure 1 underscores the considerable differences in both credit scores and Financial Well-Being
Scores among renters. Not only do the averages differ significantly, the 75th percentile of credit
scores among renters is lower than the median credit score for mortgagors, suggesting that
fewer than 25 percent of renters had credit scores that would be in the top half of the credit
score distribution among mortgagors. 25 The 75th percentile of Financial Well-Being Scores
24F
among renters is equal to the median Financial Well-Being Score for mortgagors.
23The gaps in outcomes between renters and mortgagors may be slightly over-estimated given the moderate
underrepresentation of high-income renters in our dataset. (See Appendix A.)
24For a detailed description of how this scale is constructed and its distribution from a national survey, see:
“Financial well-being in America,” September 2017, CFPB report. Available:
https://s3.amazonaws.com/files.consumerfinance.gov/f/documents/201709_cfpb_financial-well-being-
inAmerica.pdf.
25Differences in credit scores are to be expected; mortgagors must meet underwriting standards to receive a
mortgage. As stated in Section 1, renters are more likely to be credit invisible and those who do not have a credit
record are not included in our analysis.
10 CONSUMER FINANCIAL PROTECTION BUREAUFIGURE 1: DISTRIBUTIONS OF CREDIT SCORES AND FINANCIAL WELL-BEING SCORES AMONG
RENTERS, MORTGAGORS, AND OTHER HOMEOWNERS 26 25F
Figure 2, meanwhile, documents difficulties paying for a bill or expense, liquidity constraints,
and credit card utilization, each of which is an important measure of a household’s financial
resilience. Renters were nearly twice as likely as mortgagors to have had difficulty paying for a
bill or expense in the twelve months before June 2019. 27 Homeowners also had greater available
26F
liquidity: 59 percent of renters said that their available liquidity 28 was only enough to last one
27F
month or less, if they were to lose their primary source of income. This figure drops to 31
percent and 20 percent for mortgagors and for other homeowners respectively. Credit card
utilization among renters was greater than utilization among homeowners. In June 2019,
renters were using an average of 41 percent of the credit available on their credit cards,
compared with 28 percent for mortgagors and 16 percent for other homeowners.
26The solid line at the center of each box represents the median and the free-floating dot represents the mean. The
box extends from the 25th to the 75th percentile, and the lines beyond the box mark the tenth and 90th percentiles.
27Overall, in June 2019, 40 percent of people with a credit record experienced difficulty paying for a bill or expense,
including over 60 percent of renters.
28Liquidity refers to the amount of money that is readily available to settle debts. Liquidity includes both short-term
savings and available credit. Survey respondents were asked how long they would be able to cover expenses if they
lost their main source of income using all available sources of funds, including borrowing, with response options
ranging from less than two weeks, to more than six months.
11 CONSUMER FINANCIAL PROTECTION BUREAUFIGURE 2: PERCENTAGE OF PEOPLE WHO HAD DIFFICULTY PAYING FOR A BILL OR EXPENSE IN THE 12
MONTHS LEADING UP TO JUNE 2019 BY HOUSING STATUS ALONG WITH CREDIT CARD
UTILIZATION AND PREVALENCE OF LOW LIQUIDITY 29 28F
3.1.1 Pre-pandemic differences in credit portfolios
Differences in financial conditions before the pandemic were also reflected in the types of credit
renters and homeowners used. Renters were less likely to have credit cards and auto loans, and
more likely to use alternative financial products such as payday, pawn shop, and auto title loans.
Figure 3 shows about 87 percent of mortgagors had an open credit card in June 2019 compared
to only 64 percent of renters. Approximately 32 percent of renters had an auto loan compared to
43 percent of mortgagors. Around 11 percent of renters had taken out a payday loan, auto-title
loan, or pawn shop loan in the six months leading up to June 2019 versus 4 percent of
mortgagors.
Renters were also more likely to hold student loans. Renters were almost 50 percent more likely
than mortgagors to have a student loan (28 percent versus 19 percent). The preponderance of
student debt among renters may be partly explained by their ages: renters tend to skew younger
than homeowners and thus have had less time to pay off their balance. 30 29F
29 The black bars in these graphs represent a 95 percent confidence interval.
30 According to Table 1, approximately 50 percent of renters and 23 percent of homeowners were under the age of 40.
12 CONSUMER FINANCIAL PROTECTION BUREAUFIGURE 3: PERCENTAGE OF RENTERS, MORTGAGORS, AND OTHER HOMEOWNERS WITH SELECTED
CREDIT PRODUCTS 31 30F
3.1.2 Pre-pandemic conditions among renter subgroups
We also compare pre-pandemic financial status for renter subgroups who were recipients of
certain pandemic supports: Renters with student loans, renters with incomes below $40,000,
and renters with children. We focus on these groups because stimulus payments were larger for
those with children and those with lower incomes, and all federal student loans were placed in
forbearance.
As Table 2 shows, as of June 2019, each of these groups was more financially vulnerable than
overall renters. Renters with children had the lowest average credit score of 598. Renters with
student loans had the lowest average Financial Well-Being Score of all the subgroups and were
slightly worse off than the average renter on other measures. 32 31F
31 The black bars in these graphs represent a 95 percent confidence interval.
32 Because these groups are not mutually exclusive, we cannot determine whether differences between them are
statistically significant.
13 CONSUMER FINANCIAL PROTECTION BUREAUTABLE 2: PRE-PANDEMIC FINANCIAL CONDITIONS AMONG GROUPS OF RENTERS WHO RECEIVED
CERTAIN PANDEMIC SUPPORTS
Renters
Renters with
earning Renters with
All Renters Student Loans
- $40,000 or less children
(n = 560) (in June 2019)
(in June 2019) (n=229)
(n = 141)
(n=324)
Credit Score 636 625 620 598
Financial Well-
44.7 42.2 42.3 43.6
Being Score
Had difficulty
paying a bill or
expense in 12
62.5 68.7 70.2 75.2
months before
June 2019
(percent)
Credit Card
Utilization in June 40.8 48.7 45.2 49.7
2019 (percent)
Household has
one month or less
59.2 70.7 68.6 64.2
of liquidity
(percent)
Table 2 also shows the percent of respondents in each group that had difficulties paying a bill or
expense in the 12 months leading up to June 2019. Renters with children were well above the
renter average, with 75 percent reporting difficulties. Renters with student loans and those
earning $40,000 or less per year were also more likely than the average renter to experience this
hardship. Like Figure 2, Table 2 documents differences in credit card utilization and overall
liquidity but does so for each of the respective subgroups. As of June 2019, renters with student
loans, renters making $40,000 or less per year, and renters with children all had greater credit
card utilization and lower liquidity than homeowners before the pandemic.
3.2 During the pandemic
COVID-19 triggered a severe economic recession, and with it a major spike in unemployment,
particularly for renters. Our data show that, in June 2019, three percent of homeowners and six
percent of renters were unemployed. By June 2020, the fraction of unemployed homeowners
had grown by nine percentage points to 12 percent, while the fraction of unemployed renters
had jumped by 16 percentage points to 22 percent.
14 CONSUMER FINANCIAL PROTECTION BUREAUSurvey-based measures of financial status, however, either improved or held steady for renters
between June 2019 and June 2020. 33 Figure 4 shows that renters’ Financial Well-Being Scores
32F
increased and the share reporting difficulty paying for bills or expenses declined. Given our
sample size, however, we cannot completely rule out the possibility that each of these figures
moved in the opposite direction.
FIGURE 4: UNEMPLOYMENT AND SURVEY-BASED MEASURES OF FINANCIAL WELL-BEING DURING THE
EARLY STAGES OF THE PANDEMIC, BY HOUSING STATUS 34 3F
Credit scores, meanwhile, improved for renters, mortgagors, and other homeowners. 35 Between 34F
June 2019 and June 2020, renters’ credit scores increased by 16 points, compared to increases
of 10 and seven points for mortgagors and owners without mortgage payments, respectively.
33For our survey-based measures of financial status and for our measure of unemployment during the pandemic, we
use data from the smaller sample of individuals who responded to both Wave 1 and Wave 2 of the survey. This
means, in many cases, that we are less certain of the results we present. Respondents were considered unemployed
in June 2020 if they said that they were “unemployed” or that they were “temporarily laid off” for reasons either
related or unrelated to the pandemic.
34 The black bars in these graphs represent a 95 percent confidence interval.
35 For measures based on credit report information, we return to our full sample from Wave 1.
15 CONSUMER FINANCIAL PROTECTION BUREAUFIGURE 5: CREDIT SCORES BY HOUSING STATUS BETWEEN JUNE 2018 AND MARCH 2021 The larger increase in renters’ credit scores between June 2019 and June 2020 appears to have arisen from a decline in the rate of delinquencies reported for renters over the early pandemic, as well as a pronounced dip in credit card utilization. Between December 2019 and June 2020, the percentage of renters with at least one delinquency dropped from 33.3 percent to 30.5 percent. Credit card utilization among renters dropped from 42 percent to 35 percent over the same period. Credit card utilization also reached a low point in July 2020, one month later. The drop in utilization and delinquency is consistent with findings from other Bureau research. 36 35F With the cessation of expanded unemployment benefits in July 2020, both measures began to increase. In September 2020, the percentage of renters with at least one delinquency ticked back to 33.0 percent. By December 2020, meanwhile, credit card utilization had risen back to 39 percent. 36See: Ryan Sandler and Stefano Sciolli, “Credit card use is still declining compared to pre-pandemic levels,” July 2021. Available: https://www.consumerfinance.gov/about-us/blog/credit-card-use-still-declining-compared-to- pre-pandemic-levels/ and Ryan Sandler, “Delinquencies on credit accounts continue to be low despite the pandemic,” June 2021. Available: https://www.consumerfinance.gov/about-us/blog/delinquencies-on-credit- accounts-continue-to-be-low-despite-the-pandemic/. 16 CONSUMER FINANCIAL PROTECTION BUREAU
FIGURE 6: RATE OF DELINQUENCY BY HOUSING STATUS FROM JUNE 2018 TO JUNE 2021 37                        36F

Both figures dipped again following the arrival of secondary stimulus payments in December
2020 and continued to decline through the early months of 2021 with additional stimulus, tax
refunds, and unemployment benefits. By April 2021, the percentage of renters with a credit
delinquency was down to 28 percent. Credit card utilization, meanwhile, fell back to 30.8
percent among renters.

37   We define delinquency as those who had at least one delinquent account in their credit record.

17       CONSUMER FINANCIAL PROTECTION BUREAU
FIGURE 7: CREDIT CARD UTILIZATION BY HOUSING STATUS FROM JUNE 2018 TO JUNE 2021

Changes in utilization could be a function of changes in credit card limits or changes in credit
card debt. Figure 8 shows that while credit card debt fell for both renters and homeowners at the
beginning of the pandemic, only renters saw their debt levels rebound to pre-pandemic levels
after the summer of 2020. 38  37F

38Mortgagors and other homeowners had greater overall credit card balances, so percentage change from the pre-
 pandemic period gives a better representation of relative differences in how credit card debt moved over time.

18   CONSUMER FINANCIAL PROTECTION BUREAU
FIGURE 8: CREDIT CARD DEBT BY HOUSING STATUS, PERCENT CHANGE RELATIVE TO DECEMBER 2019

3.2.1 Renter subgroups during the pandemic
We also explore the trend of credit outcomes for the renter subgroups who were recipients of
certain pandemic supports (as discussed in earlier sections of this report). Across all of the
subgroups we focus on, average credit score trended upwards. Renters with student loans saw
an increase of more than 40 points between December 2019 and March 2021. This increase may
be partly explained by federal student loan forbearance throughout the pandemic, which
required servicers to treat any suspended federal student loan as if it were a regularly scheduled
payment made by the borrower. This requirement caused many delinquent student loan
tradelines to be reported as current. Renters with children, meanwhile, saw a credit score
increase of more than 25 points and renters earning less than $40,000 experienced an increase
of more than 18 points.

19   CONSUMER FINANCIAL PROTECTION BUREAU
FIGURE 9: CREDIT SCORE BY RENTER SUBGROUP

Delinquency rates also saw favorable improvements across these subgroups between the onset
of the pandemic and April 2021 (Figure 10). Delinquencies among renters with student loans
rebounded after an initial dip, which may indicate that a decline in delinquency brought on by
student loan forbearance was offset by increases in delinquency in other forms of credit.

The decline in delinquency among renters with children was considerable. 39 The percentage of 38F

this group with at least one delinquency dropped from 42.1 percent in December 2019 to 34.4
percent in April 2021. Renters with children were particularly vulnerable throughout the
pandemic – closure of schools and day-care centers left many parents having to choose between
employment and taking care of their children. 40 Our findings suggest that this group, in
                                                           39F

particular, may have benefitted from federal pandemic policies.41

Similar to renters with student loans, renters with annual incomes under $40,000 experienced
an increase in delinquencies after June 2020, when the additional unemployment benefits

39   As stated above, the subgroups are dependent on characteristics fixed in June 2019 before the pandemic.
40    Misty L. Heggeness and Jason M. Fields, “Parents juggle work and child care during the pandemic,” U.S. Census
     Bureau, August 18, 2020. Available: https://www.census.gov/library/stories/2020/08/parents-juggle-work-and-
     child-care-during-pandemic.html.
41   The decline in delinquency for renters with children appears to be larger than the decline for those without, though
     our sample size prevents us from drawing a firm conclusion on this point for changes between December 2019 and
     April 2021.

20        CONSUMER FINANCIAL PROTECTION BUREAU
lapsed. The subsequent decline in delinquencies among this group following the additional stimulus checks and resumption of expanded unemployment benefits may indicate that this group was particularly sensitive to these policies. FIGURE 10: RATE OF DELINQUENCY BY RENTER SUBGROUP Figure 11 shows that, though each subgroup saw an overall decrease in credit card utilization during the pandemic, utilization was more volatile for renters with children and renters with student loans. These groups saw large increases and decreases from month-to-month, likely indicating large payments being made on these groups’ credit cards before incurring additional balances. Some of this volatility may have to do with the smaller sample size available for these groups, making these measures more sensitive to large changes for a minority of members of the subgroup. 21 CONSUMER FINANCIAL PROTECTION BUREAU
FIGURE 11: CREDIT CARD UTILIZATION BY RENTER SUBGROUP

22   CONSUMER FINANCIAL PROTECTION BUREAU
4. Looking ahead
As of spring 2021, renters’ finances appear to have been in a stronger position than they were
before the pandemic. Labor market metrics were improving, 42 which may have improved
                                                                       40 F

financial situations for the disproportionate share of renters who became unemployed. And
rent-specific assistance that has been slow in coming 43 may arrive in time to replace many of the
                                                              41F

benefits that are expiring.

Even so, several factors indicate potential precarity ahead. Despite improvements relative to the
early pandemic, financial conditions for many renters are still tenuous relative to those of
owners. Renters’ finances are more sensitive to public policy interventions than those of
homeowners, and pandemic-related supports that may have helped renters are slowly going
away: The CDC’s eviction moratorium, which directly targeted renters, expired. It was
temporarily replaced with a less extensive ban, 44 which has also since been negated. 45 Student
                                                       42F                                         43F

loan forbearance is currently scheduled to end in January 2022, affecting the many renters who
have student debt. And the provision of additional unemployment benefits, which likely helped
a disproportionate share of renters stay on track during the pandemic, has recently ended.

Without these interventions, many renters may have experienced more financial difficulty than
they did during the pandemic. As pandemic-related recovery continues and these programs
phase out, our results suggest that renters’ finances may begin to deteriorate as they did after
the cessation of previous pandemic policy interventions. They also suggest that, while the
financial status of renters may be sensitive to the recent or upcoming termination of various
supports, they may also respond favorably to the availability of new assistance from Child Tax
Credits and rental assistance.

42Josh Mitchell, “US Added 850,000 Jobs in June Labor Rebound”, Wall Street Journal, July 2, 2021. Available:
 https://www.wsj.com/articles/june-jobs-report-unemployment-rate-2021-11625176511?mg=prod/com-wsj.
43Annie Nova, “Just a sliver of assistance has reached renters”, CNBC, July 13, 2021. Available:
 https://www.cnbc.com/2021/07/13/eviction-ban-about-to-expire-little-assistance-reaches-renters-.html.
44In August 2021, the CDC announced an extension of the moratorium in specific counties with heightened levels of
 transmission and expires on October 3, 2021.
45Alabama Association of Realtors, et.al v. Department of Health and Human Services, et.al., 594 U.S., 2021 WL
 3783142 (August 26, 2021).

23   CONSUMER FINANCIAL PROTECTION BUREAU
APPENDIX A: COMPARISONS TO OTHER DATASETS
Tables A.2 and A.3 compare statistics from the Wave 1 survey to publicly reported estimates
from similar questions in the American Housing Survey (AHS) and the U.S. Census Bureau’s
American Community Survey (ACS). An important thing to note is the Making Ends Meet
(MEM) survey is weighted to be representative of the CCP, which does not include people
without a credit record. The results from the MEM survey may differ based on the target
population as well as differences in the underlying questions used to collect the data.
In the MEM sample, renters consisted of about 27 percent of respondents and owners (both
those that were actively paying a mortgage as well as those that were not) made up about 68
percent. Approximately 5 percent indicated that they were neither renters nor owners. The AHS
(2019) had a breakdown of 36 percent renter households and 64 percent owner households.
Owners made up about two-thirds of the population in both surveys and renters approximately
one-third. In the MEM sample, the relatively higher proportion of owners may be due to sample
population differences. The AHS sample is selected to represent all housing units in the United
States ,46 and the ACS is representative of U.S. households ,47 while the MEM sample is
4F 45F
representative of the CCP.
TABLE A.1: RENTERS AND OWNERS IN MAKING ENDS MEET AND THE AMERICAN HOUSING SURVEY
MEM AHS
Renter or Owner
(percent) (percent)
Renter 27 36
Owner 68 64
Neither renter nor
5 -
owner
The group of people who are neither renters nor owners likely consists of those with no personal
housing costs, such as individuals whose rent is paid for by relatives or others, or individuals
who live with family members who bear their housing costs. Because this group is a relatively
small percentage of our sample, and because this report focuses on those who do face housing
costs, we omit this group from our analyses throughout this report.
46American Housing Survey, “Methodology.” Available: https://www.census.gov/programs-
surveys/ahs/about/methodology.html.
47U.S. Census Bureau, “About the American Community Survey.” Available: https://www.census.gov/programs-
surveys/acs/about.html.
24 CONSUMER FINANCIAL PROTECTION BUREAUThe tables highlight differences in race and ethnicity for renters and owners in MEM, ACS, and AHS. The race and ethnicity categories used across these surveys are different, and therefore may not represent an exact benchmark, but provides general insight into comparability. Table A.2 shows that the share of Non-Hispanic White renters was consistent in the MEM, ACS, and AHS surveys, at around 50 percent. Across all three surveys, Black renters represented around 20 to 25 percent of renters. About 15 to 20 percent of the renter samples were Hispanic in all the surveys, about five percent were Asian, and three to seven percent fell into the “Other” race and ethnicity category. 25 CONSUMER FINANCIAL PROTECTION BUREAU
TABLE A.2:        DEMOGRAPHIC COMPARISONS BETWEEN RENTERS IN MAKING ENDS MEET AND OTHER
                  SURVEYS (PERCENT)

                                       MEM                ACS 48   46F          AHS 49 47F

 Renters across samples
                                     (percent)          (percent)             (percent)

 Race and Ethnicity 50     48F           -                   -                    -

 Non-Hispanic White                     53                  50                    49
 Black                                  25                  19                    22
 Hispanic                               15                  19                    19
 Asian                                  4                   5                     6
 Other 51
      49F                               3                   7                     4
 Age                                     -                   -                     -

 Less than 35 years old                 36                  34                    33

 35-44 years old                        23                  20                    20
 45-54 years old                        16                  16                    16
 55-64 years old                        14                  14                    15
 65-74 years old                        7                   9                     9
 75 years and older                     4                   8                     7
 Income 52  50F                          -                   -           -
 $15,000 or less                        17                  18                    21
 $15,001 to $20,000                     12                  6                     6
 $20,001 to $40,000                     28                 18 53
                                                             51F                  23

 $40,001 to $100,000                    35                 43 54
                                                             52F                  37

 More than $100,000                      8                  16                    15

 Educational attainment          -                           -                    -

 Less than high school degree            5                  14                    15
 High school degree                     25                  27                    31

 Some college, technical, or
                                        39                  32                    26
 associate’s degree 55
                     53F

 Bachelor’s degree or higher            32                  28                    28

Across all three surveys, the race and ethnicity breakdowns for owners were consistent among
each respective group. In Table A.3, for example, Non-Hispanic White individuals made up
about 75 percent of owners in MEM and ACS, and housing units in the AHS. Black and Hispanic
individuals comprised about 10 percent of owners, five percent of owners were Asian, and three
percent were classified as “Other” race and ethnicity.

26   CONSUMER FINANCIAL PROTECTION BUREAU
48 2019 ACS 1-Year Estimates Subject Table S2502, Available:
https://data.census.gov/cedsci/table?q=homeownership&tid=ACSST1Y2019.S2502&hidePreview=false.
49 2019 AHS National Household Demographics by Tenure, Available: https://www.census.gov/programs-
surveys/ahs/data/interactive/ahstablecreator.html?s_areas=00000&s_year=2019&s_tablename=TABLE8A&s_by
group1=2&s_bygroup2=1&s_filtergroup1=1&s_filtergroup2=1
50 In the MEM Survey, race and ethnicity are defined as follows: if a respondent self-identifies as “Black or African
American”, she is included in the Black or African American category regardless of other responses. If the
respondent self-identifies as “Hispanic”, she is included in the Hispanic category unless she self-identifies as Black
or African American. The “Non-Hispanic White” group includes respondents who only selected the White category.
“Asian” includes respondents who selected Asian, but not Black or Hispanic. “Other” include respondents who did
not answer the question and Native American and Pacific Islanders.
51 Includes respondents who did not answer the question, American Indian/Alaskan Natives, and Native Hawaiians
and Other Pacific Islanders.
52 The income breakdowns in this table are adjusted to match the AHS and ACS.
53 In the ACS, this number represents the proportion of renters in the $20,000-$34,999 income range.
54 In the ACS, this number represents the proportion of renters in the $35,000-$99,999 income range.
55 In order to for the educational attainment breakdowns to match how they are presented in the ACS, we combined
individuals with (1) some college and no degree, (2) a technical/vocational degree, or (3) a two-year college degree
in this group.
27 CONSUMER FINANCIAL PROTECTION BUREAUTABLE A.3: DEMOGRAPHIC COMPARISONS BETWEEN OWNERS IN MAKING ENDS MEET AND OTHER
SURVEYS (PERCENT)
MEM ACS AHS
Owners across samples
(percent) (percent) (percent)
Race and Ethnicity - - -
Non-Hispanic White 72 74 73
Black 10 8 10
Hispanic 10 10 10
Asian 5 5 5
Other 3 3 2
Age - - -
Less than 35 years old 16 10 10
35-44 years old 20 16 16
45-54 years old 22 19 19
55-64 years old 20 23 23
65-74 years old 12 19 19
75 years and older 9 14 14
Income - - -
$15,000 or less 3 6 8
$15,001 to $20,000 3 3 3
$20,001 to $40,000 13 10 56
54F 14
$40,001 to $100,000 48 42 57
5F 38
More than $100,000 33 40 37
Educational attainment - - -
Less than high school degree 5 7 8
High school degree 25 23 27
Some college, technical, or
39 30 25
associate’s degree
Bachelor’s degree or higher 32 40 40
We then explore the age distribution between renters and owners. This distribution among
renters is generally consistent between MEM, ACS, and AHS, as shown in Table A.2. Conversely,
owners in the MEM survey tend to be younger than those in the ACS and AHS. Some of the age
discrepancies are due to differences in categorization. For example, the youngest categorical
group in MEM are those aged 18 to 24, while the corresponding ACS and AHS tables can include
individuals or housing units with owners younger than that. Such differences in categorization
make true comparisons difficult.
Tables A.2 and A.3 show the income distribution between renters and owners in all three
surveys. The proportion of renters with higher incomes, specifically those above $100,000, was
56 In the ACS, this number represents the proportion of renters in the $20,000-$34,999 income range.
57 In the ACS, this number represents the proportion of renters in the $35,000-$99,999 income range.
28 CONSUMER FINANCIAL PROTECTION BUREAUabout double in the ACS and AHS compared to MEM. Only eight percent of renters in MEM had
incomes in the highest tier compared to that of the other surveys (16 percent). The income
distribution among owners was generally similar across most of the income ranges, aside from
the $40,001 to $100,000 population, which made up of 48 percent of owners in MEM but only
38 percent of owners in AHS and 42 percent in ACS. One thing to note is that the ACS and AHS
have slightly different income ranges than MEM, therefore, direct comparisons of income are
not possible for all categories. Additionally, the definition of household income varies slightly
between the three surveys. In AHS, household income is the sum of income of all people 16 years
and older living in the household and can include family members and all unrelated people such
as lodgers, foster children, etc. 58 In the ACS, it includes the income of the main householder and
56F
all other individuals 15 years old and over, whether they are related to the householder or not. 59 57F
The MEM survey defines household entity differently, only including the survey respondent and
anyone they “share [their] finances with”, and could explain the differences between the three
surveys. We believe these figures, however, still provide some insight on the comparability
between the respondents.
The renters in the MEM sample had slightly higher educational attainment than in the ACS and
AHS, while owners had slightly lower educational attainment, particularly among Bachelor’s
degree recipients and higher. For example, only five percent of the renter sample in MEM had
less than a high school degree versus more than 14-15 percent in ACS and AHS, respectively,
with a similar pattern existing among owners in both groups. This difference may be due to the
sample population differences. “Credit invisibles”—people who do not have a credit record—
tend to live in areas with lower incomes. 60 They may also be less well educated than average.
58F
Also of note, the ACS educational attainment measures only represent those aged 25 or older,
which could account for some of the differences.
58The AHS defines sources of income as “wages and salaries, self-employment, interest, dividends, rental income,
social security or railroad retirement, retirement or survivor pensions, Supplementary Security Income (SSI), child
support or alimony, public assistance or public welfare, food stamp benefits, disability payments, workers'
compensation, veterans' disability, other disability, and other income (VA payments, unemployment, royalty,
estates, and more.)”. For more information, visit 2019 American Housing Survey Definitions,
https://www2.census.gov/programs-surveys/ahs/2019/2019%20AHS%20Definitions.pdf.
59U.S. Census Bureau, “Median Household Income.” Available:
https://www.census.gov/quickfacts/fact/note/US/INC110219.
60Kenneth P. Brevoort, and Philipp Grimm, and Michelle Kambara, 2015, “Data Point: Credit Invisibles” CFPB Office
of Research, May 2015. Available: https://files.consumerfinance.gov/f/201505_cfpb_data-point-credit-
invisibles.pdf.
29 CONSUMER FINANCIAL PROTECTION BUREAUAPPENDIX B: DEBT BALANCES BY HOUSING STATUS Renters and mortgagors held different amounts of each type of debt. Figure B.1 shows that mortgagors had an average of $9,000 in auto loan debt and renters had almost $6,000. Credit card debt followed a similar pattern: Mortgagors held an average of about $8,000 and renters held about $3,000. Renters, however, did have higher student loan debt balances than to mortgagors, almost $10,000 compared to $7,000 for mortgagors and $3,000 for owners without a mortgage. FIGURE B.1: DEBT BALANCES AMONG RENTERS, MORTGAGORS, AND OTHER HOMEOWNERS 61 59F 61 The black bars in these graphs represent a 95 percent confidence interval. 30 CONSUMER FINANCIAL PROTECTION BUREAU
You can also read