2020 Full Year Results - Business Update

Page created by Rita Conner
 
CONTINUE READING
2020 Full Year Results - Business Update
Full Year Results

2020
Business Update

 March/April 2021
2020 Full Year Results - Business Update
Disclaimer
This presentation contains forward-looking statements and information relating to Befesa and its affiliates that are based on the beliefs of its management, including
assumptions, opinions and views of Befesa and its affiliates as well as information cited from third party sources. Such statements reflect the current views of Befesa and
its affiliates or of such third parties with respect to future events and are subject to risks, uncertainties and assumptions.

Many factors could cause the actual results, performance or achievements of Befesa and its affiliates to be materially different from any future results, performance or
achievements that may be expressed or implied by such forward-looking statements, including, among others: changes in general economic, political, governmental and
business conditions globally and in the countries in which Befesa and its affiliates do business; changes in interest rates; changes in inflation rates; changes in prices;
changes to national and international laws and policies that support industrial waste recycling; legal challenges to regulations, subsidies and incentives that support
industrial waste recycling; extensive governmental regulation in a number of different jurisdictions, including stringent environmental regulation; management of exposure
to credit, interest rate, exchange rate and commodity price risks; acquisitions or investments in joint ventures with third parties; inability to obtain new sites and expand
existing ones; failure to maintain safe work environments; effects of catastrophes, natural disasters, adverse weather conditions, unexpected geological or other physical
conditions, or criminal or terrorist acts at one or more of our plants; insufficient insurance coverage and increases in insurance cost; loss of senior management and key
personnel; unauthorised use of Befesa’s intellectual property and claims of infringement by Befesa of others’ intellectual property; Befesa’s ability to generate cash to
service its indebtedness changes in business strategy and various other factors. Should one or more of these risks or uncertainties materialise, or should underlying
assumptions prove incorrect, actual results may vary materially from those described herein as anticipated, believed, estimated, expected or targeted.

Befesa and its affiliates do not assume any guarantee that the assumptions underlying forward-looking statements are free of errors nor do they accept any responsibility
for the future accuracy of the opinions expressed herein or the actual occurrence of the forecasted developments. No representation (express or implied) is made as to,
and no reliance should be placed on, any information, including projections, estimates, targets and opinions, contained herein, and no liability whatsoever is accepted as
to any errors, omissions or misstatements contained herein or otherwise resulting, directly or indirectly, from the use of this document.

This presentation is intended for information only and should not be treated as investment advice. It is not intended as an offer for sale, or as a solicitation of an offer to
purchase or subscribe to, any securities in any jurisdiction. Neither this presentation nor anything contained therein shall form the basis of, or be relied upon in connection
with, any commitment or contract whatsoever. This presentation may not, at any time, be reproduced, distributed or published (in whole or in part) without prior written
consent of Befesa.

Full year figures contained in this presentation have been audited by external auditors.

This presentation includes Alternative Performance Measures (APM), including EBITDA, EBITDA margin, EBIT, EBIT margin, net debt and capital expenditures which are
not measures of liquidity or financial performance under International Financial Reporting Standards (IFRS). EBITDA is defined as operating profit for the period (i.e. EBIT)
before the impact of amortisation, depreciation, impairment and provisions. EBITDA margin is defined as EBITDA divided by revenue. EBIT is defined as Operating profit
for the year. The Company uses EBIT to monitor its financial return after both operating expenses and a charge representing the cost of usage of both its property, plant
and equipment and definite-life intangible assets. EBIT margin is defined as EBIT as a percentage of revenue. These non-IFRS measures should not be considered in
isolation or as an alternative to results from operating activities, cash flow from operating, investing or financing activities, or other financial measures of Befesa’s results of
operations or liquidity derived in accordance with IFRS. Befesa believes that the APM included in this report are useful measures of its performance and liquidity. Other
companies, including those in the industry in which Befesa operates, may calculate similarly titled financial measures differently than Befesa does. Because all companies
do not calculate these financial measures in the same manner, Befesa’s presentation of such financial measures may not be comparable to other similarly titled measures
of other companies. These APM are not audited.

2     Business Update – Full Year 2020 Results
2020 Full Year Results - Business Update
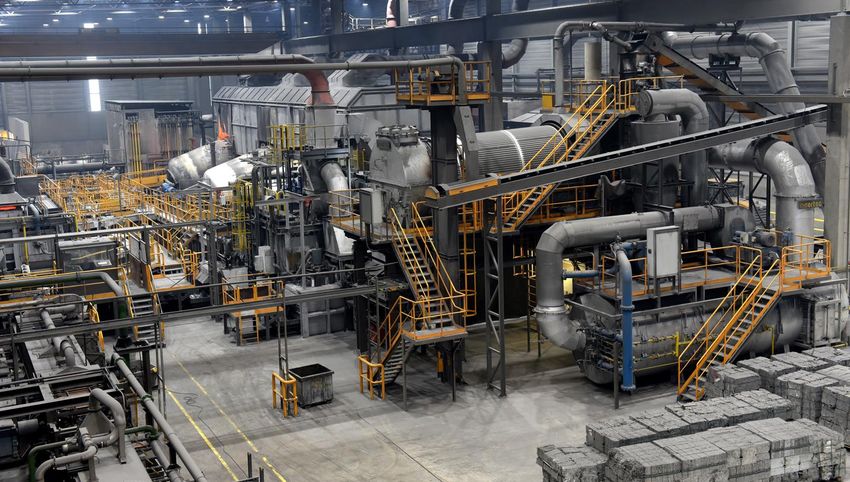
EAFD recycling plant at Asúa-Erandio, Spain

01   Business update
2020 Full Year Results - Business Update
Executive summary
€42.4m                                                                           €127.0m                                         €47.6m
Q4 EBITDA               adjusted1)                                               FY EBITDA        adjusted1)                     Net profit
strongest quarter in 2020,                                                       upper third of €100-€135m guidance,             down from €82.7m in 2019,
same level as Q4 2019 at €42.5m                                                  -€33m / -20% yoy                                corresponding to a €1.40 EPS

•       Continued QoQ recovery                                                   •    Predominantly driven by                    Proposing €30-€40m dividend in 2021
        Q1 €33.6                                                                      lower zinc price and unfavourable          (€0.88-€1.17 / share):
        Q2 €21.7 (COVID-19 induced low)                                               higher treatment charges (TC)
        Q3 €29.3                                                                                                                 • upper-end 50% of 2020 net profit +
        Q4 €42.4                                                                 •    Resilient volumes yoy:                       catch-up on lower dividend in ‘20 for ’19
                                                                                      +3% EAFD (Turkey expansion);
•       Improved plant utilisation:                                                   -10% Salt Slags & SPL                      • around 2% dividend yield vs. €51.70
        89% Steel Dust;                                                                                                            YE’20 closing price
        84% Salt Slags & SPL

€92.5m                                                                                                         China expansion
Operating cash flow                                                                                            Construction on track and on budget:
down 10% yoy (2019: €102.5m)
                                                                                                               •   Jiangsu: Construction expected to be completed in Q1;
€154.6m of cash, up €29m yoy, after funding China                                                                           Commissioning in Mar/Apr
and a total dividend of €25m (€0.73 / share)
distributed in 2020 equal to 30% of FY 2019’s net profit                                                       •   Henan:    After the summer

>2.5 years                                                                                                     ESG
Hedge book extended to Jan 2024, >2.5 years,                                                                   •   Lost Time Injury Rate reduced by 54% yoy to 1.26
providing increased earnings and cash flow visibility
                                                                                                               •   Befesa as a vital player within circular economy
                                                                                                                   with strong ESG ratings
1)   Adjusted for €3.5m for the UK Salt Slags plant closure, as mentioned in the Q2 2020 Filing

4         Business Update – Full Year 2020 Results
2020 Full Year Results - Business Update
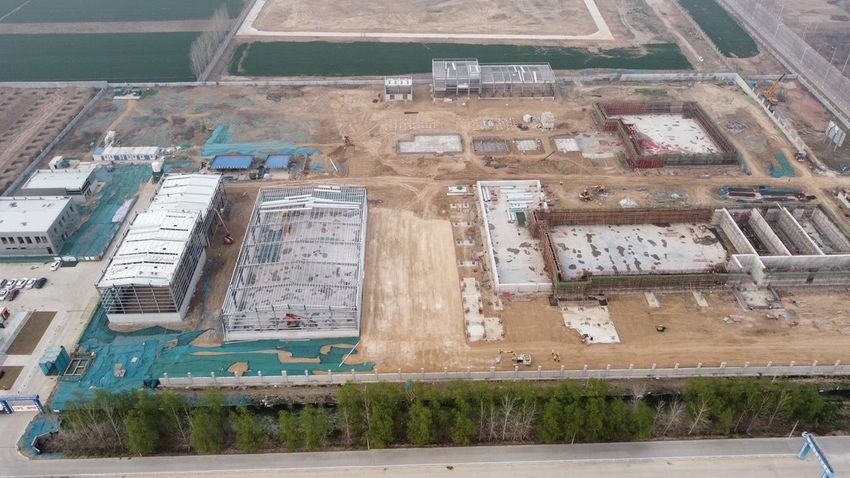
Mid-term growth roadmap
Executing well defined growth roadmap even during COVID-19;
Focus 2021: Ramping up operations at the first two EAFD recycling plants in China

                                                                                                                                                               1   HEDGING
                                                                                                                                                                   •   2020: 92.4kt @ €2,239/t
                                                                                                                                                                   •   2021: 92.4kt @ c. €2,150/t
                                                                                                                                                                   •   2022: 92.4kt @ c. €2,200/t
                                                                                                                                                                   •   Up to Q4 2023: 73.8kt @ c. €2,300/t
Indicative earnings

                                                                                                                                           3
                                                                                                                                                               2   ORGANIC GROWTH
                                                                                                                                     2021+                         Top 5 projects:
                                                                                                          2
                                                                                                                                                                   • Steel Dust:
                                                                         1
                                                                                                                                                                          Turkey expansion: Completed
                                                                                                         2021/22
                                                                                                                                                                          Korea washing: Completed
                                                                                                                                                                   •   Aluminium Salt Slags:
                                                                                        Managing Variability                                                              2 tilting furnaces (Spain): Completed
                           €160m

                                                                                                                                                               3   CHINA
                                                                                                                                                                   Building first two EAFD recycling plants
 FY'19 Actual /                                           Hedging                          Organic                           China                  Mid-term
                                                                                                                                                                   in two provinces (Jiangsu and Henan)
FY'20 normalised 1)                                                                        growth                                                   business
    EBITDA                                                                                                                                            plan

                      Note: Chart is illustrative and size of respective arrows in the chart is not indicative to the underlying growth potential

                      1) FY 2020 normalised for a) Zinc LME @$2,500/t (long-term consensus), and b) TC @$225/t (~9% $2,500/t LME)

5                        Business Update – Full Year 2020 Results
2020 Full Year Results - Business Update
Zinc prices and hedging strategy
Hedges extended to Q4 2023; Improved earnings & cash flows visibility

Market zinc price vs. zinc hedges (€/t)
         € 3,500
                                                                                                                                                   LME zinc                 Forwards               Average blended

                               €2,317

         € 2,500                                                                                                                                                                                    c. €2,300
                                                                          €2,239                                         c. €2,150                                 c. €2,200
                               €2,280
                                                                          €2,136

         € 1,500
                                      2019                                     2020                                      2021                                     2022                                2023
           Hedging price (€/t)       €2,317                                    €2,239                                   c. €2,150                               c. €2,200                            c. €2,300
 Zinc content hedged (kt)               92.4                                    92.4                                      92.4                                     92.4                               73.81)

           € 500

Source: London Metal Exchange (LME) zinc daily cash settlement prices; Company information

Zinc hedges & blended average prices (€/t)
                                               2019                                2020
                                                                                                                    Hedging strategy unchanged:
        Unhedged                         26% or 33kt                         33% or 46kt
                                        @ €2,276/t LME                      @ €1,979/t LME                          •    Hedges in place until and incl. Q4 2023 (>2.5 years)
                                                                                                                    •    Targeting 60% to 75% of zinc equivalent volume
        Hedged                            74% or 92kt                          67% or 92kt
                                          @ €2,317/t                           @ €2,239/t                           •    Majority of hedges Euro based
                                                                                                                    •    Befesa providing no collateral
        Blended2)                              €2,280                             €2,136
                                                                          -€144/t / -6% yoy
1)   As of 31 December 2020, 30.6 kt of zinc equivalent were hedged for 2023 at c. €2,300/t; Subsequently, in Q1 2021, additional 43.2 kt of zinc equivalent were hedged for 2023 at c. €2,300/t
2)   Zinc blended prices are annual averages computed based on the monthly effective LME zinc and hedging prices weighted with the respective hedged and non-hedged volumes

6         Business Update – Full Year 2020 Results
2020 Full Year Results - Business Update
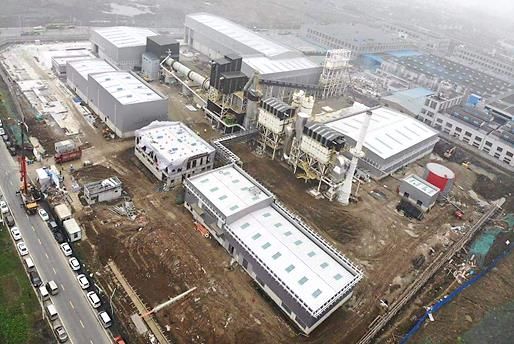
EAF steel production -&-
       Befesa’s steel portfolio growth & diversification
       China is the largest and growing EAF steel producer worldwide …
       … Befesa growing and diversifying its portfolio to capture China addressable market

             EAF steel production: EU-27 vs. China (Mt)                                                      Befesa’s EAFD recycling capacity trend (kt)

                                                                                                                                    BEFESA
                                                                                                                                                                                   Further
                                                                                                                                                                                   China
                                                                                                                                                                                   expansion

                                                                                                               Capacity additions
                                                                                                                                                                          1,045
Study by IEA-OECD Oct ´20:                                                                    103
-Primary Steel consumes 7x more CO²/t vs. Secondary                                                                                                     825     +220
-Europe to Grow to 50% EAF and China 40% by 2050                                                                                    670      +155              China
         65                    65                                                                               495                                            plants
                                                                                                                         +175              +45 Turkey
                                                                            47                                                                                 (Jiangsu
                                                                                                                                           +110 Korea
                                                                                                                       +65 Turkey                              & Henan)
                                                                                                                       +110 Korea

        2015                  2019                                         2015               2019              2009                2015                2019              2021 E

   EAF share:
                                                                                                     EAFD recycling capacity by region (%):
       39%                    41%                                           6%                10%    Europe2) 100%                  74%                 60%                47%
                                                                                                      ROW 3)    -                   26%                 40%                53%

         •    China EAFD addressable market >1.5 Mt1) -vs.-                                           •   Befesa Steel portfolio growing @~6% CAGR (~twice GDP)
              ~1.2 Mt1) EU-27; Expected to grow in share and tonnage                                      while diversifying to ~50/50 Europe / ROW

        Source: worldsteel; Company data
        1) Assuming 15kg to 20kg EAF dust generated per tonne of EAF crude steel output
        2) Europe defined as EU-27
        3) Rest of World incl. Turkey, Korea as well as servicing South East Asia and China

        7      Business Update – Full Year 2020 Results
2020 Full Year Results - Business Update
China I
Changzhou plant, Jiangsu province

Key facts of the plant:
•   1st EAFD recycling plant in China
•   Capacity to recycle 110kt EAFD p.a.
•   Total investment: c. €42m
•   Location: Changzhou (Jiangsu province)

Status update:
    Cold and hot commissioning planned for
    Mar/Apr
    Long-term financing closed July 2020

                                                Changzhou construction site, mid-March 2021

8    Business Update – Full Year 2020 Results
2020 Full Year Results - Business Update
China II
Xuchang plant, Henan province

Key facts of the plant:
•   2nd EAFD recycling plant in China
•   Capacity to recycle 110kt EAFD p.a.
•   Total investment: c. €42m
•   Location: Xuchang (Henan province)

Status update:
    Foundation works / building structures
    progressing well; Completion expected
    after the summer of 2021
    Long-term financing closed December 2020

                                                Xuchang construction site, mid-March 2021

9    Business Update – Full Year 2020 Results
2020 Full Year Results - Business Update
Sustainability at Befesa
Key player within the circular economy, with c. 1.5 million tonnes recycled and c. 1.3 million tonnes of valuable
materials recovered annually, that contributes significantly to increase efficiency of raw material use in the metals
industry and promotes the transition towards a more sustainable economy

Lost Time Injury Rate (LTIR)                                           Ratings
• Excellence in health & safety is a priority for Befesa

• Aiming to reduce LTIR by at least 50% by 2024 vs. 2019
                                                                                    B                       14.8
                                                                              Top 3 of 205                 #3 of 60
           5.3                        -74.0%
                                                                             Metals & mining           Commercial services

                      3.6
                                 2.9            2.6
                                                      2.1
                                                             1.4
                                                                                #5 of 105                   BBB
                                                                            Business services          Commercial services
          2015       2016        2017       2018      2019   2020

Global Challenges Index (GCX)                                          2021 Sustainability Report
• Befesa selected on 18 Sep 2020                                         • Publishing Progress Report in April

• GCX comprises a total of 50 shares
  selected according to strict criteria from
  a total of c. 6,000 companies worldwide

10   Business Update – Full Year 2020 Results
Preliminary 2021 outlook
Volume / Capacity utilisation                                 Base metal prices
Continued recovery from COVID-19 and                          Expecting a positive yoy earnings contribution
incremental China volume in H2
•    Expecting to continue step-by-step recovery closer to    •   Expecting unfavourable TC trend from 2019 to 2020 to
     pre-COVID utilisation levels in both core businesses         reverse towards a favourable 2020 to 2021 contribution

•    New China EAFD recycling plants to deliver               •   Hedged prices on 92kt zinc volume for 2021 slightly
     incremental volume in H2                                     down by c. €90/t resulting in c. -€8m EBITDA headwind

                                                              •   LME zinc and aluminium alloy market prices with a
                                                                  strong start to the year

Capex                                                         Dividend & leverage
Continuing to fund China expansion                            Proposing €30-€40m (€0.88-€1.17 / share)
                                                              dividend distribution in 2021, equal to:
•    Planning for regular c. €25-30m maintenance / IT /       •   Upper-end 50% of 2020 net profit +
     compliance / operational excellence investments              catch-up on lower distribution in ‘20 for ’19
                                                                  (total of c. 60% to 85% of €47.6m net profit in 2020)
•    Growth capex c. €50-60m with continued focus on China,
     majority funded through China local loans                •   Around 2% dividend yield vs. €51.70 YE’20 closing price

                                                              Targeting leverage below x3; expecting to
                                                              improve to pre-COVID level of c. x2.6 in 2019

Full year guidance with publication of Q1 results (27 April 2021)

11    Business Update – Full Year 2020 Results
Nanjing City, Location of Befesa China’s HQ

02   Preliminary full year 2020
     results
Consolidated key financials
FY EBITDA adjusted €127m1), at upper third of €100 to €135m guidance range;
Unfavourable zinc LME prices and treatment charge (TC) partially offset by favourable zinc hedges

EBITDA bridge FY 2019 to 2020 (€m)
                                                                                              -€32.6 / -20.4%

                                                    159.6
                                                                        -0.6
                                                              +4 EAFD throughput                    -32.5
                                                              -1 Stainless                                                                      127.0 1)
                                                              -3.5 Salt slags & SPL                                          0.5
                                                                                      -45    Zinc LME                    Op’l excellence
                                                                                      +24    Favourable hedges vs. LME   Inflation
                                                                                      -12    Unfavourable TC             FX
                                                                                      +0.6   Alu alloy FMB               Other

                                             EBITDA 2019              Volume                        Price                Cost / other      Adj. EBITDA 2020

Key metrics (€m, unless otherwise stated)
                                                  FY 2019                                         yoy change                                    FY 2020

Revenue                                            €647.9                                        -€43.6 / -6.7%                                  €604.3
EBITDA                                             €159.6                                       -€32.6 / -20.4%                                 €127.01)
EBITDA margin                                      24.6%                                            -363 bps                                     21.0%

Net profit                                          €82.7                                       -€35.1 / -42.4%                                  €47.6
EPS (€)                                             €2.43                                       -€1.03 / -42.4%                                  €1.40

Operating cash flow                                €102.5                                       -€10.0 / -9.7%                                    €92.5
Cash                                               €125.5                                      +€29.1 / +23.2%                                   €154.6
Net debt                                           €416.9                                       -€23.3 / -5.6%                                   €393.6
Net leverage                                        x2.61                                            +x0.5                                        x3.10
1)   Adjusted for €3.5m for the UK Salt Slags plant closure

13        Business Update – Full Year 2020 Results
Steel Dust Recycling Services
FY EBITDA at €98m; Resilient EAFD throughput amid COVID-19 and favourable zinc hedges
offset by lower zinc LME prices and unfavourable zinc TC

EBITDA bridge FY 2019 to 2020 (€m)

                                                                                                                        -€27.6 / -22.0%

                                                  125.3                                     2.9
                                                                               +4 EAFD (Turkey)                                   -33.1
                                                                               -1 Stainless                                                                                                         97.7
                                                                                                                                                                         2.6
                                                                                                             -45 Zinc LME                                           Op’l excellence
                                                                                                             +24 Favourable hedges vs. LME                          Inflation
                                                                                                             -12 Unfavourable TC                                    FX
                                                                                                                                                                    Other

                                             EBITDA 2019                                 Volume                                   Price                             Cost / other                 EBITDA 2020

Key metrics (€m, unless otherwise stated)
                                                 FY 2019                                                                      yoy change                                                            FY 2020

Revenue                                           €360.1                                                                   -€14.3 / -4.0%                                                           €345.8
EBITDA                                            €125.3                                                                  -€27.6 / -22.0%                                                            €97.7
EBITDA margin                                     34.8%                                                                       -654 bps                                                              28.3%

EAFD throughput (kt)                            665.8                                                                    +21.2 / +3.2%                                                              687.0
Plant utilisation                          80.7% / 90.1%1)                                                            +234 bps / -708 bps1)                                                         83.0%

Zinc LME price (€/t)                              €2,276                                                                   -€297 / -13.1%                                                           €1,979
Zinc hedging price (€/t)                          €2,317                                                                     -€78 / -3.4%                                                           €2,239
Zinc blended price2) (€/t)                        €2,280                                                                    -€144 / -6.3%                                                           €2,136
Treatment charge (TC) ($/t)                        $245                                                                    +$55 / +22.4%                                                             $300
1)   Installed capacity and corresponding utilisation rates in 2019 are normalised for the capacity upgrade in Turkey, from 65kt to 110kt (plant was shutdown from end of Jan to mid-Aug 2019)
2)   Blended rate between hedged prices and average spot prices, weighted by the respective hedged and non-hedged volumes, reflecting the effective price to Befesa

14        Business Update – Full Year 2020 Results
Alu Salt Slags Recycling Services
FY EBITDA adjusted at €29m; Reduced salt slags & SPL treated partially offset
by slightly improved FMB prices; Resilient 85% plant utilisation

EBITDA bridge FY 2019 to 2020 (€m)
                                                                                                                    -€4.2 / -12.7%

                                                33.0
                                                                                                                                                                                                                  2)
                                                                                       -3.5                                   0.6                                                                          28.8
                                                                                                                                                                     -1.3
                                                                              Salt slags & SPL                        Alu alloy FMB

                                         EBITDA 2019                                Volume                                   Price                             Cost / other                      Adj. EBITDA 2020

Key metrics (€m, unless otherwise stated)
                                             FY 2019                                                                     yoy change                                                                       FY 2020

Revenue1)                                     €292.4                                                                 -€30.3 / -10.4%                                                                       €262.1
• Salt Slags                                   €81.6                                                                 -€14.6 / -17.9%                                                                        €67.0
• 2nd Aluminium                               €245.2                                                                  -€21.3 / -8.7%                                                                       €223.9

EBITDA                                         €33.0                                                                  -€4.2 / -12.7%                                                                       €28.82)
• Salt Slags                                   €21.0                                                                  -€4.3 / -20.3%                                                                       €16.72)
• 2nd Aluminium                                €12.0                                                                  +€0.1 / +0.6%                                                                         €12.1
EBITDA margin (Salt Slags)                     25.7%                                                                     -752 bps                                                                          25.0%

Salt Slags & SPL treated (kt)                  492.6                                                                  -48.0 / -9.7%                                                                     444.6
Plant utilisation                              92.9%                                                               -929 bps / -600 bps                                                             83.7% / 86.9%3)

Alu alloys produced (kt)                    176.7                                                                     -2.3 / -1.3%                                                                         174.3
Plant utilisation                      86.2% / 91.1%4)                                                             -136 bps / -625 bps                                                                     84.8%

Alu alloy FMB price5) (€/t)                   €1,397                                                                   +€23 / +1.7%                                                                        €1,420
1) Total revenue is after intersegment eliminations (2019: €34.4m in 2019; 2020: €28.8m)         2) Adjusted for €3.5m for the UK Salt Slags plant closure
3) Installed capacity and corresponding utilisation rates in 2020 are normalised for the UK salt slags plant closure in Q4 2020
4) Installed capacity and corresponding utilisation rates in 2019 are normalised for the furnace upgrade at Les Franqueses del Vallès, Spain (plant was shutdown three months, from mid-August to mid-November)
5) Aluminium scrap and foundry ingots aluminium pressure diecasting ingot DIN226/A380 European Metal Bulletin free market duty paid delivered works

15    Business Update – Full Year 2020 Results
Cash flow, net debt & leverage
Strong €230m liquidity (€155m cash balance + €75m RCF entirely undrawn)
even after dividend distribution and funding China

Adjusted EBITDA to total cash flow (€m)

             127.0
                                      -0.8
                                                            -17.0
                                Rigorous WC
                                                                                   -16.6                   92.5
                                management
                                                                                                                                 -25.1

                                                                                                                                                        -28.8
                                                                                                                                                                                15.3         -24.9            29.1
                                                                                                                                                     Mainly China           China local
                                                                                                                                                                                           30% of 2019
                                                                                                                                                     expansion              loans
                                                                                                                                                                                           net profit

         Adjusted               WC change                Interests                Taxes               Operating            Maintenance                 Growth                Bank          Dividend      Total cash flow
       EBITDA 2020                                                                                    cash flow               capex 1)                 capex             borrowings &                         2020
                                                                                                                                                                          FX effects 2)
 1)   Includes investments required to maintain or replace assets as well as those related to productivity, compliance and IT, as well as non-material collections from financial assets
 2)   Includes cash bank inflows/outflows from bank borrowings and other liabilities, as well as the effect of foreign exchange rate changes on cash

                                                                      YE 2019                                                                yoy change                                                    YE 2020

 LTM EBITDA                                                            €159.6                                                            -€32.6 / -20.4%                                                    €127.0

 Operating cash flow                                                   €102.5                                                             -€10.0 / -9.7%                                                     €92.5

 Gross debt                                                            €542.4                                                             +€5.8 / +1.1%                                                     €548.2

 Cash on hand                                                          €125.5                                                           +€29.1 / +23.2%                                                     €154.6

 Net debt                                                              €416.9                                                             -€23.3 / -5.6%                                                    €393.6

 Net leverage                                                           x2.61                                                                     +x0.5                                                      x3.10

16        Business Update – Full Year 2020 Results
Secondary aluminium production plant at Bernburg, Germany

03   Befesa overview
Befesa at a glance
Market leader in Europe & Asia in providing regulated critical hazardous waste recycling services to the steel and
aluminium industries

       3-year average (2018-2020)                                                             Steel Dust Recycling                                          Aluminium Salt Slags Recycling

                           €657m
                               Revenue1)                                                                 #1                                                                     #1
                                                                                                   Position in Europe                                          Position in Europe in salt slags subsegment
                                                                                           (c. 45-50% market share) and Asia                                             (c. 45-50% market share)
            37%
        2nd Aluminium

                                                             52%
                                                            Steel Dust
                                                                                                      33%                                                                    27%
                                                                                                      EBITDA margin                                             EBITDA margin in salt slags subsegment2)
                      11%                                                                       (3-year average 2018-2020)                                           (3-year average 2018-2020)
                     Salt Slags

                           €154m
                                EBITDA                                                                >15yrs                                                              >15yrs
                  8%                                                                                   Relationships                                                         Relationships
             2nd Aluminium

         14%
        Salt Slags

                                                          78%
                                                         Steel Dust

Source: Company information, International Consulting Firm based on World Steel Association’s Steel Statistical Yearbooks, WBMS, industry research, expert Interviews.
1)   Excluding internal revenue; revenue split is calculated on revenues including internal revenue
2)   Including recycling of SPL (a hazardous waste generated in primary aluminium production)

18        Business Update – Full Year 2020 Results
Key milestones
      Befesa has grown successfully through organic initiatives and acquisitions
                                                                                                                                             EAFD expansion China
                                                                                                                                            Developing first two EAFD
                                                                                                EAFD expansion Korea & Turkey               recycling plants in China:
                                   Secondary aluminium plant in Bernburg                          Doubled capacity to 220 kt, Gyeongju            Changzhou, Jiangsu:
                                                                                                                                                  Completion of construction
                                                     Triton acquired Befesa
                                                                                                                                                  expected during Q1 2021
                                                                                                       1st WOX washing plant in Asia,
                         Entry in the Asian market2)                                                   close to Gyeongju plant
                                                                                                                                                  Xuchang, Henan:
                                                                                                       EAFD recycling capacity at                 Completion of construction
              WOX washing plant at Gravelines
                                                                                                       Iskenderun expanded to 110 kt              expected after summer ‘21
      Entry in the Turkish market1)

1987 1993 2000 2006                 2009           2010          2012      2013          2014   2015            2017          2018           2019         2020           2021

                                                                                                                                                         Since 18 Sep 2020,
                                              European leader in salt slags recycling,                                                                   member of
                                              acquiring Agor AG’s German assets

                                  Befesa acquired remaining stake in BUS,                                                            Entry to SDAX3)
                                  becoming European leader in EAFD recycling                                                         on 24 Sep 2018
                                                                                                                                                         Rated by:
                        Abengoa acquired Befesa from BUS

             Berzelius Umwelt Service (BUS) grouped their                                                              Successful IPO on
             Spanish assets into Berzeilius Felguera (Befesa)                                                          Frankfurt Stock Exchange

    Founded in Germany, Metallgesellschaft

      1) Through 51/49 JV with Canadian Silvermet
      2) By acquiring subsequent stakes in the Korean Hankook
      2) Free-float at 100% after Triton’s exit on 6 June 2019

      19      Business Update – Full Year 2020 Results
Investment highlights

      Environmental                                  Favourable                         Market                        Strong
        solutions                                    mega trends                        leader                      regulation
           in high demand                          supporting secondary steel          in Europe & Asia,            getting stricter and
          for the steel and                          and aluminium markets       in niche recycling markets,          expanding into
         aluminium industry                            e.g. CO2 reduction,          applying best available          new geographies
       improving sustainability                         emission controls            technology with plant      to protect the environment
                                                                                   footprint close to clients

     Robust & long-                                      Proven                     Expansion                     Experienced
      term service                                      resilience                 opportunities                     team
      supports business model                            through the cycle          organic & inorganic,         focused on compliance,
     with strong barriers to entry                 with strong growth, margins   focused on core segments       ESG and profitable growth
      and high captive demand                       and cash flow generation        with attractive returns        = shareholder value

20      Business Update – Full Year 2020 Results
Market leader in Europe & Asia
                        Befesa is the market leader in steel dust and salt slags recycling services with a competitive advantage
                        due to its close-proximity to key clients
                                                                                                                                                                                          EAFD recycling plants

                                       Lünen                                                                                                                                              Salt slags & SPL recycling plants

                                                                        Hannover                                                                                                          Clients
                        Duisburg

                                                                             Freiberg                                                                                                                   Jiangsu & Henan2)
Fouquières
-lès-Lens1)
Asúa-Erandio
                                                                                           Iskenderun
                                                                                                                                                                                                                                       Gyeongju

Valladolid

                             Note: Footprint reflects only Befesa’s core recycling services – Steel Dust and Salt Slags & SPL

                        Europe                                                                                                                                           Europe
 STEEL DUST RECYCLING

                                                                                                                                              ALU SALT SLAGS RECYCLING
                                                 Capacity in kt                   Market share in %                                                                                    Capacity in kt              Market share in %

                                     #2                                                                                                                                           #2

                                     #3                                                                                                                                           #3

                        Asia                     Capacity in kt                   Market share in %

                                     #2

                                     #3

                        1)   50/50 joint venture with Recylex
                        2)   Chinese plants under construction: Changzhou, Jiangsu, cold and hot commissioning completed in March/April 2021; Xuchang, Henan, completion of construction expected after the summer of 2021

                        21        Business Update – Full Year 2020 Results
Highly regulated & critical service model
Befesa is the leading environmental services partner in the circular economy of the 2 nd steel & aluminium industry by
recycling and avoiding the landfilling of c. 1.5 MT hazardous waste and recovering c. 1.3 MT of new valuable materials

                                               HAZARDOUS WASTE                         BEFESA RECYCLING                                OUTPUTS                                   FINAL USAGE

                                                                                                                                        234 kt                                   Filler materials
                                                                                                                                                                                  e.g. cement,
                                                   690 kt
                                                                                                                                       IRON OXIDE
                                                                                                                                                                                       roads
        EAF steelmakers /
            recyclers                               STEEL DUST                                                                          233 kt
         (mini-mills, scrap                                                                                                            WOX SOLD
            recyclers)
                                                            Service fee                                                               Sale of zinc in WOX                      Zinc smelters
                                                            c. 10-20%                                                                 c. 80-90%                             e.g. steel galvanization

                                               HAZARDOUS WASTE                         BEFESA RECYCLING                                OUTPUTS                                   FINAL USAGE

                                                                                                                                        305 kt                                  Filler materials
                                                                                                                                                                                e.g. ceramics,
                                                   485 kt
                                                                                                                                ALU OXIDE & OTHERS
                                                                                                                                                                               cement, rockwool
                                                    SALT SLAGS                                                                  157 kt + 39 kt
             Aluminium
                                                       & SPL                                                                     MELTING  ALU
             producers /
                                                                                                                                  SALT CONCENTRATE
              recyclers                                                                                                                                                     Aluminium recyclers
                                                            Service fee                                                              Sale of salt & alu conc.
                                                            c. 40%                                                                   c. 60%

All figures are the average of the fiscal years 2018, 2019 and 2020
Value chains are simplified and only reflect Befesa’s core business segments (i.e. Steel Dust; Aluminium Salt Slags):
- Within Steel Dust Recycling Services business segment Befesa manages a Stainless sub-segment (94 kt stainless steel dust throughput, average over L3Y period 2018-2020)
- Within Aluminium Salt Slags Recycling Services business segment Befesa manages a Secondary Aluminium sub-segment (173 kt 2nd aluminium alloys produced, average over L3Y period 2018-2020)

22      Business Update – Full Year 2020 Results
Experienced management team
 Senior management team delivering results through long-standing industry expertise, entrepreneurial spirit and focus
 on operational excellence as well as governance and compliance processes

                   Javier Molina                                Wolf Lehmann             Key achievements / track record
                   CEO                                          CFO;
                                                                incl. responsibilities             Extensive experience in steel and
                                                                for operational                    aluminium recycling business,
                                                                excellence & IT                    including managing through the cycle

                                                                                                     Strong performance results through
• CEO since 2000                                 • CFO since 2014                                    focus on operational excellence
• Leading Befesa for >20 years                   • 20+ years in finance &
                                                   operational leadership roles,
                                                   50/50 General Electric / PE                          Building strong business
                                                                                                        foundation of ESG, compliance
                                                                                                        and health & safety processes

                   Asier Zarraonandia                           Federico Barredo                          Successful international
                   Vice-president                               Vice-president                            expansion
                   Steel Dust                                   Aluminium Salt Slags
                   Recycling Services                           Recycling Services
                                                                                                       Track record of successful
                                                                                                       acquisitions and turnarounds,
                                                                                                       e.g. BUS, Agor, Alcasa,
                                                                                                       Hankook, Silvermet
• 15+ years with Befesa                          • 25+ years with Befesa
• Running Befesa’s Steel Dust                    • Running Befesa’s Aluminium Salt                Experience in developing greenfield
  business for >15 years                           Slags business for >20 years                   projects, e.g. Gravelines, South Korea,
                                                                                                  Bernburg, China

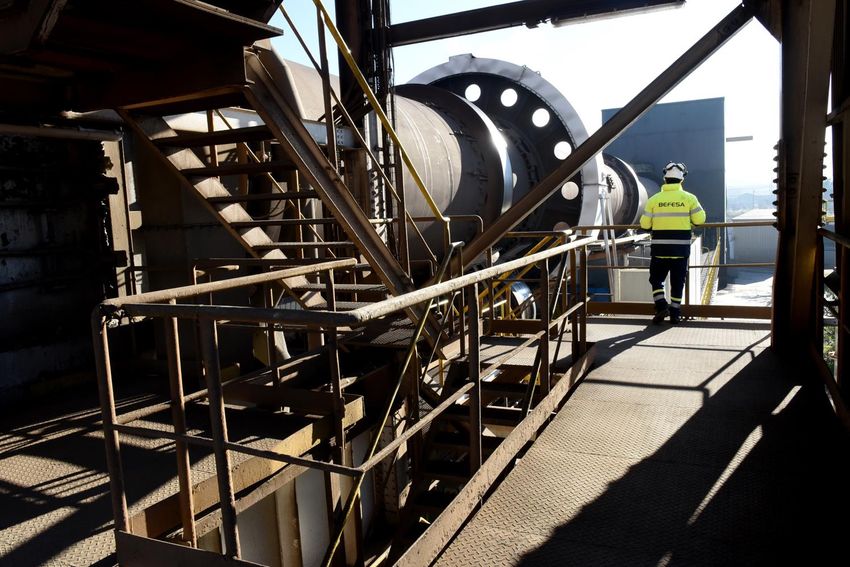
 23   Business Update – Full Year 2020 Results
Waelz kiln at EAFD recycling plant in Gyeongju, South Korea

04   Investor agenda
     & appendix
Investor agenda
Financial calendar                                                           Investor conferences
                                                                  H1 2021                                 H2 2021
Annual Report 2020                              Berenberg DACH & Nordic Conf. 2021          Frankfurt – Commerzbank Corporate
Thursday, 25 March 2021                         17 March 2021 – Berenberg                   Conference 2021
                                                                                            31 Aug - 2 Sep – Commerzbank
                                                Citi Virtual Paris Symposium
                                                23 March 2021 – Citi                        London – Citi Growth Conference
Q1 2021 Statement & Conf. Call
                                                                                            16 & 17 September 2021 – Citi
Tuesday, 27 April 2021                          6thGerman Corporate Conference
                                                25 March 2021 – Stifel                      Munich – 10th Baader Investment
                                                                                            Conference 2021
                                                London – UN Sustainable Development
Annual General Meeting                                                                      20-24 September 2021 – Baader
                                                Goals Conference 2021
Wednesday, 23 June 2021
                                                20-21 April 2021 – Berenberg                London – Global Natural Resources
                                                                                            Conference 2021
                                                Frankfurt – 4th
                                                              German SMID Cap
                                                                                            11 November 2021 – Goldman Sachs
H1 2021 Interim Report & Conf. Call             1-on-1 Forum
Thursday, 29 July 2021                          11 May 2021 – Stifel                        Pennyhill Park, Surrey – Berenberg
                                                                                            European Conference 2021
                                                Tarrytown (New York) – Berenberg US
                                                                                            6–9 December 2021 – Berenberg
                                                Conference 2021
Q3 2021 Statement & Conf. Call
                                                18 May 2021 – Berenberg
Thursday, 28 October 2021
                                                Mining & Steel Virtual Conference 2021
                                                18-20 May 2021 – BofA Global Metals
                                                2nd Digital Pan European ESG Conference
                                                1 June 2021 – Kepler Cheuvreux
                                                Stifel 2021 Virtual Cross Sector Insight
                                                Conference
                                                8-10 June 2021 – Stifel

IR contact details                              Rafael Pérez
                                                Director of Investor Relations & Strategy
                                                Phone: +49 (0) 2102 1001 340
                                                email: irbefesa@befesa.com
25   Business Update – Full Year 2020 Results
Crude steel production - COVID-19 tracker
Continued month-over-month recovery in crude steel production during 2020;
Befesa demonstrated resilient volumes and capacity utilisation levels again

2020 crude steel production1) (yoy % change, unless otherwise stated)

                                                                                                                                             FY’19   FY’20
                         Jan          Feb         Mar          Apr          May           Jun      Jul    Aug    Sep    Oct    Nov    Dec                    % yoy
                                                                                                                                             (MT)    (MT)

         EU-27            -7%         -1%         -19%         -30%         -25%         -23%      -19%   -13%   -11%   -2%    +7%    +10%    157     139    -12%

         Turkey          +17%        +8%          +4%          -26%         -26%          +4%      +8%    +24%   +18%   +19%   +12%   +18%    34      36     +6%

         S. Korea         -8%        +3%           -8%         -15%         -14%         -14%      -8%    -2%    +1%    -2%    -2%    +1%     71      67      -6%

         Served
                          -5%         +1%         -14%         -26%         -22%         -18%      -13%   -5%    -4%    +1%    +5%    +9%     263     242     -8%
         market2)

         China           +1%         +5%           -2%          0%            +4          +4%      +9%    +8%    +11%   +13%   +8%    +8%     996    1,053   +5%

         World            -1%        +3%           -6%         -14%          -9%          -6%      0%     +2%    +4%    +7%    +6%    +6%    1,844   1,864    -1%

     •     Crude steel production recovering month-over-month in served markets

     •     China with 5% yoy growth; Befesa opening first two EAFD recycling plants this year

     •     2020 crude steel output by EAF / BOF process planned to be published in Mar / Apr by World Steel Association

     •     Germany: EAF output -3% yoy vs. BOF -13% yoy3); EAF share 32% / BOF 68% (vs. 30% / 70% in 2019);
                    Showing EAF more resilient vs. BOF

1) Source: worldsteel.org
2) “Served market” is a subtotal of EU-27 + Turkey + South Korea as a proxy of the served market
3) Source: stahl-online.de

26          Business Update – Full Year 2020 Results
Befesa’s resilience during latest crises
Befesa demonstrated resilient volumes and capacity utilisation levels again

                                                                      2008 / 2009 / 2010                                                                    2019 / 2020

                                          600                                                                                                                                                        200
                                                                                                                                   240 800
                                          550                                                                                                                                                        190
                                                                                                                                                                               687
           Befesa EAFD                                                                                                                                666
                                          500              474                                                 482                 220 700
                                                                                                                                                                                                     180
           throughput kt
                                          450                                                                                      200 600                                                           170
                                                                                     406
           EU-27 crude steel 400                                                                                                                                                                     160
           production Mt2)                                198                                                                      180 500
                                          350                                                                                                                                                        150
                                                                                                                                                     157
                                                                                                              173                  160 400
                                          300                                                                                                                                                        140

                                                                                                                                   140 300
                                          250                                                                                                                                  139                   130
                                                                                   139
                                          200                                                                                      120 200                                                           120

                                                          2008                     2009                      2010                                    2019                      2020
Befesa EAFD utilization %                                 96%                      82%                       96%                                     81%                       83%
Befesa EBITDA (€m)                                        €992)                    €612)                     €992)                                   €160                      €127

1)   Source: worldsteel.org
2)   Total EBITDA is the sum of Steel Dust & Aluminium Salt Slags segments proforma (PF) comparable to Befesa structure in ´19/´20; Thus, it excludes divested IES, EPC and Concessions businesses

27        Business Update – Full Year 2020 Results
Multi-year trend – Key financials1)
(€m, unless otherwise stated)

                                              2017                                         2018                                          2019                                          2020
Revenue                                       €667.42)                                     €720.1                                        €647.9                                        €604.3

Reported EBITDA                               €153.0                                       €176.0                                        €159.6                                        €123.5

Reported EBITDA                               22.9%2)                                      24.4%                                         24.6%                                         20.4%
margin
Adjusted EBITDA                               €172.43)                                     €176.0                                        €159.6                                        €127.04)

Adjusted EBITDA                               25.8%2)                                      24.4%                                         24.6%                                         21.0%
margin
Net profit5)                                  €49.3                                        €90.2                                         €82.7                                         €47.6

EPS5) (€)                                     €1.026)                                      €2.65                                         €2.43                                         €1.40

Operating cash flow7)                         €91.5                                        €103.8                                        €102.5                                        €92.5

Cash position                                 €117.6                                       €150.6                                        €125.5                                        €154.6
end of period
Net debt                                      €406.4                                       €376.8                                        €416.9                                        €393.6

Net leverage                                  x2.4                                         x2.1                                          x2.6                                          x3.1

1) 2017, 2018 and 2019 are full year actual reported figures audited by external auditors; 2020 are full year preliminary figures currently being audited by external auditors
2) FY 2017 reported revenue amounted to €724.8m; Revenue of €667.4m is comparable after amendment IFRS 15 impacting non-operating revenue
3) 2017 EBITDA adjusted due to one-off non-recurrent items primarily related to the IPO
4) 2020 EBITDA adjusted for €3.5m for the UK Salt Slags plant closure
5) Net profit and total basic earnings/(losses) per share attributable to the ordinary equity holders of Befesa S.A.
6) FY 2017 EPS impacted by the conversion of the preferred shares carried out in October 2017 prior to the IPO; The weighted average number of ordinary shares used as the denominator in calculating total basic EPS

    in FY 2017 was 25,025 thousand shares, compared to the 34,067 thousand shares used from 2018 onwards
7) Operating cash flow is after WC change, taxes and interests; pre capex and pre dividend

28      Business Update – Full Year 2020 Results
Multi-year trend – Operational data
                                               2017                                           2018                                           2019                                          2020
 EAFD                                          661.0                                          717.1                                          665.8                                         687.0
 throughput (kt)
 EAFD average capacity                         84.7%                                          92.0%                                          80.7% / 90.1%1)                               83.0%
 utilisation (%)
 Waelz oxide (WOX)                             217.8                                          240.9                                          217.6                                         239.2
 sold (kt)
 Zinc LME price (€/t)                          €2,572                                         €2,468                                         €2,276                                        €1,979
 Zinc hedging                                  €1,876                                         €2,051                                         €2,317                                        €2,239
 price (€/t)
 Zinc blended price2)                          €2,160                                         €2,168                                         €2,280                                        €2,136
 (€/t)
 Salt Slags & SPL                              509.9                                          517.0                                          492.6                                         444.6
 treated (kt)
 Salt Slags & SPL avg.                         96.2%                                          97.5%                                          92.9%                                         83.7% / 86.9%3)
 cap. utilisation (%)
 Alu alloys produced                           184.1                                          169.3                                          176.7                                         174.3
 (kt)
 Secondary Alu avg.                            89.8%                                          82.6% / 98.1%4)                                86.2% / 91.1%5)                               84.8%
 capacity utilisation (%)
 Aluminium alloy FMB                           €1,766                                         €1,715                                         €1,397                                        €1,420
 price6) (€/t)
1) Installed capacity and corresponding utilisation rates in 2019 are normalised for the capacity upgrade in Turkey, from 65kt to 110kt (plant was shutdown from end of Jan to mid-Aug 2019)
2) Blended rate between hedged prices and average spot prices, weighted by the respective hedged and non-hedged volumes, reflecting the effective price to Befesa
3) Installed capacity and corresponding utilisation rates in 2020 are normalised for the UK salt slags plant closure in Q4 2020
4) Installed capacity and corresponding utilisation rates in 2018 are normalised for the furnace upgrades in Bilbao (plant was shutdown three months, from 2nd week of June to 3rd week of September),

    as well as the Barcelona - phase I (plant was shutdown two months, from 4 th week of August to 4th week of October)
5) Installed capacity and corresponding utilisation rates in 2019 are normalised for the furnace upgrade in Barcelona – phase II (plant was shutdown three months, from mid-August to mid-November)
6) Aluminium scrap and foundry ingots aluminium pressure diecasting ingot DIN226/A380 European Metal Bulletin free market duty paid delivered works

 29      Business Update – Full Year 2020 Results
You can also read