WAIHEKE LOCAL BOARD ECONOMIC OVERVIEW - AUCKLAND ECONOMIC OVERVIEWS - Knowledge Auckland
←
→
Page content transcription
If your browser does not render page correctly, please read the page content below
MARCH 2020
  AUCKLAND ECONOMIC OVERVIEWS

 WAIHEKE
 ──
 LOCAL BOARD ECONOMIC
 OVERVIEW

aucklandnz.com/business

                                a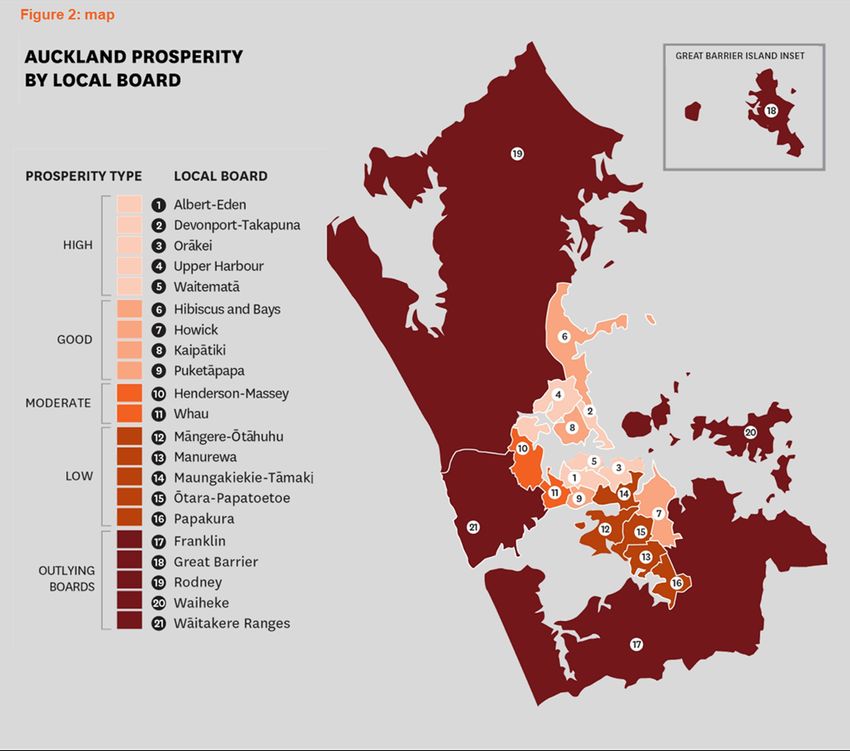
2   | Waiheke Local Economic Overview 2019

2   | Document Title – even page header
                                             Contents

                                                1          Introduction

                                                2          People and Households

                                                3          Skills

                                                4          Local Economy

                                                5          Employment Zones

                                                6          Development trends

                                                7          Economic Development Opportunities

                                                8          Want to know more?

                                                           Glossary

                                          aucklandnz.com/business
3
Introduction 3 | Document Title – even page header
What is local economic development
ATEED’s goal is to support the creation of quality jobs for all Aucklanders and while
Auckland’s economy has grown in recent years, the benefits of that growth are not
distributed evenly.
Local economic development brings together a range of players to build up the economic
capacity of a local area and improve its economic future and quality of life for individuals,
families and communities.
Auckland’s economic development
Auckland has a diverse economy. While central Auckland is dominated by financial,
insurance and other professional services, parts of south and west Auckland have
strengths in a range of manufacturing industries.
In other areas, tourism is a key driver and provides a lot of local employment while there
are also areas that are primarily residential where residents commute to the city centre or
one of the industrial precincts for employment. The Auckland region also has a
significant primary sector in the large rural areas to the north and south of the region.
The Auckland Growth Monitor1 and Auckland Index2 tell the story behind Auckland’s
recent economic growth.
While annual GDP growth of 4.3 per cent per year over the last five years is encouraging,
we want our economy to be more heavily weighted towards industries that create better
quality jobs and generate export earnings. To support this goal ATEED has a role in
promoting the adoption of new technologies and innovation across the economy and at
the same time attracting investment and supporting sectors such as screen, the visitor
economy and international education that bring in revenues from overseas.
Although there is still a need to attract and retain larger employers to the city, helping
local economies to grow requires an enhanced focus on existing small businesses which
make up 97 per cent of all Auckland businesses. Businesses can be supported by raising
their capability, encouraging business networking, connecting them to talent and
facilitating access to export markets. ATEED help provide access to a range of business
support programmes for established businesses that are looking for help in order to grow.
There is also a need to continue to support entrepreneurship and business start-ups,
particularly in less prosperous parts of the region.
In 2018 ATEED produced the Auckland Prosperity Index3, which highlighted how different
parts of the region have felt the benefits of Auckland’s continued economic growth. This
has shaped the approach we have been asked to take in the region, focusing on those
activities and industry sectors that will have the greatest impact on increasing investment
in quality jobs – particularly where Auckland’s south and west can benefit.
1 https://www.aucklandnz.com/business-and-investment/economy-and-sectors/auckland-growth-monitor
2 The Auckland Index can be found at aucklandnz.com/auckland-index
3 https://www.aucklandnz.com/business-and-investment/economy-and-sectors/market-news-and-
trends/growing-prosperity-for-all-aucklanders
aucklandnz.com4 | Waiheke Local Economic Overview 2019
4 The role of local boards
| Document Title – even page header
At the local level ATEED works with local boards to support several areas of work:
• Growing local businesses through a range of initiatives to support start-ups and
small and medium sized enterprises across the region
• Place based initiatives either working with Auckland’s regeneration agency Panuku
Development Auckland in its ‘Transform and Unlock’ areas as well as with smaller
locally driven place-based initiatives
• Business environmental sustainability initiatives and the promotion of waste-
minimisation and circular economy opportunities
• Providing economic intelligence: enhancing the evidence base and advice provided
by ATEED at a local level. To provide a better understanding of the drivers of
prosperity in a local area. While also providing the justification for the projects and
initiatives delivered by the team.
Local boards have a mandate to advocate for and fund a range of activities on behalf of
their local communities. The local boards of Auckland Council want thriving town centres
and access to employment opportunities in their communities and when opportunities lie
elsewhere, transport solutions so residents can easily access those opportunities. Local
boards are in a unique position to understand their local economy, work with the local
business community and advocate or catalyse activities for local economic development.
Through their advocacy role as well as through their empowering communities and locally
driven initiatives budgets local boards can play a role in a range of ways. They can
support:
• ‘Places’ by supporting the town centres and business associations that provide
much of their local employment or working with Panuku Development Auckland
and ATEED to regenerate their town centres and attract investment and jobs
• ‘People’ through support for community organisations that work with people
distant from the labour market, they can support skills development for young
people through a range of programmes like the Young Enterprise Scheme
• The business community programmes like the PopUp Business School that fill
gaps where mainstream services don’t meet community need
• The sustainability of their local economies by helping promote business
environmental sustainability and waste minimisation.
What is the Waiheke local economic development overview?
This economic development overview of the Waiheke Local Board area looks at:
• a range of indicators on Waiheke’s economy
• the drivers, trends and linkages that influence the local economy
• major private and public initiatives that will impact on the economy in Waiheke
• opportunities and issues to growing business and jobs in Waiheke
The economic development overview can be the first stage in guiding local boards as to
what the key issues are in their area and where the local board should focus its efforts
when considering the outcomes it would like to include in the 2020 Local Board Plan.Waiheke Local Board
Economic Overview 2019
Summary
There is a high level of business growth on Waiheke and many residents are self employed. However, the number
of jobs on the island remains low and are more likely to be lower skilled and this is a constraint on income levels.
Waiheke has a booming tourism industry attracting 40,000 visitors a day during the summer season. This along
with horticulture and wine manufacture underpin employment on Waiheke.
Unemployment
Population growth rate (Census 2018)
Population growth has been lower than the regional average over the 2013-2018 Census
2.2%
period. The area predominantly has a New Zealand European population with a sizeable
Māori community. Waiheke
4.1%
Unemployment rate Auckland
Educational attaintment is average, a much lower proportion of school leavers enter degree
level study upon leaving school.
Jobs in Knowledge
Intensive Industries
Local employment opportunities 17.0%
Over the five years 2013 to 2018, the fastest growing industries by GDP in the local board area
Waiheke
were transport, postal & warehousing, construction and accommodation & food services.
39.0%
Auckland
Education attainment
Educational attaintment is high, a higher proportion of school leavers enter degree level study School leavers
upon leaving school. moving on to degree
level study (2018)
30.9%
Residential developments
Waiheke has seen a steady level of development as more people are attracted to live on Waiheke
the island.
42.0%
Auckland
LOCAL BOARD ASPIRATIONS
The current Waiheke Local Board Plan strives for Waiheke to have a sustainable economy and positive visitor
experience. This means any economic activity must balance development with impacts on the environment and
infrastructure, to ensure the community’s lifestyle is not adversely affected. The local board wishes to support
small business and high value industries, and foster collaboration and local skill development and opportunities
for young people.
KEY OPPORTUNITIES
With a low number of jobs on Waiheke, supporting the development of businesses in more knowledge intensive
industries will be important to increase the number of highly skilled jobs available. This could also attract younger
residents and help reduce the island’s high dependency ratio.
KEY CHALLENGES
Waiheke has an economy dominated by its attractiveness as a tourism destination which is seasonal in nature can
create pressures on the island ‘s infrastructure at peak times. While a number of residents are affluent, not all sectors
of the community are able to share in prosperity which is often generated off the island.
aucklandnz.com6 | Waiheke Local Economic Overview 2019
6
People and Households
| Document Title – even page header
Waiheke is one of Auckland’s least populous local board areas
with a population of 9,063 that is forecast to increase to
11,400 by 2038.
Waiheke is one of Auckland’s less prosperous areas. The Auckland Prosperity Index
report showed there is high level of business growth on Waiheke and many residents are
self-employed. However, the number of jobs on the island remains low and are more likely
to be lower skilled. This is a constraint on income levels.
Waiheke Auckland / Share of
Auckland
Population (2018) 9,063 0.6%
Population growth (2013-2018) 8.7% 11.0%
Median Age (2018) 46.7 34.8
Labour force (2018) 5,100 876,100
Labour force participation (2018) 74% 71%
Home ownership (2018) 59% 45%
Population
The Waiheke Local Board area has experienced slower population growth that the region
in recent years.
POPULATION GROWTH (2013-2018) MEDIAN AGE (CENSUS 2018)
11.0% 46.7
years
8.7% 34.8
years
Waiheke Auckland Auckland Waiheke
Between the 2013 and 2018 censuses population growth was 8.7 per cent compared to
11.0 per cent regionally. Medium population projections4 suggest that Waiheke could be
home to 11,400 residents by 2038 an increase of 2,000. This is equivalent to a 1.2 per
cent p.a. increase or an additional 120 people per year between 2018 and 2038.
4
Source: Statistics New Zealand7
AGE STRUCTURE (CENSUS 2018) 7 | Document Title – even page header
16%
Under 15 years
20%
14%
15-29 years
23%
49%
30-64 years
45%
21%
65 years and over
12%
Waiheke Auckland
Ethnicity
Waiheke’s population is predominantly of European ethnicity (89 per cent), more so than
the regional profile where Europeans make up 54 per cent of the population. Waiheke
has fewer Māori and Pacific residents than the region there are also fewer people of
Asian ethnic origin.
ETHNIC MAKE-UP (CENSUS 2018)
1% Source: Census 2018
Other ethnicity 1%
Middle Eastern/Latin American/African 3%
2%
Asian 4%
28%
Pacific Peoples 4%
16%
Maori 11%
12%
European 89%
54%
0% 20% 40% 60% 80% 100%
Waiheke Auckland
Waiheke has a large proportion of residents born overseas (33 per cent) and 25 per cent
of people born overseas had been in New Zealand less than five years.
Languages
With a less diverse population than elsewhere in the region 98 per cent of Waiheke
residents are able to speak English compared to 93 per cent for the region.
aucklandnz.com8 | Waiheke Local Economic Overview 2019
8 Labour Force
| Document Title – even page header
The labour force participation rate is a measure of an economy's active workforce. A high
participation rate indicates more people in the area are actively engaged in the economy.
The size of the labour force is critical to an area’s ability to produce goods and services.
The labour force participation rate in Waiheke is 74 per cent, which is lower than the
Auckland rate (71 per cent).
LABOUR FORCE PARTICIPATION RATE OVER TIME (HOUSEHOLD LABOUR FORCE SURVEY)
74%
90
80 73.6%
70
The labour force
71.0%
participation rate in 60
Waiheke was 74 per cent
in June 2019, higher than 50
the Auckland rate (71 per
cent) 40
30
20
10
Source: HLFS, 2018 four quarter average
0
Dec-14 Jun-15 Dec-15 Jun-16 Dec-16 Jun-17 Dec-17 Jun-18 Dec-18 Jun-19
Waiheke Auckland
The unemployment rate in the 2018 Census5 was 2.2 per cent in the Waiheke Local
Board area, lower than the Auckland region unemployment rate of 4.1 per cent.
UNEMPLOYMENT RATE (CENSUS 2018)
4.1%
2.2%
Waiheke Auckland
Unemployment data measured by the Household Labour Force Survey in Waiheke is
suppressed due to the small population size.
5 Note the Census based unemployment rate differs from the rate reported by the Household Labour Force
Survey as data collection methods differ and the Census rate is self-reported at the time of completion of the
Census form.9
Incomes 9 | Document Title – even page header
Analysis of individual income levels in 2018 shows that there was a similar proportion (20
per cent) of persons earning a high income (over $70,000 per year) in Waiheke
compared to the region.
INDIVIDUAL INCOMES (CENSUS 2018)
20% 19% 20% 20%
18%
16% 15%
14% 15%
13%
11%
10%
4% 5%
$5,000 or $5,001 – $10,001 – $20,001 – $30,001 – $50,001 – $70,001 or
less $10,000 $20,000 $30,000 $50,000 $70,000 more
Waiheke Auckland
In 2018, 29 per cent of individuals in Waiheke derived self-employment or business
income, well above the rate across Auckland (14 per cent).
Home ownership in Waiheke is higher than the regional average; in 2018, 59 per cent of
households owned the dwelling they lived in, compared to 45 per cent across Auckland.
HOME OWNERSHIP (CENSUS 2018)
55%
44%
41%
34%
15%
11%
Hold in a family trust Own or partly own Do not own and do not hold
in a family trust
Waiheke Auckland
aucklandnz.com10 | Waiheke Local Economic Overview 2019
10
Skills
| Document Title – even page header
Waiheke has a well qualified labour force with a high proportion
of residents educated to degree level or higher. While school
leavers from Waiheke leave with NCEA Level 1 or NCEA Level 2
in similar proprtions as regionally fewer are leaving with NCEA
level 3 and fewer are progressing in to tertairy education.
Qualifications
A skilled workforce drives a strong and resilient local economy and is critical for
Auckland’s future competitiveness.
The New Zealand Qualifications Framework (NZQF) has ten levels which are based on
complexity, with Level 1 the least complex and Level 10 the most complex. All
qualifications on the NZQF are assigned one of the ten levels and fit into a qualification
type: a certificate (Levels 1-4), diploma (Levels 5-6) or degree (Levels 7-10). Secondary
school qualifications of National Certificates of Educational Achievement (NCEA) are
gained at Levels 1-3.
Achieving a school level qualification significantly improves a school leaver’s employment
prospects and people with higher level qualifications are less likely to experience
unemployment. The unemployment rate fell substantially in 2017 for people with higher-
level qualifications. The rate was 2.4 per cent in 2017 for those with a bachelor’s degree
or postgraduate qualification, down from 2.9 per cent in 2016. For people with no
qualification, the unemployment rate was more than three times larger, at 8.4 per cent.
The unemployment rate for people with a Level 4 to 6 diploma or certificate did not alter
greatly from 2016 to 2017. It was 3.5 per cent in 2017. 6
RESIDENTS’ HIGHEST QUALIFICATIONS (CENSUS 2018)
36% 36%
34%
31%
13% 15%
11% 10%
No Qualification Certificate Level 1-4 Diploma Level 4-6 Bachelor's Degree or
Higher
Waiheke Auckland
6 https://www.educationcounts.govt.nz/statistics/indicators/main/education-and-learning
outcomes/unemployment_rates_by_highest_qualification11
In 2018, 34 per cent of adult residents in Waiheke had
11 gained a bachelor’s
| Document degree
Title – even page or
header
higher, a higher proportion than the Auckland region 31 per cent). Thirteen per cent of
residents had no educational qualifications compared with 15 per cent across the
region7.
NCEA is the national school-leaver qualification and is used as the benchmark for
entrance selection by universities and polytechnics. In 2018, nine per cent of school
leavers in Waiheke did not achieve the standard for NCEA Level 1 similar to the rate
regionally.
In 2018, 16 per cent of school leavers in Waiheke did not achieve NCEA Level 2, which
provides the foundation skills required for employment. This is also very similar to the
Auckland average.
NCEA – STUDENTS ATTAINING NCEA (2018)
LEVEL 1 LEVEL 2
91.2% 90.6% 83.8% 83.4%
Waiheke Auckland Waiheke Auckland
NCEA 1 ATTAINMENT BY ETHNICITY
Percentage achieving NCEA Level 1 Level 2
European / Pakeha 92.6% 85.2%
Māori 73.3% 53.3%
Pacific - -
Asian 80.0% 80.0%
Middle East, Latin American, African - -
Other - -
Total Waiheke 91.2% 83.8%
Total Auckland 90.6% 83.4%
NCEA Level 3 is regarded as the minimum level required for university entry. Fifty-six per
cent of Waiheke school leavers achieved this, lower than the Auckland average of 63 per
cent. Māori (27 per cent) school leavers in Waiheke however performed noticeably less
well.
7 Highest qualification is derived for people aged 15 years and over
aucklandnz.com12 | Waiheke Local Economic Overview 2019
12 | Document Title – even page header
DESTINATION OF SCHOOL LEAVERS IN THEIR FIRST YEAR AFTER LEAVING
School leavers attaining
Certificates & Not enrolled
NCEA level 3 (2018) Bachelor’s Certificates
diplomas in tertiary Total Leavers
and above Levels 1-2
levels 3-7 education
62.7%
55.9%
Waiheke 30.9% 14.7% 2.9% 51.5% 68
Auckland 42.0% 20.9% 3.1% 34.1% 20,421
Waiheke Auckland
SCHOOL LEAVERS MOVING ON TO DEGREE LEVEL STUDY (2018)
42.0%
30.9%
Waiheke Auckland
Fewer Waiheke school leavers went on the enter degree level study on completion of their
schooling and fewer also entered into any form of tertiary education. Thirty-one per cent
of Waiheke school leavers did this, much lower than the Auckland average of 42 per cent.
A lower proportion also moved into certificate and diploma level study, meaning overall
far fewer (48 per cent) enrolled in any form of tertiary education than the regional
average (66 per cent).13
Local Economy 13 | Document Title – even page header
Waiheke has a moderately strong local economy with many
residents accessesing skilled jobs on the mainland in Central
Auckland. Much of the employment on the island is related to
the island’s visitor economy which attracts upto 40,00 vistors a
day in the summer peak. Waiheke however has few high skilled
jobs available locally. Rental, hiring and real estate services,
retail trade and accomodation and food services create a large
number of local jobs.
Growth and employment trends
In 2018, GDP in Waiheke contracted 1.8 per cent from 2017, lower than the growth rate
in Auckland of 3.9 per cent. In the five years to 2018 the Waiheke economy grew at an
average annual rate of 3.8 per cent, lower than the 4.2 per cent in the Auckland region.
Employment in Waiheke increased by an average 4.8 per cent per annum in the five
years from 2013 to 2018, above the Auckland rate of 3.4 per cent. Over the last five
years Waiheke job numbers increased the most in accommodation and food services
(+174 jobs), agriculture, forestry and fishing (+118 jobs) and retail trade (+106 jobs)
sectors.
AVERAGE ANNUAL GDP AND EMPLOYMENT GROWTH 2008-2018
4.0%
3.4% 3.4%
2.7%
$265 m $91,665 m 3,464 886,187
Waikheke Auckland Waiheke Auckland
Over the five years 2013 to 2018, the fastest growing industries by GDP in Waiheke were
transport, postal and warehousing, construction and accommodation and food services.
aucklandnz.com14 | Waiheke Local Economic Overview 2019
14 FASTEST
| Document Title – even page header GROWING INDUSTRIES BY GDP (ANZSIC LEVEL 1) (source Infometrics)
Industry Average pa change
Transport, Postal & Warehousing 16.2%
Construction 10.1%
Accommodation & Food Services 8.5%
Professional, Scientific & Technical Services 8.1%
Retail Trade 6.8%
Agriculture, Forestry and Fishing 5.86%
Industry mix
Waiheke’s future economic performance depends on its combination of a sufficiently
diversified industrial base and clusters of sectors that have the potential to achieve high
rates of productivity and export growth. The main sectors with a strong presence in the
Waiheke economy are rental, hiring and real estate services, retail trade and
manufacturing.
BROAD INDUSTRY MIX BY GDP (ANZSIC LEVEL 1) (source Infometrics)
Rental, Hiring and Real Estate Services 24.1%
7.9%
Retail Trade 9.2%
5.2%
Manufacturing 8.7%
9.5%
Accommodation and Food Services 7.7%
2.1%
Construction 7.4%
5.5%
Transport, Postal and Warehousing 6.6%
5.3%
Health Care and Social Assistance 6.0%
5.4%
Professional, Scientific and Technical Services 5.6%
10.1%
Wholesale Trade 4.5%
7.4%
Education and Training 4.4%
3.9%
Agriculture, Forestry and Fishing 4.2%
0.3%
Waikheke Auckland
• Rental, hiring & real estate services contributed 24 per cent of
Waiheke’s GDP and only six per cent of the area’s employment.
• Retail trade contributed nine per cent of Waiheke’s GDP and 12 per cent
of the area’s employment.
• Manufacturing contributed nine per cent of Waiheke’s GDP and provided
three per cent of the area’s employment
• Accommodation & food services contributed eight per cent of Waiheke’s
GDP and provided 18 per cent of the area’s employment.15
TOP INDUSTRIES BY EMPLOYMENT AND GDP (ANZSIC
15 LEVEL (source
1) Title
| Document – even Infometrics)
page header
GDP Employment
Rental, Hiring and Real Estate 24.10%
Services 6.30%
Retail Trade 9.20%
11.90%
Manufacturing 8.70%
3.20%
Accommodation and Food 7.70%
Services 18.20%
Construction 7.40%
9.80%
Transport, Postal and 6.60%
Warehousing 5.70%
Accommodation and food and horticulture and fruit growing are the main employment
sectors on Waiheke.
TOP 10 INDUSTRIES BY EMPLOYMENT– 54 SECTOR CLASSIFICATION (source Infometrics)
Rank Industry Jobs % of Waiheke Total
1 Accommodation & Food Services 629 18.2%
2 Horticulture & Fruit Growing 353 10.2%
3 Health Care & Social Assistance 244 7.0%
4 Education & Training 215 6.2%
5 Supermarket & Specialised Food Retailing 200 5.8%
6 Other Store & Non-Store Retailing 192 5.5%
7 Building Construction 179 5.2%
8 Professional, Scientific & Tech Services 174 5.0%
9 Road Transport 170 4.9%
10 Property Operators & Real Estate Services 150 4.3%
Total top 10 industries 2,506 72.3%
All other industries 957 27.7%
Total employment 3,464
Professional, scientific and technical services have seen the greatest employment growth
over the last five years with construction and accommodation and food services also
seeing large increases.
Management consulting and Computer Systems Design and Related Services are
important professional service employment sectors. Within education, 30 per cent of
jobs are in higher education. Cafés and restaurants make up two thirds of employment in
the accommodation and food services sector. Twenty-seven per cent of employment in
construction services is in the electrical services sub-sector.
aucklandnz.com16 | Waiheke Local Economic Overview 2019
16 | Document Title – even page header
Accommodation and food services have seen the greatest employment growth over the
last five years with road transport and horticulture also seeing large increases.
NEW JOBS BY SECTOR – 54 SECTOR CLASSIFICATION (2013 - 2018) (source Infometrics)
Sector New Jobs
Accommodation & Food Services 174
Road Transport 115
Horticulture & Fruit Growing 113
Administrative & Support Services 85
Other Store & Non-Store Retailing 71
SECTORS WITH DECLINING JOBS – 54 SECTOR CLASSIFICATION (2013 - 2018)
Occupation Jobs Lost
Education & Training -70
Local Government Administration -22
Knowledge-intensive industries
Knowledge intensive industries8 represent an increasing share of the New Zealand
economy's output and employment and may be a source of future productivity growth. 17
per cent of jobs in Waiheke are in knowledge intensive industries, which is lower than the
regional average of 39 per cent.
JOBS IN KNOWLEDGE INTENSIVE INDUSTRIES (source Infometrics)
Waiheke Auckland
17% 39%
Jobs in KI Industries Jobs in non-KI Industries
Jobs in KI Industries Jobs in non-KI Industries
Comparative Advantage
A number of sectors are more strongly represented in Waiheke than they are in the region
as a whole. The wine industry (fruit growing and beverage manufacture) and tourism
(accommodation and food and property operators) are significant contributors to the
Waiheke economy.
8 Knowledge-intensive industries are industries that satisfy two basic criteria: At least 25 per cent of the
workforce must be qualified to degree level and at least 30 per cent of the workforce must be employed in
professional, managerial, as well as scientific and technical occupations.17
17 | Document Title – even page header
INDUSTRIES CONCENTRATED IN LOCAL BOARD AREA (source Infometrics)
Rank Industry Location GDP
Quotient $M Employees
1 Horticulture & Fruit Growing 30.0 7.8 353
2 Beverage & Tobacco Product Manufacturing 7.9 18.9 57
3 Road Transport 3.9 14.5 170
4 Accommodation & Food Services 3.7 20.4 629
5 Rental & Hiring Services 3.6 13.3 69
6 Supermarket & Specialised Food Retailing 3.0 11.1 200
7 Property Operators & Real Estate Services 2.9 50.6 150
ATEED Sectors of Focus
Auckland has developed a core of specialist manufacturing industries and a talented,
globally focused service sector.
These industries and sectors are grouped into advanced industries, tradeable industries
and enabling industries. Together they drive growth and create employment in Auckland
and are of particular interest to ATEED with regards support that can be provided to help
their growth.
Tourism is one of the sectors of focus for ATEED that is well represented in Waiheke.
EMPLOYMENT IN ATEED FOCUS SECTOR (2018)
Share of Sector to Total Auckland Waiheke +/- on A-E sector
Advanced Materials Related 1.7% 0.1% -93%
Commercial services 21.2% 8.0% -62%
Construction and engineering 11.2% 10.4% -7%
Education 7.6% 6.2% -18%
Food and Beverage 3.5% 4.3% 23%
Screen and creative 6.0% 3.9% -35%
Technology 7.6% 2.1% -72%
Tourism 6.2% 11.1% 80%
Transport and Logistics 2.9% 2.1% -28%
aucklandnz.com18 | Waiheke Local Economic Overview 2019
Highly Document
18 |Skilled JobsTitle
Occupations 9
– even page header
(2018)
Higher skilled jobs offer people an improved standard of living and are a critical
component in attracting workers to an area. Statistics NZ allocates occupations to skill
36%
levels based on the range and complexity of tasks performed in a particular job. The skill
26% level does not relate to the qualifications obtained by an individual, but to the range and
complexity of the tasks they do at work. Waiheke has a higher proportion of low-skilled
jobs (43 per cent) and lower proportion of high-skilled jobs (26 per cent), compared to the
Auckland average.
Waiheke Auckland
OCCUPATIONS OF RESIDENTS (CENSUS 2018)
Waiheke Auckland
Professionals 24%
26%
Managers 22%
18%
Technicians and Trades Workers 14%
11%
Community and Personal Service Workers 10%
9%
Clerical and Administrative Workers 9%
12%
Sales Workers 8%
10%
Labourers 9%
8%
Machinery Operators and Drivers 4%
6%
Managers and professional occupations were the most popular occupational categories
for Waiheke residents in 2018. Compared to the region, there are a higher proportion of
managers and a lower proportion of workers in professional occupations in Waiheke. The
profile of jobs on Waiheke is very different to that which residents have given the
numbers that commute to the mainland for jobs in Auckland’s CBD. Of the jobs located
in Waiheke, managers are the largest occupational group (22 per cent), a higher
proportion than the Auckland average (18 per cent). Waiheke is under-represented in the
professional occupations, with this occupation making up 16 per cent of jobs compared
with 26 per cent for the wider region. Waiheke also has more lower skilled sales,
labouring and operator jobs.
OCCUPATIONS IN LOCAL BUSINESSES (2018) (source Infometrics)
9 The 2018 Census provides details of the occupations of residents of the local board area whereas Infometrics
data provides details of occupations within businesses located in the local board area.19
19 | Document Title – even page header
Waiheke Auckland
Professionals 16%
26%
Managers 22%
18%
Technicians and trades workers 12%
13%
Community, personal service workers 11%
9%
Clerical and administrative workers 8%
12%
Sales workers 12%
10%
Labourers 12%
9%
Machinery operators and drivers 6%
5%
Specialist managers10 are the largest occupational group in Waiheke, followed by sales
assistants & salespersons and hospitality workers.
TOP 10 OCCUPATIONS BY EMPLOYMENT IN WAIHEKE (2018) (source Infometrics)
% of total jobs
Rank Occupations Jobs
in Waiheke
1 Specialist Managers 263 7.6%
2 Sales Assistants & Salespersons 225 6.5%
3 Hospitality Workers 217 6.3%
4 Hospitality, Retail & Service Managers 209 6.0%
5 Education Professionals 185 5.3%
6 Farm, Forestry & Garden Workers 168 4.9%
7 Farmers & Farm Managers 163 4.7%
8 Sales Representatives & Agents 146 4.2%
9 Road & Rail Drivers 143 4.1%
10 Food Trades Workers 138 4.0%
Sub-total Top 10 occupations 1857 53.6%
Note, includes self-
Total jobs 3,464 employed
Many occupations saw significant growth from 2013-2018, particularly for road & rail
drivers, specialist managers and hospitality workers. The occupations where there was a
decline in the number of people employed in Waiheke were education professionals,
sports & personal service workers and clerical & office support workers.
10Specialist managers include managers in advertising, construction, ICT, business administration and
education.
aucklandnz.com20 | Waiheke Local Economic Overview 2019
20 FASTEST
| Document Title – even page header GROWING OCCUPATIONS 2013-2018 (source Infometrics)
Occupation New Jobs
Road & Rail Drivers 80
Specialist Managers 60
Hospitality Workers 57
Sales Assistants & Salespersons 45
Hospitality, Retail & Service Managers 44
OCCUPATIONS WITH DECLINING JOBS 2013-2018
Occupation New Jobs
Education Professionals -54
Sports & Personal Service Workers -3
Clerical & Office Support Workers -3
Business size11
In 2018 there were 1422 businesses in Waiheke employing an average of 2.4 employees
each, smaller than the Auckland average 4.5 employees. The number of businesses grew
1.6 per cent a year on average over the last decade, a slower average growth rate than
the Auckland average of 1.9 per cent.
BUSINESS SIZE – NUMBER OF JOBS (2018) (source Infometrics)
Waiheke Auckland
80%
70%
70% 64%
60%
50%
40%
30%
18%
20%
13%
10% 5% 4%
1% 1% 1% 2% 0% 1% 0% 1%
0%
0 (Owner 1 to 5 6 to 9 10 to 19 20 to 49 50 to 99 100+
Ops)
11 Large businesses are defined as entities with 20 or more employees21
Future of Work in Waiheke 21 | Document Title – even page header
In 2019 ATEED commissioned work12 to examine the likely future skills needs of the
Auckland economy as changing population demographics, emerging technologies and the
growth of new industries changes the nature of employment and the skills needed.
Waiheke Local Board is located in the Hauraki Gulf separate from mainland Auckland and
distant from important employment precincts in central / south Auckland. A ferry service
connects many residents to employment opportunities in the central city area.
Population growth and changing consumer demand will influence growth in particular
sectors. The Auckland Future Skills report indicates that Auckland can expect to see
growth across most industries with notable growth in construction, professional services,
health care, food service and education. Construction in particular is expected to grow by
approximately 56,000 jobs over the next 10 years.
Health care and social assistance is an important employment sector in Waiheke with
seven per cent of jobs in the area. Education is also important and provides six per cent
of the area’s jobs. Construction is a key employer in almost all local board areas and
represents 10 per cent of employment in Waiheke Local Board.
Professional services jobs include accounting, legal, architectural, engineering and
management consulting services are forecast to grow 28 per cent (31,000 jobs) over the
next ten years and much of this growth is likely to be in the central city where these jobs
are strongly concentrated. Almost 60 per cent of current jobs in central Auckland are in
these growth sectors which accounts for 31 per cent of jobs these sectors provide in the
Auckland region.
As an island local board area, Waiheke also has a limited number of jobs in these sectors
which account for around five per cent of local employment. Forecast growth in these
sectors is likely to include limited growth in Waiheke. Waiheke residents are likely
however to continue to commute to the central city to access the growing number of
professional service jobs there.
In order to access most of these growing occupations Waiheke residents are likely to
have to commute into the central city. Flexible working and fast internet connections
could facilitate resident’s ability to access quality employment on Waiheke.
12 Auckland Future Skills, Martin Jenkins (May 2019)
aucklandnz.com22 | Waiheke Local Economic Overview 2019
22
Employment Zones
| Document Title – even page header
Employment in Waiheke is concentrated in a number of town
centres. Horticulture and fruit growing provides employment
across the island.
As an island, Waiheke has a high proportion of residents that both live and work on the
island while a good number commute to the mainland for work. A smaller number
commute into Waiheke from the mainland. There are 9,063 residents of Waiheke which
has a labour force of 5,100. The local board area has a total of 3,464 jobs located within
it. As a result, the area is a net exporter labour to other parts of the city.
Employment Zones
Employment in Waiheke is concentrated the three main centres of Oneroa, Onetangi and
Ostend. Accommodation and food, food and other retail, construction and horticulture
are the main employment sectors in these areas.
EMPLOYMENT IN ONEROA* (source Infometrics)
Industry Jobs
Horticulture and Fruit Growing 267
Accommodation and Food Services 260
Supermarket, Grocery Stores and Specialised Food Retailing 78
Property Operators and Real Estate Services 64
Health Care and Social Assistance 57
Other Store-Based Retailing and Non-Store Retailing 46
Road Transport 42
Information Media Services 39
Total employment (all sectors) 1114
* Based on business demographics for the SA2 area
The supermarket in Ostend is a significant employer in the central part of Waiheke Island.
There are some other construction related suppliers and businesses in that area.23
EMPLOYMENT IN OSTEND* 23 (sourceTitle
| Document Infometrics)
– even page header
Industry Jobs
Supermarket, Grocery Stores and Specialised Food Retailing 124
Other Store-Based Retailing and Non-Store Retailing 103
Health Care and Social Assistance 92
Accommodation and Food Services 77
Construction Services 61
Education and Training 50
Heavy and Civil Engineering Construction 35
Local Government Administration 30
Total employment (all sectors) 801
* Based on business demographics for the SA2 area
EMPLOYMENT IN ONETANGI AREA* (source Infometrics)
Industry Jobs
Accommodation and Food Services 164
Horticulture and Fruit Growing 87
Building Construction 54
Construction Services 32
Total employment (all sectors) 418
* Based on business demographics for the SA2 area
aucklandnz.com24 | Waiheke Local Economic Overview 2019
24
Development Trends
| Document Title – even page header
Auckland has been undergoing a period of rapid growth
facilitated by the development of the Auckland Unitary Plan. As
Auckland grows so does the demand for accomodation and
infrastrucutre on Waiheke. Residential development in
Waiheke has seen a steady level of development as more
people are attracted to live on the island.
Context
Several mandatory plans and strategies are required by legislation to demonstrate
Auckland grows in a way that will meet the opportunities and challenges of the future.
The refreshed Auckland Plan (2018) sets the spatial vision for Auckland’s future
development through to 2050 to identify the type of city Auckland will become and how it
will accommodate its housing, economic, social and environmental needs. The Auckland
Plan identifies that Auckland may need another 313,000 dwellings and up to 263,000
extra jobs by 2050 requiring a plan for where and how people will live and how they will
access jobs, facilities and services.
Within the Auckland Plan is the Auckland Development Strategy which shows how
Auckland will physically grow and change over the next 30 years. It takes account of the
outcomes Auckland wants to achieve, as well as population growth projections and
planning rules in the Auckland Unitary Plan.
The Unitary Plan (2017) was developed to set the planning rules for:
• what can be built and where
• how to create a higher quality and more compact Auckland
• how to provide for rural activities
• how to maintain the marine environment.
303
Additional dwellings New dwellings
There were 115 new dwellings consented in 2018, which was 1.5 per cent of the 7,824
There were 303 issued in the Auckland region. The number of new dwellings consented has been at
additional dwellings increasing steadily since 2011.
in Waiheke in the
2018 Census
compared to 2013.25
25 | Document Title – even page header
NUMBER OF PRIVATE DWELLINGS (OCCUPIED & UNOCCUPIED)
5,862
5,352 5,559
2006 2013 2018
At the 2018 Census there were 2,157 unoccupied dwellings and 51 under construction.
Between 2013 and 2018 censuses there were just 303 additional dwellings in Waiheke
an increase of 5.5 per cent compared to a 6.5 per cent increase across the region.
aucklandnz.com26 | Waiheke Local Economic Overview 2019
26
Economic Development Opportunities
| Document Title – even page header
The Auckland Region aim: Develop an economy that delivers
opportunity and prosperity for all Aucklanders and New Zealand
In its current Local Board Plan the Waiheke Local Board seeks to ensure that Waiheke
develops thriving town centres and a growing local economy. The local board’s vision is
for a sustainable economy that supports positive visitor experiences and is able to
support a range of job opportunities in high value industries.
ATEED are able to provide support to local boards or groups of local boards in a number
of ways, including:
Business environmental sustainability
• Promote sustainable business practices in key areas such as waste
minimisation. Identifying the needs of local business through needs assessments
and providing implementation options.
• Provide businesses access to sustainable business coaching and sustainability
seminars.
Places
• Work alongside Panuku Development Auckland in its Transform and Unlock
areas to help identify and realise economic development opportunities in those
areas.
• Support local boards with specific place-based initiatives to help revitalise areas
and build on their unique characteristics in order to promote enhanced economic
outcomes.
Enterprise
• Manage delivery of local business programmes that provide access to business
skills where mainstream services don’t meet community need (e.g. PopUp
Business School).
• Support youth enterprise initiatives (e.g. Young Enterprise Scheme).
Economic analysis and research
• Support local boards to understand strengths, opportunities and challenges in
their areas by providing analysis of available data.
• Commissioning work to understand particular issues or opportunity a local area
may have and how and identify appropriate actions.
Leveraging local opportunities
• Support local boards to consider how they may best support local businesses to
capitalise on opportunities that may arise as a result of major events or
development projects in the region.
The table below provides our advice as to where ATEEDs local delivery can help the local
board deliver against its objectives. Where related initiatives that are delivered by other
parts of the Auckland Council family these are noted.
ATEED has been directed by Council to focus its resources on economic development
initiatives in the less prosperous areas in West and South Auckland.27
ISSUES 27 | Document Title – even page header
Waiheke has an economy driven by its attractiveness as a tourism destination which is
seasonal in nature and can create pressures on the island‘s infrastructure at peak times.
Developing this ina sustainable way to provide jobs in high value sectors is key. While a
number of residents are affluent not all sectors of the community are able to share in
prosperity which is often generated off the island.
ECONOMIC DEVELOPMENT OPPORTUNTIES
LED work stream Potential area of focus in Waiheke Local Board area
Sustainable Work with the business community to encourage and support
businesses local sustainable business practices and initiatives.
Places Work with Auckland council group and other agencies to ensure
that the benefits of tourism are maximised while any negative
impacts are minimised.
Enterprise Consider enterprise support programmes that meet the needs of
the community and support high value businesses that are
currently not met by mainstream regional programmes.
Consider ways to attract a wider range of high value job
opportunities.
Foster opportunities for young people in a range of job
opportunities.
Economic Update of Prosperity Index to keep local board informed of socio-
intelligence economic picture in their area.
aucklandnz.com28 | Waiheke Local Economic Overview 2019
28
Glossary
| Document Title – even page header
Australian and New Zealand This is the official industrial classification used by Statistics
Standard Industry Classification NZ. The classification system aims to reflect the structure
2006 (ANZSIC 2006) of Australian and New Zealand industries and enable
comparability with other countries’ statistics.
Business Areas Business areas reported are those Statistical Areas in the
Annual Business Demographics data with the largest
numbers of employees working in the area. In some cases,
the business areas cross local board boundaries.
Employment Head count of salary and wage earners sourced from
taxation data. Unless stated, does not include self-
employed.
GDP Gross Domestic Product is the total market value of goods
and services produced in the local board area, minus the
cost of goods and services used in the production process.
GDP for each local board was estimated by Infometrics Ltd
using 2010 prices.
Labour force participation The labour force is defined as all persons aged 15 years
and over who are looking for work, or are employed, either
full time, part time or casually.
Population The population for the local board area is the usual
resident population count from the 2018 Census of
Population and Dwellings. This figure may be lower than
previously published estimated 2018 population figures
from Statistics New Zealand.
Productivity The NZ Productivity Commission defines productivity as the
efficiency with which resources – such as labour and
capital – are converted into outputs of goods and services.
Unemployment rate The unemployment rate is the number of people aged 15
years and over who did not have a paid job, were available
for work, and were actively seeking work, as a percentage
of the labour force.GET IN TOUCH
──
John Norman
ATEED ECONOMIC DEVELOPMENT
E john.norman@aucklandnz.com
aucklandnz.com/business
aucklandnz.comYou can also read