Impacts of the COVID-19 crisis and national responses on European railway markets in 2020 - July 2021
←
→
Page content transcription
If your browser does not render page correctly, please read the page content below
Impacts of the COVID-19 crisis and national
responses on European railway markets in 2020
                   July 2021
Introduction
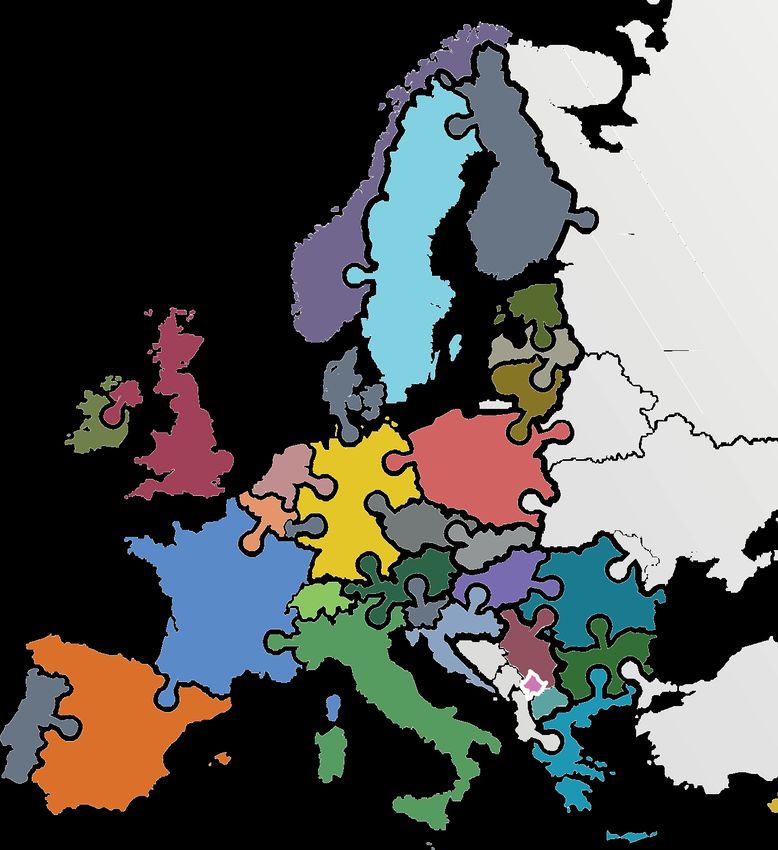
Participating countries
AT - Austria LV - Latvia
BE - Belgium LT – Lithuania
BG - Bulgaria NL - Netherlands
HR - Croatia NO - Norway
CZ – Czech Republic PL - Poland
EE - Estonia PT - Portugal
FI - Finland RO - Romania
FR - France RS – Serbia
DE - Germany SK - Slovakia
GR – Greece SI - Slovenia
HU - Hungary ES - Spain
IE - Ireland SE - Sweden
IT - Italy UK - United Kingdom
SCOPE CONTENT OF THE REPORT
Qualitative impacts of the COVID-19 crisis
The rail passenger market
26 2019 2020
changes The rail freight market
countries
Train departures
Analysis of the temporal
impacts of the COVID-19 Punctuality of trains
pandemic throughout 2020
+ separate Excel dataset
IRG-Rail publications to monitor the COVID-19 impacts
May 2020 April 2021 July 2021 April 2022
▼
IRG-Rail statement1: 9th Market Monitoring Impacts of the COVID-19 10th Market Monitoring
“European rail regulators Report2 – Focus on crisis and national responses Report : global annual
contribute to the recovery COVID-19 impacts in the on European railway and five-year changes on
from the COVID-19 crisis” first 6 months of 2020 markets in 2020 European railway markets
1https://irg-rail.eu/irg/news/press-release/264,European-rail-regulators-contribute-to-the-recovery-from-the-COVID-19-crisis.html
2https://irg-rail.eu/irg/documents/market-monitoring/312,2021.html
2 // Impacts of the COVID-19 crisis on 2020 railway markets
01 // Introduction

IRG-Rail – A network of cooperation
The Independent Regulators’ Group-Rail (IRG-Rail) was established by 15 European rail regulatory bodies in
June 2011. From the beginning, the objective of the group has been to establish a network of cooperation
between member regulatory organizations in the railway sector. The group has expanded over the years and
today includes members from 31 countries.
IRG-Rail members aim to consistently deal with regulatory challenges and rail developments across Europe.
IRG-Rail acts as a platform for cooperation, sharing best practice and promoting a consistent application of the
European regulatory framework. As put forward in the Group’s statutory document3, “the overall aim of IRG-Rail
is to facilitate the creation of a single, competitive, efficient and sustainable railway market in Europe”.

            what we do
             Article 56 (paragraph 2) of Directive 2012/34/EU states that regulatory bodies have a formal duty to monitor the
             situation in the railway market. Market monitoring is therefore an essential task for the national regulatory bodies. It is
             also a vital instrument for enhancing market transparency, setting direction for the activities of regulatory bodies and
             encouraging market participants to develop and improve their activities.

             General aim of IRG-Rail Market Monitoring Working Group
                                  The IRG-Rail Market Monitoring Working group was set up as a platform for cooperation and
                                  exchange of best practices in terms of collection and analysis of data. The group has agreed on a
                                  set of guidelines4 for gathering railway related data. Based on the results of a yearly collection, an
                                  annual Market Monitoring Report is elaborated by the Working Group.
                                  The Ninth IRG-Rail’s Market Monitoring Report was published in April 2021. It provides an annual
                                  overview of market developments and the economic conditions in the railway sector in 2019 with
                                  respect to IRG-Rail member countries. The report also enables comparison over time regarding
                                  the development and competitiveness of the railway market.

             A specific analysis of the impacts of the COVID-19 pandemic
                                  The coronavirus (COVID-19) pandemic significantly impacted European railway markets due to its
                                  effect on the global mobility of European passengers and freight transport in 2020. In line with
                                  regulatory bodies’ responsibility to monitor their respective markets, this publication provides an
                                  annual overview of the consequences of the COVID-19 pandemic on rail markets observed in 2020
                                  (compared with 2019). This publication examines changes in rail traffic and demand (for freight
                                  and passenger services), quality of service (punctuality of trains), and additional impacts and
                                  specific measures adopted for the rail sector by countries to mitigate the impacts and to ensure the
                                  public health.
                                  This overview is based on data collected by IRG-Rail in 2020 and 2021 focusing on indicators
                                  which highlight the impact of the pandemic during 2020. The data from the graphics are available
                                  on the IRG-Rail website5.

            Methodology
                                  It is the responsibility of each regulatory body to gather, quality-assure and submit data according
                                  to the guidelines agreed upon by the Working Group. The Working Group has developed a common
                                  template in order to ease the effort for the regulatory bodies and to ensure the comparability of the
                                  data. Data can originate from market surveys carried out by the regulatory bodies and/or national
                                  statistics as well as additional trustworthy sources. In the case of this specific publication and due
                                  to the early date for data collection of the COVID-19 impacts in 2020, several statistics gathered
                                  from countries are based on estimations. All data might be updated and consolidated and must be
                                  considered temporary for this publication.
                                  Twenty-six countries contributed to this Report. However, most countries were not able to provide
                                  complete data. In order to ensure reliable and consistent information, this report only presents
                                  indicators for which enough data was made available. Consequently, some analyses are performed
                                  using data from a selection of the participating countries. In each section of the report, key figures
                                  and analyses presented use a consistent sample of countries. Therefore, some sections may not
                                  cover all 26 countries. Detailed information and specific data by country are provided as well in
                                  each section of this publication.

3
  https://www.irg-rail.eu/irg/about-irg-rail/general-information/About-the-IRG-Rail.html
4
  The guidelines can be found on IRG-Rail website.
5
  The data can be found here.

                                                                                           Impacts of the COVID-19 crisis on 2020 railway markets // 3
01 // Introduction

                The COVID-19 crisis has significantly impacted the EU transport system in 2020. The spread of the virus has led to
                restrictions of international and domestic travels and has caused a global decline in the demand for passenger transport
                while allowing rail transport to still provide crucial services. This has also been the case for the transportation of goods
                despite a global setback of the economic activity as well for freight transport.
                This led to decreases in 2020 for transport demand in general, of about -48% for annual passenger-km and of -7%
                for freight tonne-km. The smaller decline of rail transport supply (-8% for departures for passenger trains
                and -6% for freight trains) mostly concerned the second quarter of 2020. Rail freight transport even showed an
                increase in comparison with 2019 during the last quarter of the year. In parallel to this drop in rail transport activity, the
                punctuality of rail transport showed improvement during all quarters of 2020 for both passenger and freight services.
                Despite the application of temporary or permanent measures adopted to limit the impact of the pandemic on the railway
                sector (among which the adjustments of track access charges or state aids), the railway undertakings suffered direct
                economic consequences of this drop of rail activities. At the date of publication of this report the consolidated financial
                impacts in revenues have not been collected by IRG-Rail. The first results presented in the 9th Market Monitoring Report
                of IRG-Rail (temporary indicators based on a reduced panel of countries who could provide the data) showed global
                decreases for most countries during the first six months of 2020 of both passenger and freight revenues. The European
                infrastructure managers also recorded decreases of the access charges (from RUs and subsidies) collected for the first
                semester, with substantial differences between countries though.
                This is the second IRG-Rail publication of 2021 focusing on the impacts of the COVID-19 pandemic after the publication of
                the 9th Market Monitoring report. IRG-Rail will continue to closely monitor these impacts and responses for 2020 as well
                as for the coming years to assess how the European railway markets recover from the COVID-19 crisis. To support this
                work, IRG-Rail will publish its 10th Market Monitoring report in early 2022. This will include a complementary analysis
                (including financial analysis) and a more complete overview of key rail indicators.

                                                Impacts of COVID-19 on
                                                  European Railways
Passenger services
                                                Passenger-km                                  Departures                                Punctuality

          Full year                                ▼48%                                       ▼8%                                  ▲2.3 pp
                                                    (24 countries)                             (23 countries)                             (20 countries)

                                              Q1      Q2      Q3       Q4                Q1      Q2      Q3       Q4               Q1       Q2      Q3      Q4
          Quarterly                                                                     -3%              -4%      -1%                      4,2pp
                                             -16%                                                                                 0,9pp            2,0pp 2,8pp
                                                                                                -25%
                                                             -42%
                                                                      -55%
                                                     -76%

Freight services
                                             Freight tonne-km                                 Departures                                Punctuality

          Full year                                 ▼7%                                       ▼6%                                  ▲4.0 pp
                                                    (23 countries)                             (24 countries)                             (17 countries)

                                              Q1      Q2      Q3       Q4                Q1      Q2      Q3       Q4               Q1       Q2      Q3      Q4

          Quarterly                                                    4%                                         2%                       6,1pp
                                                                                                                                  4,1pp
                                                                                                                                                   3,1pp   3,0pp

                                             -9%              -7%                       -7%              -6%
                                                     -15%                                       -14%

   Notes: All comparisons are for 2020 compared with 2019. The number of IRG countries are provided under each metric in brackets. Punctuality is measured by the
          percentage of trains that arrived on time. The threshold used is based on the national thresholds applied for this statistic (see Chapter 6 for details).

4 // Impacts of the COVID-19 crisis on 2020 railway markets
02
                                                         Qualitative impacts
                                                       of the COVID-19 crisis
                                                              and responses

  Impacts and measures 2020

        2 main phases of
           impacts :                                            194 days
                                                                   €4.22
                                                          on average with                               13 / 26 states
                                                           requirements
                                                            average TAC/                           provided financial aids
  23Feb.|31Mar. –► 30Jun.
                                                        recommendations
                                                             per train-km to                              to RUs
   Mid Oct. –► Dec. 2020                                    stay at home

The sample used to calculate these figures is specified in the following pages.

                                                                                  Impacts of the COVID-19 crisis on 2020 railway markets // 5
02 // Qualitative impacts of the COVID-19 crisis and responses

    Global restrictions on rail transport demand
                                                      Figure 1 – Calendar of “Stay at home” requirements/recommendations per country6
The COVID-19 pandemic affected all
European countries during the majority                                   1 Jan   31 Jan 1 Mar   1 Apr     1 May   1 Jun   1 Jul   1 Aug 31 Aug 1 Oct     31 Oct 1 Dec 31 Dec
of 2020. From March 2020, most                                       Italy                23 Feb
                                                               Denmark                       3 Mar
countries implemented strict measures                   The Netherlands
                                                               Germany
                                                                                                12 Mar
                                                                                               9 Mar
of confinement or restrictions on                               Hungary
                                                               Romania
                                                                                                12 Mar
                                                                                                12 Mar
internal movement, resulting in a                               Slovakia
                                                                 Kosovo
                                                                                                12 Mar
                                                                                                13 Mar
major drop in global mobility in all                                Latvia
                                                                       UK
                                                                                                13 Mar
                                                                                                13 Mar
countries. This affected demand for rail                        Slovenia                         14 Mar
                                                                    Spain                        14 Mar
transport, as well as other modes of                     Czech Republic                          15 Mar
                                                                   Serbia                        15 Mar
transport.                                                        Austria                         16 Mar
                                                                 Finland                          16 Mar
                                                               Lithuania                          16 Mar
                                                                  France                          17 Mar
                                                            Luxembourg                            17 Mar
In most cases, restrictive measures on                       Switzerland                          17 Mar
                                                                Belgium                            18 Mar
internal movements lasted for the                               Bulgaria                           18 Mar
                                                                Portugal                           19 Mar
entirety of the second quarter of 2020.                           Croatia
                                                                  Greece
                                                                                                    23 Mar
                                                                                                    23 Mar
A second phase of strict measures was                           Sweden
                                                                  Ireland
                                                                                                     25 Mar
                                                                                                     26 Mar
seen in several countries during the                             Estonia
                                                                  Poland
                                                                                                      29 Mar
                                                                                                       31 Mar
last quarter of 2020.                                            Norway                                                                                        5 Nov
                                                                                      lockdown measures with exceptions           recommendations not leaving house

                                                                                                                   Figure 2 – Number of days in 2020 with “stay
     There were differences in lockdown measures and their impact on rail transport                                at home” requirements/recommendations6
     demand:
     •       The implementation of measures to specific train services. In several countries there
             was no regulatory restriction on the transport of goods, and some freight services
             even saw an increase in their demand for domestic distribution (e.g. UK).
     •       The implementation by geographical region. Some internal restrictions on movement
             varied at a regional level, as well as for national and international travels. This was
             the case for example in Italy, UK and Germany.
     16 countries reintroduced land, air and sea border control in light of the COVID-19
     pandemic, banning or at least restricting international movements.

         The drop in passenger demand due to lockdown measures and transport
         restrictions imposed by the national authorities had a direct impact on the
         economy of the railway sector, with the partial or complete shutdown of several
         railway activities (in particular international services)

         Other derived impacts have also been observed by railway undertakings
         (RUs) or the infrastructure managers (IMs) as a result of the pandemic:

         •    Limitation of the capacity of transport: some countries implemented rules to limit the capacity of passenger trains by as
              much as 50% or 40% (e.g. Croatia, Italy, France, Portugal, Spain), to prohibit the sale of more tickets than the
              available seats (e.g. Denmark), or to close train stations with short platforms where no social distancing could be
              maintained (UK);
         •    Timetable adjustments: reduced timetables were put in place (e.g. Austria, Belgium, Finland, Italy, Norway,
              Slovakia, UK) especially for PSO services, with the aim of ensuring minimal passenger services and essential connections
              or a higher reliability of train services, or allowing more capacity for freight services. The scheduled timetable was
              maintained during large parts of the year in Portugal, Sweden in order to avoid congestion on board trains. For freight
              transport the conditions of proposal of alternative rail/road PSO services were facilitated in some countries (e.g. Poland);
         •    The implementation of additional sanitary measures to prevent the spread of the virus was adopted by several RUs in
              Europe, leading to potential additional costs. In Finland new services were put in place to allow the purchase of an empty
              adjoining place or a cabin for your own use.
         •    A temporary relaxation of legal terms for passenger ticket change, cancellation, extension of the validity period, or
              refunding of season tickets were adopted in Austria, Finland, France, Germany or UK. An extension of the validity
              period of legal documents of RUs (e.g. safety certificate and train driving licence, deadlines for staff training) was adopted
              in some countries (e.g. Poland, Spain);
         •    A decrease of tariffs for wagon rentals due to the decrease in freight transportation was also noted by RUs in Estonia;
         •    The suspension of planned rail maintenance by infrastructure managers was noted in some countries (e.g. Belgium) due
              to subcontractors being unavailable. Other countries (e.g. Austria) indicated that due to reduced traffic the main
              infrastructure manager was able to focus on construction and maintenance work.
6 Source: Oxford COVID-19 Government Response Tracker, indicator C6 “Stay at home requirements”. The indicator records orders (either requirements or
recommendations) to “shelter-in-place” and otherwise confine to the home.

6 // Impacts of the COVID-19 crisis on 2020 railway markets
02 // Qualitative impacts of the COVID-19 crisis and responses
Response measures adopted in 2020
Some temporary or permanent financial measures were Regulation (EU) 2020/1429 establishing
adopted in 2020 to limit the impact of the pandemic on the measures for a sustainable rail market in
railway sector by the states or infrastructure managers: view of the COVID-19 outbreak
• Adjustment of track access charges: six countries noted On October 7th, 2020, regulation (EU) 2020/1429
adjustments in the charging principles applied by infrastructure establishing measures for a sustainable rail
managers for rail activities. These adjustments could be applied as market in view of the COVID-19 outbreak was
raw discounts of global or specific charges, the postponing of the adopted. This regulation includes temporary
invoicing, or as changes of the references for charges or discount measures to help the railway sector to face the
impacts of the COVID-19 pandemic. It enables
schemes to take into account the sudden decrease of volumes. Member States to authorise infrastructure
Several infrastructure managers also decided to apply a relaxation managers to remove, postpone or lower the
of cancellation charges or reservation penalties. charges for access in rail infrastructure during the
• State aids to railway undertakings have been provided in various pandemic, while ensuring state aids to the IMs
for this loss of revenue. This temporary
ways to limit the impacts for the railway sector, as a funding of
regulation which substitutes to the actual
track access charges (three countries), and 13 RBs noted a raw European regulatory framework for track access
compensation of loss of revenue (with possible incentives) or as an charges, first applied during a period of reference
increase of public subsidies. 16 countries also granted temporary going from March 1st 2020 until December 31th
unemployment aid and subsidised loans, or the postponement of 2020, but has been extended until June 30th 2021
public charges or debts. Temporary PSO contracts have been by Commission delegated regulation (EU)
granted as well in two countries. 2020/2180 of December 18th, 2020.
• State aids to the infrastructure managers or specific funding and At the time of the publication, several countries
incentives for infrastructure projects (or direct capital increase) considered applying for 2020 or 2021 specific
were also granted in specific countries to compensate for their loss national regulations in line with Regulation (EU)
2020/1429, but no country directly applied this
of revenue.
European regulation.
Figure 3 – Financial measures adopted by states or infrastructure managers by category
Adjustment of Track Access Charges (TAC) and
State aids to the railway undertakings or infrastructure managers
cancellation/reservation charges
Relaxation of Compensation Compensations Loan facilities, credit
Changes Changes Temporary
Postponing cancellation for the loss of for the loss of Temporary guarantees, or
of the of the Fundings unemployment
of the charges / revenue for the revenue for the PSO postponing of public
level of reference of TAC aid and short-
invoicing reservation infrastructure railway contract charges or debts (or
TAC for TAC term work
penalties manager undertakings “tax vacation”)
Austria x x x x x
Belgium x x x
Bulgaria
Croatia x x x
Czech Republic
Estonia x x
Finland x x
France x x x
Germany x x x x x x
Greece x
Hungary x x
Ireland
Italy x x x x x x x
Latvia x
Lithuania x
Netherlands x
Norway x x x x x
Poland x x x
Portugal x
Romania x x x x
Serbia
Slovakia x
Slovenia x x
Spain x x x
Sweden x x x x
UK x x
This overview of global impacts and measures taken by States / Regulatory bodies / Infrastructure managers is based on
free text-field answers collected by IRG-Rail at the end of 2020 and the beginning of 2021 focusing on indicators which
highlight the impact of the pandemic during 2020. This section aims to show a collection of factors cited by countries but
does not represent an exhaustive overview of impacts and measures observed for every country in the panel.
The complete answers to these qualitative questions can be found in the dataset published with the report.
Impacts of the COVID-19 crisis on 2020 railway markets // 7
03
The rail passenger market
2019 2020 comparison
[-25% to -65%]
passenger-km
for PSO services
-11% -48% [-41% to -93%]
passenger-km
train-km passenger-km for non-PSO services
The sample used to calculate these figures is specified in the following pages.
8 // Impacts of the COVID-19 crisis on 2020 railway markets
03 // The rail passenger market in 2020

               Passenger traffic - A decrease of almost 50 %
               compared with 2019
                •   Passenger traffic indicates a severe shortfall in 2020 because of the COVID-19 pandemic. All of the 24 countries
                    providing data showed a negative difference between 2019 and 2020.
                •   Passenger-km came down from 419 billion in 2019 to 217 billion in 2020 which was an average decrease of
                    48%, ranging from -26% to -65%.

Figure 4 – Change in passenger-km, comparison 2020/2019

 -65%                                                           Ireland
 -65%                                                           UK
        -59%                                                    Spain
        -59%                                                    Netherlands
           -55%                                                 Belgium
             -54%                                               Norway
                -49%                                            Greece
                 -49%                                           Portugal
                 -48%                                           Total IRG-Rail
                  -47%                                          Slovakia
                   -46%                                         Lithuania
                    -46%                                        Sweden
                    -46%                                        Austria
                      -43%                                      Slovenia
                       -43%                                     Finland
                       -43%                                     Poland
                        -42%                                    Germany
                         -41%                                   France
                          -41%                                  Czech Republic
                            -39%                                Croatia
                             -37%                               Hungary
                                -34%                            Romania
                                -34%                            Latvia
                                 -33%                           Estonia
                                        -26%                    Bulgaria

  A total of 2.9 billion passenger train-km were recorded for the    well), PSO services were partly or fully maintained by public
 25 countries which submitted data. This was a 11% reduction         authorities to guarantee a minimum access to public transport.
 from 3.2 billion passenger train-km in the previous year. This      Passenger train-km fell in all countries, apart from Hungary
 drop can be attributed to a reduced number of trains in many        (increased by 1%). In Hungary, operators were not requested
 countries. However, in several countries such as Germany,           to significantly reduce their PSO services in order to ensure safe
 Austria, Bulgaria (and possibly other European countries as         travel on trains.

          Figure 5 – Change in passenger train-km,
                                                                      -23%                                            Slovenia
          comparison 2020/2019
                                                                        -22%                                          Italy
                                                                          -21%                                        Greece
                                                                           -21%                                       France
                                                                             -19%                                     UK
                                                                               -17%                                   Serbia
                                                                                -16%                                  Croatia
                                                                                 -15%                                 Ireland
                                                                                    -13%                              Lithuania
                                                                                      -12%                            Sweden
                                                                                       -11%                           Portugal
                                                                                       -11%                           Total IRG-Rail
                                                                                        -10%                          Norway
                                                                                          -9%                         Romania
                                                                                           -9%                        Netherlands
                                                                                            -8%                       Slovakia
                                                                                             -7%                      Finland
                                                                                              -7%                     Belgium
                                                                                               -6%                    Poland
                                                                                               -6%                    Austria
                                                                                                 -5%                  Estonia
                                                                                                   -3%                Czech Republic
                                                                                                     -2%              Bulgaria
                                                                                                      -1%             Germany
                                                                                                      -1%             Latvia
                                                                                                            1%        Hungary

                                                                         Impacts of the COVID-19 crisis on 2020 railway markets // 9
03 // The rail passenger market in 2020

             Passenger services – The drop for passenger traffic was
             greater for non-PSO services in most countries
                 For PSO-traffic, passenger-km in 19 countries                    PSO. In the majority of countries, the drop between
                decreased from 228 billion in 2019 to 119 billion in              2019 and 2020 ranges from -30 to -50%. This is
                2020, a fall of nearly 50%. The largest decreases were            because, even if trains kept running in some countries,
                in Ireland and the UK. In Austria, from April 2020                there was a large reduction in passengers due to "stay
                onwards, long-distance trains from Vienna to Salzburg             at home" recommendations of the governments.
                (including incumbent’s trains) were temporarily made

                                                           Figure 6 – Change in PSO passenger-km, comparison 2020/2019

                                                                         -65%                                              Ireland
                                                                         -65%                                              UK
                                                                                -54%                                       Belgium
                                                                                   -49%                                    Spain
                                                                                   -49%                                    Greece
                                                                                    -48%                                   Total IRG-Rail
                                                                                    -48%                                   Slovenia
                                                                                      -44%                                 Portugal
                                                                                        -41%                               Finland
                                                                                        -41%                               France
                                                                                          -39%                             Germany
                                                                                          -38%                             Croatia
                                                                                           -37%                            Czech Republic
                                                                                           -37%                            Hungary
                                                                                             -34%                          Romania
                                                                                              -32%                         Latvia
                                                                                               -31%                        Lithuania
                                                                                                -29%                       Estonia
                                                                                                 -29%                      Austria
                                                                                                   -25%                    Bulgaria

             For non-PSO traffic, passenger-km in 17 countries                  borders and therefore were the first to be stopped when
            decreased from 128 billion in 2019 to 66 billion in 2020,           countries announced their lockdown measures. As an
            meaning that half of the non-PSO traffic was eliminated.            exception, Slovenia showed an increase in non-PSO traffic
            The drop exceeded 50% in 13 of the 17 countries and                 in 2020. The reason for such an increase was the
            even 80% in four countries. In some countries, such as              introduction of several non-PSO international tourist trains
            Estonia, Finland and Latvia non-PSO services stopped                from Czech Republic and Slovakia via Slovenia to Croatia.
            running entirely. Moreover, in many countries non-PSO               These trains ran predominantly during the summer
            services are international trains which have to cross               months to Rijeka.

                                                         Figure 7 – Change in non-PSO passenger-km, comparison 2020/2019

                                                               -93%                                                   Estonia
                                                               -88%                                                   Austria
                                                                  -81%                                                Finland
                                                                  -81%                                                Lithuania
                                                                   -79%                                               Latvia
                                                                      -72%                                            UK
                                                                       -71%                                           Portugal
                                                                        -70%                                          Croatia
                                                                        -70%                                          Bulgaria
                                                                          -66%                                        Spain
                                                                           -65%                                       Belgium
                                                                            -62%                                      Czech Republic
                                                                             -61%                                     Greece
                                                                                 -49%                                 Total IRG-Rail
                                                                                  -47%                                Germany
                                                                                    -43%                              Hungary
                                                                                     -41%                             France
                                                                                                                +258% Slovenia

10 // Impacts of the COVID-19 crisis on 2020 railway markets
03 // The rail passenger market in 2020
The occupancy rate (pass-km/train-km) dropped by
more than 40% on average – Q2 was the most
affected quarter
Figure 8 – Change in passenger-km per train-km, comparison 2020/2019
As a result of the -59% Ireland
decreasing train-km and -57% UK
reduced passenger-km, the -55% Netherlands
derived ratio of these two -52% Belgium
indicators decreased by -49% Norway
42% on average for the 23 -43% Slovakia
countries providing data. -42% Portugal
While the downturn of the -42% Total IRG-Rail
occupancy rate can be -42% Austria
partly explained by the -42% Germany
strictness of the -39% Czech Republic
lockdown/"stay at home" -39% Poland
restrictions, other factors -39% Finland
such as changes in mobility -39% Sweden
behaviour could also have -38% Hungary
played a role in this -38% Lithuania
decrease. -36% Greece
-33% Latvia
-30% Estonia
-27% Romania
-27% Croatia
-26% Slovenia
-26% France
-25% Bulgaria
Railway undertakings in all monitored countries started off in 2020 with large growth
rates for their passenger traffic (except for France due to a strike). All countries
were then severely impacted by the pandemic when governments were forced to
impose lockdown measures in March, April and May. Some countries, such as Italy
or France, only reached one fifth of the traffic in passenger train-km compared with
the previous year, while in Slovenia and Serbia all passenger services were
suspended in April. On average in all monitored countries, train-km dropped by 42%
in April and almost 30% in way undertakings May. With several of these measures
being upheld throughout the year, only a few countries managed to recover their
traffic. Due to another lockdown at the end of 2020, most European countries’ Figure 9 – Change in passenger train-km,
railway undertakings faced another downturn but not as heavy as in the Q2 2020. monthly comparison
Jan Feb Mar Apr May Jun Jul Aug Sep Oct Nov Dec
Slov enia +7% +12% -48% -100% -66% -3% +6% +8% +8% +2% -58% -48%
Italy +2% +4% -43% -74% -58% -28% -9% -8% -6% -6% -17% -23%
Greece +3% +5% -26% -76% -48% -21% -4% -1% -5% -1% -35% -43%
France -28% +6% -39% -84% -61% -32% -8% -4% -2% +4% -31% +133%
Serbia -5% +11% -35% -100% -48% -2% -7% -9% -5% +0% -2% -9%
Lithuania +11% +14% +4% -34% -28% -22% -18% -11% -10% -10% -20% -28%
0%
Sweden +2% +5% -2% -23% -27% -20% -14% -13% -9% -10% -8% -21%
Portugal +2% +5% -9% -40% -22% -7% -11% -7% -6% -9% -12% -12% -20%
IRG -3% +4% -16% -42% -29% -11% -5% -4% -1% -1% -9% +7%
-40%
Slov akia -0% +4% -16% -30% -18% -7% +1% -3% -5% -7% -7% -5%
Finland +6% +9% +0% -9% -26% -18% -14% -8% -6% -6% -6% -4% -60%
Belgium -0% +4% -14% -44% -12% -3% -4% -2% -0% -2% -3% +2%
-80%
Poland +7% +10% -7% -32% -29% -14% -4% -4% +1% -0% -1% -2%
Estonia +6% +9% +2% -31% -27% -16% -8% -6% +4% +3% +6% +3%
Czech Republic +4% +6% -5% -21% -15% -6% +2% +2% +1% +0% -2% -1%
Germany +3% +1% -2% -17% -7% +7% -4% -2% +2% -1% +0% +8%
Latv ia +4% +8% +1% -5% -5% -4% -1% -1% -1% -1% -1% -3%
Impacts of the COVID-19 crisis on 2020 railway markets // 1104
The rail freight market
2019 2020 comparison
-5%
train-km
-7% tonne-km
Changes in freight train-km, monthly comparison
Jan Feb Mar Apr May Jun Jul Aug Sep Oct Nov Dec
4%
6% [-47% to +16%] among countries
1% 1%
-8%
-6%
-8%
-5%
-8%
0%
-1% change in freight load
factor (tonne-km/train-km)
-17%
-19%
The sample used to calculate these figures is specified in the following pages.
12 // Impacts of the COVID-19 crisis on 2020 railway markets04 // The rail freight market in 2020
Freight traffic – Mixed impact throughout Europe with
5% global decrease compared with 2019
In general, freight traffic was much less affected by the COVID-19 pandemic than passenger traffic in 2020. In some countries, freight
services were prioritised amid the contraction of passenger traffic. In the 23 monitored countries a total of 386.6 billion net tonne-km
were transported. This was a decrease of 7% compared to 2019, with a total of 413.8 billion net-tonne km. The differences between
the monitored countries are significant (and often similar in tonne-km and train-km). In Latvia, freight traffic decreased in tonne-km
by 47%. Estonia also experienced a severe drop by 18%. Most countries experienced decreases, but net tonne-km actually increased
in Bulgaria, Greece, Croatia and Hungary. Portugal and Norway showed a strong growth in freight train-km while recording a decrease
in net tonne-km at the same time.
Figure 10 – Change in freight train-km, comparison 2020/2019
A total of 732.2 million freight train-km
were recorded for the 26 countries that
32% Portugal submitted data. This was a 5%
17% Norway reduction from 771.7 million freight
11% Greece
11% Croatia train-km in 2019.
4% Bulgaria
3% Ireland
1% Serbia
-1% Germany As the GDP of the EU fell by roughly 4.8% in
-2% Lithuania 2020 according to EUROSTAT, the reduction
-3% Sweden
-4% Italy of freight train-km can at least partly be
-5% Slovenia explained by the general drop in economic
-5% Total IRG-Rail activity due to the COVID-19 crisis. Although
-5% Finland
-6% Netherlands the total IRG-Rail average development in
-6% Poland freight train-km is quite close to the
-7% Romania development of the EU GDP, the development
-7% Austria
-7% Hungary in single countries varies widely: from a rise of
-7% Slovakia 32% in Portugal to a decrease of 43% in
-8% Czech Republic
-10% Belgium Latvia. Seven countries reported an increase
-11% UK in freight train-km, while 19 out of 26
-11% France countries registered a decrease.
-14% Spain
-20% Estonia
-43% Latvia The sharp drop in Latvia can be explained by
a substantial increase in 2019 due to the
closure of a large coal terminal in Russia,
which led to a diversion of the cargo to other
In 2020, a total of 386.6 billion net ports, i.e. in Latvia. As the Russian coal
tonne-km were recorded for the 23 terminal reopened in 2020, Latvian cargo
countries that submitted data. This was decreased again. Furthermore, Russian
a 7% reduction from 413.8 billion transports through Latvia decreased due to
net tonne-km in 2019. sanctions imposed on Russia.
This fall can be attributed to a reduction in freight Figure 11 – Change in net tonne-km, comparison 2020/2019
services during the pandemic and closed borders
between some countries, especially during Q2 2020. 16% Bulgaria
14% Greece
Globally, the international supply chain was
12% Croatia
disrupted due to grounded planes and some cargo 2% Hungary
ships were denied entry to ports. This disruption -1% Finland
could have had an effect on rail freight. -1% Sweden
-2% Lithuania
Net tonne-km decreased in 2020 in 19 out of 23 Portugal
-4%
reported countries, while four countries (Bulgaria, -4% Germany
Greece, Croatia and Hungary) recorded an increase. -5% Czech Republic
The increase in Croatia can mainly be attributed to -5% Netherlands
an increase in cereal exports from Hungary to Italy -6% Norway
that have been transported through Croatia. Other -6% Austria
goods’ transportation such as wood from Hungary -7% Total IRG-Rail
to Italy via Croatia as well as container transports -7% Poland
-7% France
from Hungary to Croatian ports also played a role in
-7% Slovenia
the increase. For Hungary especially, international -8% Slovakia
transport led to a growth: in 2020, four new railway -9% Belgium
undertakings that are mainly active in international -10% UK
transport entered the market. The increase for -14% Spain
Greece can also be explained by a new railway -15% Romania
undertaking that started operating in 2018 and -18% Estonia
since then gradually developed its work. -47% Latvia
Impacts of the COVID-19 crisis on 2020 railway markets // 1304 // The rail freight market in 2020
The freight net tonne-km per train-km remained stable
in Europe in 2020 (-1%) – moderate month-on-month
decreases in traffic throughout 2020
Figure 12 – Change in net tonne-km per freight train-km, comparison 2020/2019
The graph on net tonne-km per
train-km shows the development of
12% Bulgaria
Hungary
weight-intensity of the driven freight
10%
5% France km. Although the overall IRG-Rail
4% Finland average of the 23 countries that
3% Czech Republic submitted data seems relatively
3% Greece constant (decrease of 1% vs. 2019),
2% Estonia the development varies widely
1% Sweden between the countries. While
1% Austria Bulgaria reported an increase of
1% Croatia
12%, Portugal showed a decrease of
1% UK
1% Belgium 27%. This could suggest that the
0% Netherlands structure of the transported goods
0% Lithuania has changed either to heavier goods
0% Spain that led to a higher load factor (i.e.
-1% Poland Bulgaria), or towards lighter goods
-1% Slovakia that led to a lower load factor (i.e.
-1% Total IRG-Rail Portugal). For Norway, the
-2% Slovenia
development can be explained by
-3% Germany
Latvia
the increase in transport of light
-7%
-9% Romania intermodal goods, such as food and
-19% Norway packages, while simultaneously
-27% Portugal heavy industrial transportation such
as lumber, iron, cars and airplane
fuel decreased. Eight out of 23
countries showed a downturn in net
The heatmap shows that the decrease of freight train-km on average for the shown 17 tonne-km per train-km, while in 15
countries was strongest in April and May, where we observe a decrease of 19% and countries stable results or increases
17% respectively compared to 2019. The decreases were moderate from June to were observed.
September before a growth in freight traffic was observed during the last quarter of
the year.
National development varies widely: from a sharp fall in Latvia in June (-56%) to a
strong rise in Portugal (+66%) in February. The hike of +150% in France in December
is strongly influenced by a strike that led to a very low value in December 2019. The
months most affected were April and May: In April, all but two countries show a
decrease- in May, all but three countries. November and December saw the strongest
increases: In November, 10 out of 17 countries had increases in freight train-km, while Figure 13 – Change in freight train-km,
in December there were increases in 13 countries. monthly comparison
Jan Feb Mar Apr May Jun Jul Aug Sep Oct Nov Dec
Latv ia -51% -48% -48% -45% -45% -56% -42% -39% -38% -37% -32% -23%
Estonia -27% -30% -26% -26% -24% -23% -19% -1% -20% -18% -13% -5%
France -23% -6% -22% -35% -30% -10% -10% -14% -10% -11% -4% +150%
UK -0% +1% -11% -29% -27% -19% -14% -11% -10% -4% -2% +3%
Belgium -6% +1% -14% -25% -27% -12% -14% -10% -5% -9% -2% +15%
Czech Republic -10% -4% -10% -20% -17% -9% -9% -11% -3% -2% -1% +6%
Slov akia -15% -12% -12% -16% -14% -13% -6% -3% -7% -1% +4% +14% 0%
Poland -12% -6% -15% -20% -12% -8% -7% -2% +2% -3% +4% +12%
-20%
Finland -5% -27% -6% -2% +0% -3% -10% -8% -5% -4% +5% +2%
IRG -8% +1% -6% -19% -17% -8% -5% -8% -0% +1% +4% +6% -40%
Slov enia -4% -4% -8% -14% -12% -3% -12% -10% -3% +2% +3% +5%
-60%
Italy -1% +5% -11% -30% -23% -11% -2% -0% +1% +8% +13% +13%
Sweden -1% +2% -1% -7% -8% +3% -3% +0% -2% -7% -2% -6% -80%
Lithuania -18% -6% -7% -7% -5% -5% -7% +2% +10% +8% +5% +6%
Germany -3% +9% +5% -15% -15% -5% +0% -10% +6% +9% +8% -7%
Serbia -2% +14% -4% -6% -9% +2% +2% +7% -4% +1% +5% +3%
Greece +23% +34% -16% +21% +8% -1% +12% +4% +0% +2% +20% +34%
Portugal +51% +66% +2% +27% +41% +27% +27% +27% +43% +29% +14% +46%
14 // Impacts of the COVID-19 crisis on 2020 railway markets05
Train departures
2019 2020 comparison
-8% passenger train departures -40%
[-30% 0%] among countries
to
largest monthly
drop of
-6% freight train departures departures
observed in
[-37% to +24%] among countries April 2020
The sample used to calculate these figures is specified in the following pages.
Impacts of the COVID-19 crisis on 2020 railway markets // 1505 // Train departures in 2020
The passenger train departures fell by 8% on
average in 2020, with largest drop of 40% in April
Figure 14 – Change in passenger train
departures, comparison 2020/2019 -30% Slovenia
-22% Lithuania
-18% Italy
The number of passenger trains fell -18% Croatia
-17% Estonia
during 2020, particularly from March to
-17% UK
June when widespread restrictions France
-16%
were imposed in most countries. -15% Ireland
During 2020 there were 34.4 million -13% Serbia
-12% Greece
passenger trains running in 23
-9% Norway
countries. This was a decrease of 8% -8% IRG-Rail
compared to 2019, when 37.6 million -8% Poland
passenger trains ran. This shows that -8% Romania
many countries were running reduced -7% Sweden
timetables. Capacity of trains had to be -6% Portugal
reduced to meet social distancing -6% Slovakia
restrictions, and the number of trains is -6% Belgium
not directly linked to passenger -3% Finland
-3% Austria
numbers (which fell by 48%).
-2% Hungary
During the first wave of the pandemic -1% Bulgaria
from March 2020, services were kept 0% Latvia
running for the use of key workers. 0% Germany
Service numbers were adjusted in
stages as restrictions were relaxed.
Looking at the full year, 22 of the participating countries Although the number of departures increased in some countries
experienced a fall in passenger train numbers. In Latvia and in Q1, there were decreases in nearly all countries in Q2 (with
Germany, the number of trains was unchanged. The largest exception of Bulgaria, where the number remained unchanged).
decrease was in Slovenia, where numbers fell by 30% due to In Q3 and Q4, the number of passenger trains compared to 2019
suspension of services between 22 March and 10 May. The next fell in 18 countries.
largest decreases were in Lithuania (-22%), Italy and Croatia
(-18%), Estonia and the UK (-17%).
The combined monthly data from 17 countries show that
the number of passenger trains fell by 2% in January.
Figure 15 – Change in passenger train departures, monthly This can be attributed to strike action in France, where
comparison the number of trains in January 2020 fell by 29%.
In March there was a fall of 13%, as restrictions were
Jan Feb Mar Apr May Jun Jul Aug Sep Oct Nov Dec imposed throughout the month. The largest decrease
Slovenia +1% +5% -51% -100% -75% -8% -2% -2% +2% -0% -64% -52% was in April where numbers fell by 4%, from 2.8 million
Lithuania +7% +11% -3% -43% -41% -11% -32% -23% -24% -23% -32% -41%
to 1.6 million. More services started to run from June
France -29% +3% -37% -79% -56% -64% -6% -1% +3% +3% -14% +148%
Italy +0% +4% -35% -66% -46% -23% -11% -12% -7% -5% -6% -9% due to a relaxation in lockdown measures, and there
Estonia +2% +5% -3% -45% -45% -31% -19% -20% -15% -10% -11% -10% were small decreases in July and August.
UK +3% +5% -10% -44% -39% -27% -22% -20% -11% -11% -14% -8%
Serbia -3% +17% -32% -100% -44% +3% +2% +0% +0% +3% +4% -5% In September and October, the number of trains running
-2% +4% -13% -40% -27% -17% -7% -6% -1% -2% -5% +5% in all participating countries was similar to numbers in
Norway +1% +4% -11% -32% -23% -11% -8% -14% -2% -6% -4% -8%
2019. However, this did vary by country, with decreases
Poland +2% +5% -9% -32% -29% -15% -8% -7% +1% -1% +0% -1%
Sweden +1% +4% -2% -17% -22% -14% -12% -6% -4% -4% -6% -4% of more than 10% in three countries (UK, Estonia and
Portugal -1% +0% -11% -36% -12% +0% -5% -2% +0% -4% -3% -5% Lithuania). In November there was a decrease of more
Slovakia +1% +4% -15% -28% -16% -4% -1% -3% -4% -5% -3% -2% than 10% in six countries.
Belgium +0% +5% -12% -41% -11% -3% -4% +1% -0% -3% -5% +3%
Finland +4% +7% -2% -3% -12% -8% -9% -5% -2% -4% -3% -1% While in April lockdown measures affected train numbers
Greece +28% +31% -1% -54% -15% +7% +2% +4% +1% +7% -16% -20%
in all countries, in the second half of the year levels of
Latvia +1% +5% +0% -5% -8% -1% -1% +2% +3% -1% -1% +1%
Germany +2% +4% -3% -22% -6% +3% +5% +3% +6% +5% +5% +4% restrictions varied in each countries. This led to increased
train numbers in some countries (similar to 2019 levels)
and decreases in others.
Germany was the only country where from June onwards
-100% -75% -50% -25% 0% 25% passenger train numbers were higher compared to the
same month in 2019. The largest decreases in train
numbers in November and December was in Slovenia.
16 // Impacts of the COVID-19 crisis on 2020 railway markets05 // Train departures in 2020
The freight train departures fell by 6% on average
in 2020
The number of freight trains fell during
Figure 16 – Change in freight train departures, comparison 2020/2019 2020, particularly during the months
April to June.
-37% Latvia
During 2020 there were 4.0 million
-15% Romania
-13% Spain
freight trains running in 24 countries.
-12% UK This was a decrease of 6% compared to
-12% France 2019, when 4.3 million freight trains ran.
-11% Estonia There were increases in numbers in
-10% Slovenia some countries, with the largest
-8% Slovakia increase in Ireland (+24%). However,
-7% Hungary this was due to lower-than-expected
-7% Austria freight train departure figures in Ireland
-6% IRG for 2019, when works resulted in some
-6% Finland rail freight services being replaced by
-6% Serbia
road haulage for their duration. Greece,
-6% Belgium
Lithuania and Croatia also ran more
-6% Poland
-5% Italy freight trains in 2020 compared to 2019.
-4% Bulgaria Although numbers were reduced, some
-4% Germany countries prioritised freight services as
-2% Sweden
passenger train numbers decreased.
-2% Norway
Freight services were needed for the
0% Portugal
2% Greece rising demand in goods such as food,
3% Lithuania fuel and medicine during the pandemic.
6% Croatia Whereas the IRG total was a decrease
24% Ireland
of 6%, there were some increases in
departure numbers (Greece, Lithuania,
Croatia and Ireland).
The combined monthly data from number of
freight departures fell by 9% and 5% in
January and February, suggesting this was
due to reasons other than the pandemic. The Figure 17 – Change in freight train departures, monthly comparison
largest decrease was 20% in April, from
287,000 trains to 231,000. The extent varied
Jan Feb Mar Apr May Jun Jul Aug Sep Oct Nov Dec
with falls of over 20% in 8 countries, but
there was an increase of 11% in Greece. Latvia -47% -43% -41% -35% -36% -47% -33% -31% -38% -35% -29% -25%
France -22% -6% -21% -33% -28% -55% -14% -13% -8% -11% -6% +111%
In May the number of freight trains Spain -11% -3% -12% -37% -33% -12% -14% -16% -8% -14% -5% +11%
decreased by 18%, and there were smaller UK -6% -1% -12% -30% -25% -17% -13% -11% -10% -6% -6% +0%
Estonia -19% -23% -21% -21% -19% -15% +1% +4% -9% -7% -4% +11%
decreases of 1-7% between June and Slovenia -5% -5% -13% -24% -19% -9% -15% -13% -8% -5% -3% -3%
October. The combined numbers increased in Slovakia -15% -9% -10% -20% -17% -10% -7% -7% -5% -1% +2% +11%
November and December. This was driven IRG -9% -5% -9% -20% -18% -11% -7% -6% -1% -3% +2% +14%
by increase in services in Germany and Finland -8% -31% -7% -2% -0% -4% -10% -9% -1% -6% +4% -0%
Poland. Serbia -6% +0% -9% -9% -15% -4% -2% -3% -7% -7% -3% -7%
Belgium -3% +1% -5% -20% -23% -9% -13% -10% +1% -4% +4% +15%
The largest decreases were in Latvia, due to Poland -14% -7% -13% -19% -13% -6% -7% -1% +1% -2% +4% +11%
Italy -4% +3% -10% -28% -21% -11% -6% -6% -1% +4% +11% +11%
changes in the world market meaning less
Germany -5% -6% -6% -18% -18% -5% -4% -4% +3% -0% +4% +11%
cargo was transported through Latvian ports, Sweden -5% +2% -0% -2% -7% +5% -7% -1% -3% -6% -3% +6%
and Russia and Belarus also reducing traffic. Norway -4% +2% -0% -0% -9% +2% -0% +2% +2% -9% -7% +6%
Portugal -10% +60% +6% -4% -17% -13% -12% -14% +1% -5% -6% +81%
Lithuania was the only country where freight Greece +27% +13% -8% +11% -9% -13% +5% -2% -7% -3% +3% +12%
train numbers were higher compared to the Lithuania -16% -5% -4% -5% -5% +35% -3% +8% +14% +11% +10% +9%
same month in 2019, from June 2020
onwards. Strike action in France in December
2019 and January 2020 affected freight train
numbers, leading to a large increase in -30% 0% 30%
December 2020 compared with December
2019.
Impacts of the COVID-19 crisis on 2020 railway markets // 1706
Punctuality
2019 2020 comparison
The % of trains arriving
17/20 countries on-time increased by
recorded annual improvement
of punctuality for passenger
trains
>4 pp for 3 countries
for passenger trains
16/17 countries >9 pp for 2 countries
recorded annual improvement
for freight trains
of punctuality for freight trains
The sample used to calculate these figures is specified in the following pages.
18 // Impacts of the COVID-19 crisis on 2020 railway markets06 // Punctuality of train services in 2020
The punctuality of passenger services improved in
almost all countries in 2020
This measure looks at the percentage of passenger trains that arrived on time/within schedule. In most countries this is measured by
the number of services that arrive within 5 minutes 0 seconds of the scheduled arrival time, however some countries adopt different
punctuality thresholds (e.g. within 3 minutes). This difference in thresholds should not affect the data, as the same ‘on-time’ measure
was used consistently by a country in both 2019 and 2020.
Figure 18 – Change in percentage points (pp) of passenger trains arriving on time*, Looking at data for the full
comparison 2020/2019 year in 2020, 17 of the 20
countries that submitted
Romania 5,0pp data reported an
UK 4,4pp improvement in the
Greece 4,3pp punctuality of their services
Finland 3,9pp compared with the previous
Portugal 3,5pp
year. The largest increase
Bulgaria 3,3pp
Belgium
was in Romania where
3,3pp
Norway 3,1pp punctuality improved from
Italy 3,0pp 77% in 2019 to 82% in 2020
Hungary 2,4pp (up 5.0 percentage points).
Sweden 2,3pp There was also notable
Poland 2,2pp improvements in the United
Germany 2,0pp Kingdom (up 4.4pp) and
Austria 1,8pp Greece (up 4.3pp). The
Slovenia 1,2pp punctuality rates in the
France 0,9pp Netherlands, Croatia and
Latvia 0,3pp
Lithuania were largely
Netherlands 0,0pp
Croatia
unchanged compared with
0,0pp
Lithuania -0,3pp the previous year.
*
Threshold used by country: 5min29s for Austria;
5min59s for Belgium, Poland and Sweden; 5min00s or
10min00s for Spain (different between services); 5min00s
This pattern of improvements in timetable and depart stations on
for all other countries punctuality can be attributed to time. With fewer trains running,
multiple factors. The reduction in there was less wear and tear on the
passenger numbers resulted in less network and less congestion. This
crowding and subsequently a fall in reduced the likelihood of knock-on
Figure 19 shows how punctuality rates changed over the time trains spent at stations impacts on other services when
the course of 2020 (compared to 2019). This (dwell time). This meant trains were incidents occurred.
highlights the overall improvements in punctuality able to run according to the
since the start of the pandemic. Increases in January
and February cannot be attributed to the pandemic as
they preceded the introduction of restrictive measures
in most cases.
Figure 19 – Change in percentage points (pp) of passenger trains arriving
By April, all 13 countries reported improvements in on-time, monthly comparison
punctuality rates compared with the previous year.
These improvements continued in June and July as Jan Feb Mar Apr May Jun Jul Aug Sep Oct Nov Dec
many countries eased restrictions. UK -3.3 pp -4.5 pp -1.2 pp +6.1 pp +6.1 pp +6.8 pp +9.0 pp +5.4 pp +6.1 pp +7.0 pp +11.3 pp+10.4 pp
Finland +13.7 pp +8.4 pp +3.1 pp +3.6 pp +2.8 pp +1.1 pp +2.9 pp +0.1 pp +0.5 pp +3.8 pp +3.1 pp +3.2 pp
By August, there was increased variation between
countries. Some countries continued to show Portugal -4.1 pp -2.6 pp +0.4 pp +5.6 pp +6.1 pp +3.7 pp +5.7 pp +5.8 pp +3.9 pp +4.7 pp +6.1 pp +7.3 pp
substantial improvements compared to the previous Belgium +2.2 pp -0.1 pp +1.3 pp +6.2 pp +5.9 pp +5.4 pp +3.5 pp 0.0 pp +1.8 pp +3.5 pp +6.4 pp +4.5 pp
year. These include Norway (+6.6pp), Portugal Norway +0.2 pp +3.6 pp +2.0 pp +1.5 pp +4.7 pp +2.4 pp +5.9 pp +6.6 pp +3.4 pp +1.9 pp +3.2 pp +2.9 pp
(+5.8pp) and the United Kingdom (+5.4pp). Italy +2.6 pp +0.7 pp +3.3 pp +6.2 pp +5.3 pp +4.4 pp +2.0 pp -1.0 pp +1.0 pp +2.0 pp +9.0 pp +4.0 pp
However, these improvements were not universal, Sweden +3.3 pp +4.0 pp +2.0 pp +3.0 pp +3.0 pp +3.3 pp +2.6 pp +2.6 pp +1.3 pp +1.6 pp +0.8 pp +0.7 pp
with Lithuania, France, Italy and Slovenia all reporting Poland +2.5 pp -0.1 pp +2.4 pp +4.0 pp +4.2 pp +3.6 pp +2.1 pp +1.2 pp +1.8 pp +3.9 pp +1.9 pp +0.1 pp
a deterioration in punctuality rates compared to the Germany +2.5 pp +0.4 pp +3.1 pp +5.0 pp +4.6 pp +2.4 pp +2.3 pp +0.9 pp +1.0 pp +0.0 pp +0.3 pp +2.8 pp
previous year.
Slovenia -1.2 pp -2.0 pp -1.2 pp +3.9 pp +6.1 pp -0.2 pp -1.0 pp -1.3 pp -0.9 pp -0.5 pp +1.6 pp
In most cases, this reflected already high levels of France -2.7 pp -1.9 pp -0.6 pp +3.5 pp -0.1 pp +2.3 pp +2.4 pp -1.5 pp +1.3 pp +1.9 pp +6.5 pp +8.1 pp
performance in 2019 (for example, Lithuania reported Latvia +0.9 pp +0.4 pp +0.1 pp +0.1 pp +0.3 pp +0.4 pp +1.0 pp +0.0 pp -0.1 pp +0.4 pp +0.1 pp +0.2 pp
a punctuality rate of 96.9% in August 2019). Lithuania +1.6 pp -0.4 pp -0.8 pp +0.3 pp -1.8 pp -0.4 pp -0.2 pp -3.7 pp -3.0 pp +0.2 pp +1.6 pp +0.2 pp
By the end of 2020, punctuality had improved in all
countries. This is likely to reflect the tightening of
restrictions in many countries and the fact that
punctuality rates are typically lower in winter months 0 5 10
as weather conditions worsen.
Impacts of the COVID-19 crisis on 2020 railway markets // 1906 // Punctuality of train services in 2020
The punctuality of freight services increased by
more than 5 pp in five countries
This section looks at the punctuality of freight services in 2020 compared to the previous year. Countries use different punctuality
thresholds, ranging from within five minutes to within 60 minutes of scheduled arrival time. Similar to passenger services
punctuality, these differences should not affect the analysis as the same thresholds were used in both years.
Figure 20 – Change in percentage points (pp) of freight trains arriving on-time*,
comparison 2020/2019
Looking at data for 2020, most
countries reported improvements in Finland 10,4pp
the punctuality of freight services Italy 9,0pp
compared with 2019. The largest Portugal 7,0pp
increase was in Finland where Hungary 6,7pp
punctuality increased from 71.7% in Sweden 5,1pp
2019 to 82.2% in 2020 (up 10.4 pp). Poland 4,5pp
Norway 4,2pp
It should be noted that Finland
Austria 3,8pp
reported a substantial increase in Belgium 3,5pp
freight punctuality in January and Germany 3,4pp
February, therefore these year-on- Croatia 3,3pp
year improvements cannot solely be Lithuania 3,3pp
attributed to the effects of the Latvia 2,6pp
pandemic. There were also notable France 1,1pp
Slovenia 1,1pp
improvements in Italy (up 9.0 pp),
Romania 1,0pp
Portugal (up 7.0 pp) and Hungary (up Bulgaria -1,4pp
5.1 pp). The only country where
punctuality worsened was in Bulgaria
*
(down 1.4 pp). Threshold used by country: 5min59s for Sweden; 15min00s for Germany and Portugal; 15min59s for
Poland; 30min00s for Austria and Belgium; 60min00s for Romania and Spain; 5min00s for all other countries
Like passenger trains, the reduction in freight services led to allocation with less passenger trains. There were greater
improvements in punctuality. As the number of trains on the improvements in freight punctuality compared to passenger
network was reduced, there was less network congestion and services. Of the 17 countries that submitted data on both
conflicts between train paths. With fewer passengers freight and passenger punctuality, 14 showed greater
travelling, freight services were prioritised in some countries. improvements in freight punctuality than for passenger
This meant that freight trains were given priority in slot services.
Figure 21 shows how freight punctuality
Figure 21 – Change in percentage points (pp) of freight trains arriving on- rates have changed over the course of
time, comparison 2020/2019
2020 (compared to the previous year). This
Jan Feb Mar Apr May Jun Jul Aug Sep Oct Nov Dec
highlights the overall improvements in
freight punctuality since the start of the
Finland +32.8 pp+24.6 pp+13.5 pp +8.4 pp +5.3 pp +5.0 pp +8.8 pp +5.6 pp +2.1 pp +5.2 pp +3.9 pp +6.0 pp pandemic. As with passenger services,
Italy +5.6 pp +5.1 pp +14.6 pp+29.0 pp+20.5 pp+12.6 pp +6.0 pp +4.0 pp +2.0 pp +2.0 pp +10.0 pp +2.0 pp despite some countries showing
Portugal +9.6 pp +9.2 pp +7.1 pp +14.7 pp+11.0 pp +4.5 pp +3.1 pp +8.6 pp -0.7 pp +0.9 pp +5.9 pp +11.0 pp improvements in punctuality in January to
March, these increases cannot be
Sweden -2.0 pp +7.0 pp +4.0 pp +3.0 pp +10.0 pp+10.0 pp +5.0 pp +8.0 pp +3.0 pp +2.0 pp +1.0 pp +3.0 pp
attributed to the pandemic as they
Poland +8.6 pp +4.4 pp +6.0 pp +10.7 pp +9.7 pp +6.0 pp +1.9 pp -1.1 pp +1.0 pp +4.7 pp +2.4 pp +1.9 pp preceded the introduction of restrictive
Norway +9.9 pp +8.2 pp +2.6 pp +0.6 pp +3.2 pp +0.6 pp +5.5 pp +2.2 pp +1.6 pp +4.0 pp +7.2 pp +3.9 pp measures in most cases.
Belgium +0.1 pp -5.1 pp -1.7 pp +8.9 pp +1.4 pp +7.9 pp +5.8 pp +3.0 pp +6.2 pp +5.1 pp +5.6 pp +7.7 pp
From April to July, 11 countries reported
Germany +4.9 pp +0.7 pp +2.1 pp +10.9 pp+10.0 pp +5.8 pp +6.4 pp +6.6 pp +1.7 pp -2.8 pp -2.8 pp +0.8 pp
improvements in punctuality rates
Lithuania +4.5 pp +5.4 pp +4.6 pp +6.2 pp +5.8 pp +7.1 pp +9.6 pp +1.1 pp -0.3 pp +2.2 pp -1.7 pp -0.9 pp
compared to the previous year. These
Latvia +2.5 pp +1.3 pp +4.9 pp +3.5 pp +4.1 pp +2.9 pp +3.0 pp +1.4 pp -0.6 pp +2.4 pp +1.3 pp +2.9 pp improvements were greater than those
France -2.5 pp +2.2 pp +4.3 pp +5.4 pp +2.4 pp +6.0 pp +5.0 pp -4.3 pp -4.5 pp +2.0 pp +5.2 pp +8.1 pp reported for passenger services, and
punctuality in Italy increased by 29
Slovenia +4.6 pp +6.1 pp +2.3 pp +2.5 pp -6.4 pp +0.5 pp +1.9 pp -2.6 pp -1.6 pp -2.2 pp +2.4 pp +5.7 pp
percentage points. From August onwards,
the improvements were smaller. This
reflects increased network activity with a
rise in freight and passenger train numbers
-5 0 5 10 15 20 compared to earlier in the year.
20 // Impacts of the COVID-19 crisis on 2020 railway marketsYou can also read