CAPITAL ONE CONFERENCE - OCTOBER 2021
←
→
Page content transcription
If your browser does not render page correctly, please read the page content below
CAPITAL ONE
CONFERENCE

OCTOBER 2021
INVESTMENT HIGHLIGHTS

RLJ’s portfolio construct, embedded growth catalysts and liquidity uniquely position the Company to
outperform throughout the entire lodging cycle

                      ▪ Outperforming during early recovery with strong occupancy and positive
  OPERATING             cash flow
 PERFORMANCE
                         – Poised to benefit from the next leg of recovery as Business Travel and Group strengthen

 HIGH-QUALITY         ▪ RLJ’s reshaped portfolio has an enhanced growth profile
  PORTFOLIO              – Lean operating model and footprint is ideally suited to benefit throughout this cycle

                      ▪ Actively deploying capital - executed on a high-quality acquisition in a
   EXTERNAL
   GROWTH               growth market
                         – Strong pipeline of attractive acquisition opportunities

  UNLOCKING           ▪ Positioned to deliver $23M - $28M of incremental EBITDA from
   INTERNAL
   GROWTH               Conversions, Revenue Enhancements and Margin Expansion initiatives
  CATALYSTS              – Ability to generate “above-cycle” growth

   STRONG             ▪ Over $1.0B of liquidity, significant flexibility and a well-laddered debt
   BALANCE              maturity profile
    SHEET
                         – Balance sheet positioned to support growth initiatives
                                                             EMBASSY SUITES MANDALAY BEACH RESORT

                                                   OCTOBER 2021                                                      2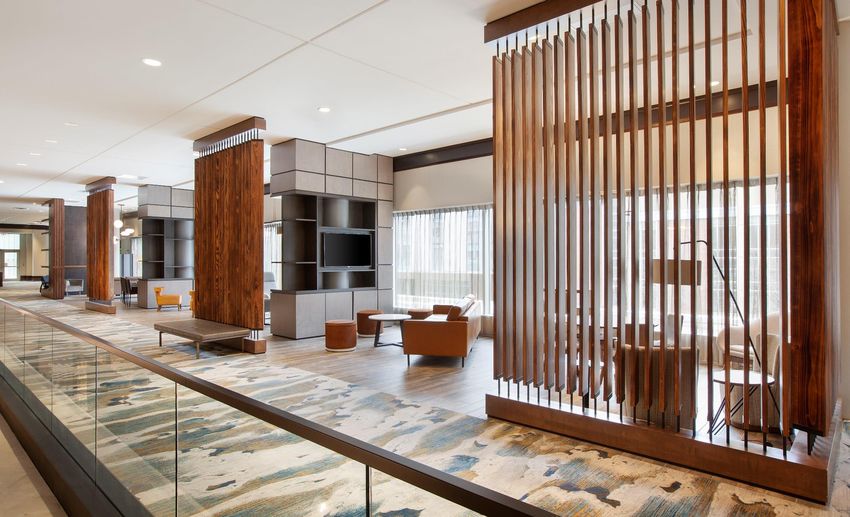
OPERATING
PERFORMANCE

MARRIOTT LOUISVILLE DOWNTOWN

                               OCTOBER 2021   3
2021 | JULY - AUGUST OPERATING PERFORMANCE HIGHLIGHTS

Accelerating operating trends from Q2 continued into July, with some moderation during the
second half of August

  Portfolio benefitted from accelerating lodging demand in Q2(1)
               ▪         Open hotel occupancy of 61% and ADR of $142 increased 32% and 19%, respectively, from Q1
               ▪         “All-Suite” hotels (50% of portfolio) enabled portfolio to gain ~600 basis points of market share
               ▪         Business Transient and Group revenues increased 65% and 50%, respectively, from Q1

  Operating trends improved from Q2 into July(1)
               ▪         July achieved the strongest monthly occupancy, ADR and EBITDA margins since the start of the pandemic
               ▪         Leisure revenues increased ~24% from June
                                  – Weekend occupancy achieved 90% of 2019 while ADR exceeded at 104%

               ▪         Business Transient / Group increased ~10% / ~13% from June, respectively
                                  – Weekday occupancy and ADR achieved 78% and 86% of 2019 levels, respectively

  Trends moderated beginning mid-August(1)
               ▪         August occupancy and ADR of ~63% and ~$156 moderated from ~69% and $163 in July(1)
               ▪         Weekday trends moderated more than weekends

(1) Pro Forma Open Hotel Occupancy and ADR excludes three dispositions and includes one property acquired in early August. Open Hotels include those hotels that are open for at least 10 days of the month. Results exclude the Chateau LeMoyne-French Quarter New Orleans, which is a
fully unconsolidated hotel. Unaudited, for comparison purposes only

                                                                                                                                OCTOBER 2021                                                                                                                                              4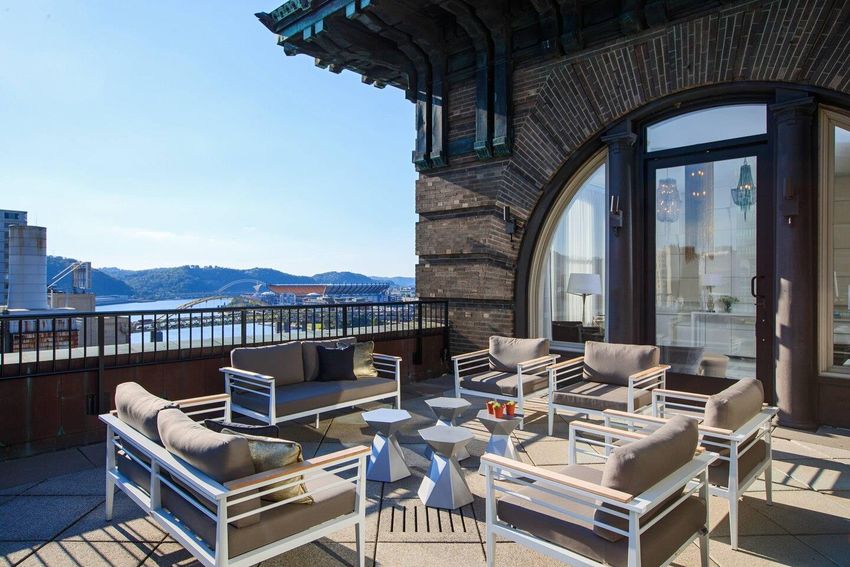
2021 | MONTHLY OPERATING TRENDS

July RevPAR achieved 75% of 2019 while generating EBITDA margins above July 2019(1)

  Portfolio construct benefitted from pent-up demand leading to strong July performance(1)
          ▪         Occupancy accelerated from 59% in April to 63% in June, and 69% in July
          ▪         ADR improved each month with open hotels achieving $163 in July, representing 91% of 2019 levels
          ▪         July RevPAR of $112 achieved new peak since the pandemic began, with markets such as Charleston and South
                    Florida exceeding 2019 levels
          ▪         EBITDA Margins exceeded 2019 levels in July

  August RevPAR moderated from July, however Hotel EBITDA margins were just ~150 bps below
  2019 levels
     Occupancy(1) | 2021 vs 2019                                                     ADR(1) | 2021 vs 2019                                               RevPAR(1) | 2021 vs 2019                                            EBITDA Margin(1) | 2021 vs 2019
 90%                                                                                                                                            $160                                                                     40%
                                                                        $200
            82.9%                                                                  $184.08                                                                  $152.52
 80%                                                    80.9%           $180                                                     $172.72 $140                                                             $139.67 35%              36.1%
                                                                                                                                                                                                                                                                                 31.1%
 70%                                                                    $160                                                      $156.14 $120                                                                           30%
                                                                                                                                                                                                                                                                                29.6%
 60%                                                                    $140
                                                        62.6%                     $133.81                                                       $100                                                                     25%
           58.7%                                                        $120                                                                                                                                $97.71                25.4%
 50%
                                                                        $100                                                                      $80                                                                    20%
 40%                                                                                                                                                         $78.64
                                                                          $80                                                                     $60                                                                    15%
 30%
                                                                          $60
 20%                                                                                                                                              $40                                                                    10%
                                                                          $40
 10%                                                                      $20                                                                     $20                                                                     5%

   0%                                                                       $0                                                                      $0                                                                    0%
            Apr.        May        Jun.        Jul.      Aug.                         Apr.        May         Jun.        Jul.      Aug.                      Apr.        May         Jun.         Jul.       Aug.                  Apr.       May         Jun.       Jul.      Aug.
                Occupancy 2019             Occupancy 2021                                     ADR 2019                    ADR 2021                                  RevPAR 2019                RevPAR 2021                            EBITDA Margin 2019          EBITDA Margin 2021

(1) For Open Hotels (include those hotels that are open for at least 10 days of the month). Results exclude three hotels sold and include one hotel acquired in early August and also exclude the Chateau LeMoyne-French Quarter New Orleans, which is a fully unconsolidated hotel

                                                                                                                                   OCTOBER 2021                                                                                                                                          5
2021 | WEEKLY OCCUPANCY TRENDS

Q3 Occupancy peaked in July followed by seasonal and Delta moderation in late August through
mid-September and ended September with positive momentum

                                                                       Open Hotels Weekly Occupancy vs % of 2019(1)

                                                                                  Open Hotels                           % of 2019 Occupancy
 80%                                                                                                                                                                                                                        90%

 75%
                                                                                                                                                                                                                            80%
 70%                                                                                                                                                                                                                74%
                                                                                                                                                                                                                            70%
 65%
                                                                                                                                                                                                                    61.8%
 60%                                                                                                                                                                                                                        60%

 55%
            51%                                                                                                                                                                                                             50%
 50%
                                                                                                                                                                                                                            40%
 45%

 40%                                                                                                                                                                                                                        30%

 35% 34.1%
                                                                                                                                                                                                                            20%
 30%
                                                                                                                                                                                                                            10%
 25%

 20%                                                                                                                                                                                                                        0%

(1) Open Hotels (as of September 25, 2021) include those hotels that are open for at least 10 days of the month; excludes the Chateau LeMoyne-French Quarter New Orleans; unaudited, for comparison purposes only

                                                                                                             OCTOBER 2021                                                                                                         6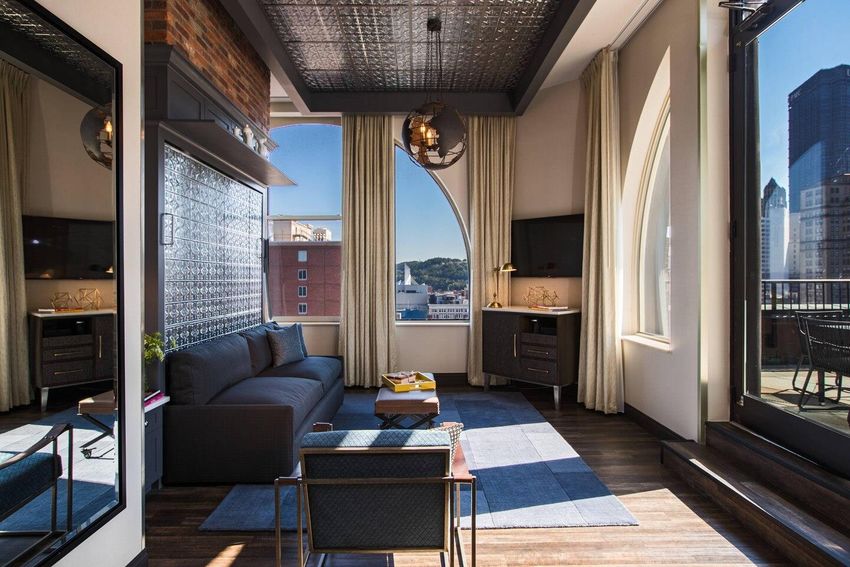
POST - LABOR DAY OUTLOOK

Recent fundamentals showing improved momentum and our confidence in the trajectory of the
lodging recovery remains unchanged

  RevPAR strengthened back half of September
                ▪         Leisure continue to drive strong weekend performance
                                    – Labor Day weekend occupancy and ADR exceeded 2019 at 78% and $179 respectively, benefitting from strong Leisure(1)
                                    – Hurricane Ida had modest impact on the New Orleans properties; one hotel temporarily closed for remediation

  Pace of business demand for the remainder of the year will be impacted by the reopening
  trends
                ▪         While school reopenings across the country have played out as expected, office reopenings have been delayed
                          in many markets due to Delta variant concerns

  Citywides and Group trends in Q4 are evolving
                ▪         Moderate impact to Q4 from Group cancellations
                ▪         Some citywides have shifted to virtual, been cancelled, are continuing with reduced attendance or have
                          postponed to 2022
                                    – Mask and vaccination mandates impacting attendance

  Lodging fundamentals are expected to meaningfully strengthen in 2022
                ▪         Delayed post-Labor Day demand could provide incremental lift in 2022

(1) For Open Hotels (include those hotels that are open for at least 10 days of the month). Results exclude three hotels sold and include one hotel acquired in early August and exclude the Chateau LeMoyne-French Quarter New Orleans, which is a fully unconsolidated hotel

                                                                                                                                   OCTOBER 2021                                                                                                                                  7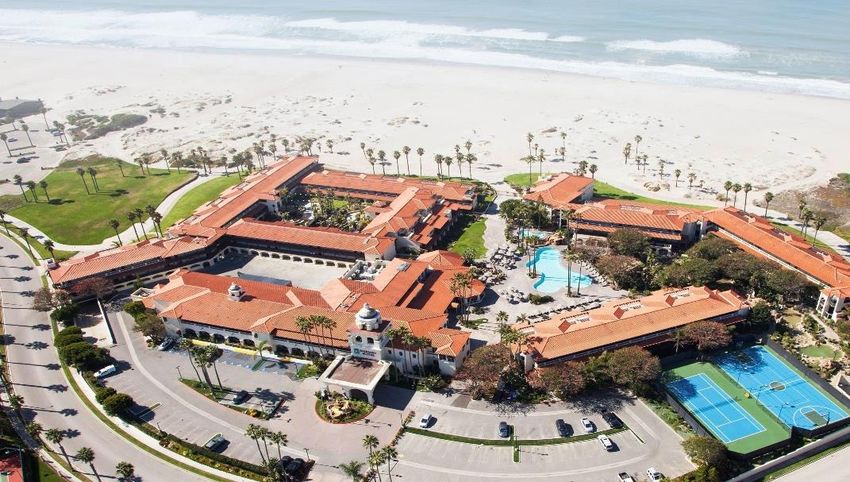
HIGH-QUALITY
PORTFOLIO

RENAISSANCE PITTSBURGH

                         OCTOBER 2021   8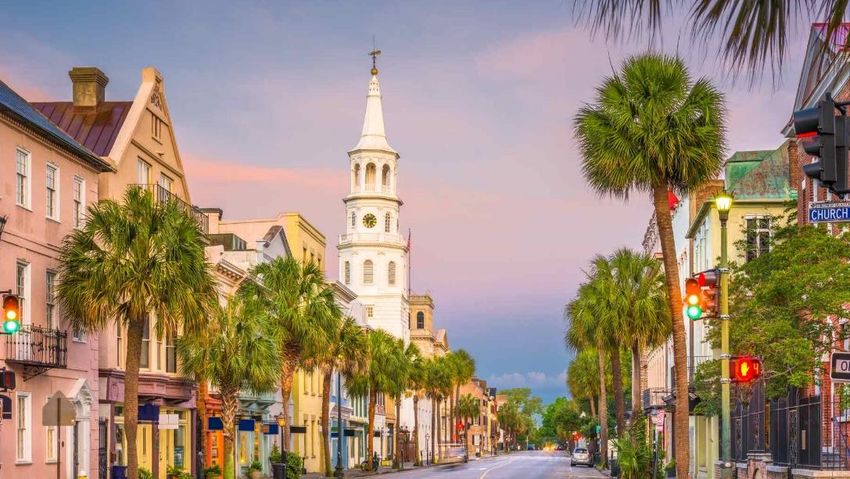
PORTFOLIO PROFILE

RLJ owns a geographically diversified portfolio of premium branded, high-margin, focused-service
and compact full-service hotels

                  Portfolio Overview(1)                                            Property Types(2)                              Operating Metrics(3)

                                    23                                                                 Compact Full-Service             79%
                                     States                                                                                            Occupancy
                                                                     55%                      41%      Focused-Service

                                                                                                       Traditional Full-Service        $184
                                    97                                                 4%                                                ADR
                      Comparable Hotels
                                                                                                                                       $146
                                                                                            Flags(2)
                                                                                                                                        RevPAR
                         22,100                                                                            Other

                              Guestrooms
                                                                            18%
                                                                                                           Embassy Suites            $449M
                                                                                            23%            Wyndham
                                                                                                                                     Hotel EBITDA
                                                                       4%                                  Courtyard

                                84%                                    5%

                                                                       7%                      13%
                                                                                                           Marriott
                                                                                                           Residence Inn                32%
                   Rooms Revenue                       Mix(3)               8%
                                                                                        13%
                                                                                                           Hyatt House
                                                                                                                                  Hotel EBITDA Margin
                                                                                  9%
                                                                                                           DoubleTree
                                                                                                           Hilton Garfden Inn
(1) As of September 15, 2021
(2) Represented as a percentage of FY 2019 EBITDA
(3) 2019 metrics for Pro forma hotel portfolio as of June 30, 2021

                                                                                       OCTOBER 2021                                                      9
DIVERSIFIED PORTFOLIO

  RLJ’s footprint in top Urban markets is well-positioned to capture the recovery in all segments
             ▪         Sunbelt markets represent 47% of RLJ’s Hotel EBITDA(1)

                      Portland

                                                                                                                                                                                                                                       Boston
                                                                                                                                                                      Chicago
                                                                                                                                                                                                                             5%     New York City
                                                                                                                                                                         4%                      Pittsburgh
San Francisco CBD                 4%                                                                                                                                                                                         Philadelphia
                                                                                                  Denver
                                        13%                                                                                                              Indianapolis                                                   5%   Washington, D.C.
          Other NoCal
                                                                                                                                                                                  4%       Louisville

                            SoCal          12%
                                                                                                                                                                             Atlanta
                                                                                                                                                                                            5%                         Charleston
                                                                                                                           Dallas

                                                                                                                   Austin                                             New Orleans
                                                                                                                                           Houston
                                                                                                                                4%                                                                                 Orlando
                                                                                                                                             4%
                         RLJ Top      Market(1)                                                                                                                                         Tampa
                                                                                                                                                                                                              9%         South Florida
                         RLJ Other Core Market(1)
                                                                                                                                                       Other Markets 31%

    (1) Based on FY 2019 EBITDA pro forma for the portfolio owned as of September 15, 2021; excludes Chateau LeMoyne; the recently acquired Hampton Inn & Suites Atlanta Midtown hotel is based on stabilized EBITDA

                                                                                                                              OCTOBER 2021                                                                                                          10
HIGH-QUALITY PORTFOLIO CONSTRUCT
RLJ’s Transient orientation, product type, favorable market exposure and lean operating model
position the Company for outperformance throughout the entire cycle
Transient segment, especially leisure, is expected to remain strong throughout this cycle
▪ RLJ’s portfolio is primarily transient oriented (~80% of revenues(1))
▪ Portfolio is benefitting from relative leisure strength in markets such as South Florida, Orlando and Charleston
▪ Drive-to markets represent ~35% of revenues(1)
▪ RLJ has eight hotels located in resort-oriented markets, which represent ~10% of revenues(1)
Suite product is very attractive to our core demand segments
▪ Hotels with extended-stay features represent ~50% of revenues(1)
▪ Brands such as Residence Inn and Embassy Suites offer larger rooms, which are appealing
▪ The all-suite product is ideal for longer-term business travelers
Lean operating model allowing hotels to quickly recover profitability
▪ RLJ’s select-service and compact full-service hotels have smaller footprints with lean staffing and are achieving profitability
/ strong flowthrough
– RLJ portfolio is achieving positive hotel EBITDA and positive cash corporate cash flow
(1) Based on FY 2019 revenues
OCTOBER 2021 112021 | MORE RESILIENT PORTFOLIO
Occupancy and Margin outperformance relative to most peers underscores RLJ’s more resilient model
Occupancy Performance | Q2 2021(1)
80% 70.8% 68.2% 64.9%
57.9% 55.8% Q2 Avg.: 53.2%
60% 51.4% 48.5%
43.6% 43.0% 42.3% 38.6%
40%
20%
0%
APLE CLDT INN RLJ HT XHR DRH SHO HST PK PEB
Hotel EBITDA Margins | Q2 2021(1)
50%
38.6%
40%
31.2% 29.2%
30% 26.4% 25.3% 24.0% Q2 Avg.: 23.9%
23.3%
19.1% 17.4%
20% 15.0% 13.7%
10%
0%
APLE CLDT INN HT RLJ XHR DRH HST PEB SHO PK
(1) Represents total portfolio, as of June 30, 2021
OCTOBER 2021 12POSITIONED TO DRIVE “ABOVE-CYCLE” GROWTH
RLJ is uniquely positioned with multiple channels to drive growth that is incremental to the Lodging
recovery, allowing the Company to outperform throughout the entire cycle
RLJ’s reshaped portfolio has an improved long-term growth profile and operating metrics
▪ 2019 dispositions improved long-term RevPAR growth and market concentration
▪ RLJ’s portfolio should thrive as Business Transient returns during a sustained recovery
Significant liquidity of over $1B should enable RLJ to emerge with a healthy balance sheet
▪ Minimize the need to raise unattractive capital
▪ Balance sheet positioned to support internal and external growth
Well-positioned to deploy growth capital early during this recovery
▪ RLJ has an attractive and active acquisition pipeline
RLJ’s growth will be amplified by unlocking embedded growth catalysts
▪ Opportunity to reposition the Wyndham portfolio which represented 13% of RLJ’s pre-COVID EBITDA(1) as well as
other conversion and ROI opportunities
– $23M to $28M in incremental EBITDA to be generated from 2022 Conversions, Revenue Enhancement and Margin
Expansion opportunities
(1) Based on FY 2019 EBITDA
OCTOBER 2021 13EXTERNAL
GROWTH
HAMPTON INN & SUITES ATLANTA MIDTOWN
OCTOBER 2021 14EXTERNAL GROWTH | HAMPTON INN ATLANTA MIDTOWN
Recently acquired the newly-built Hampton Inn & Suites Atlanta Midtown
▪ Atlanta is ranked as a top growth market for both
population and corporate relocations
– Ranks 3rd in largest concentration of Fortune 500 headquarters
– Home to globally ranked universities
– Southeast’s largest concentration of arts & culture institutions
▪ Midtown Atlanta is a high growth submarket
– 5x population growth (since 2015) compared to Atlanta
– Home to 46% of City’s tech / science / management jobs
– RevPAR premium of +88% relative to the Atlanta market
– RevPAR CAGR outpaced Top 25 Markets and U.S. by 360 bps and 270
bps from 2015 – 2019(1)
▪ Newly-built hotel, heart of demand location
– Opened in February 2020
– Located just three blocks from Google’s new office in Atlanta
– In the heart of new development including 3.0M SF of office space and
+4,200 residential units under construction
(1) Source: STR
OCTOBER 2021 15EXTERNAL GROWTH | HAMPTON INN ATLANTA MIDTOWN
Acquisition is expected to be accretive to RLJ’s RevPAR, EBITDA margins and growth profile
In line with RLJ’s investment parameters…
Premium brand High growth market
Strong RevPAR Heart of demand location
Rooms-oriented Young asset
High margins Off-market transaction
~8.0 - 8.5% $150 42%
Stabilized Stabilized Stabilized
NOI Yield (1) RevPAR (1) Margins (1)
RLJ has a strong pipeline of attractive acquisition opportunities
(1) Annual, upon stabilization
OCTOBER 2021 16INTERNAL
GROWTH
MARRIOTT LOUISVILLE DOWNTOWN
OCTOBER 2021 17INTERNAL GROWTH | UNLOCKING INCREMENTAL VALUE
$23M to $28M
of Incremental EBITDA (1)
$9-11M+
RLJ IS UNLOCKING SIGNIFICANT EBITDA(1)
EMBEDDED VALUE
across three areas of opportunity creating
~$325M REVENUE
ENHANCEMENTS
of value(2)
$7-10M+
EBITDA(1)
2022
CONVERSIONS
$7M+
EBITDA(1)
MARGIN
EXPANSION
(1) Incremental annual EBITDA on a stabilized basis for in-progress projects and near-term opportunities identified
(2) Additional details on the following page
OCTOBER 2021 18INTERNAL GROWTH | VALUE CREATION STRATEGY
Conversions, Revenue Enhancement and Margin Expansion opportunities represent a significant source
of value creation
Incremental Value
Property Project EBITDA(2) Unlevered IRR
Investment (1) Creation (3)
2022 Conversions
Wyndham Conversion to
$10.0M to $11.0M $2.0M to $3.0M
Santa Monica Independent
Wyndham Conversion to
Mills House Curio Brand $6.0M to $7.0M $2.0M to $3.0M $120M 40%+
Embassy Suites Conversion to
Mandalay Beach Curio Brand $12.0M to $13.0M $3.0M to $4.0M
Revenue Enhancements
Space initiatives
Completed ROIs $5.0M $3.0M
and operational
Space initiatives $120M 50%+
Near-Term ROIs and operational $3.0M to $4.0M $6.0M to $8.0M
Margin Expansion
Amended Agreements Renewals -- $4.0M / 30 bps
2022-2023 Renewals Renewals -- $3.0M / 20 bps $85M --
Aggregate $36 to $40M $23M to $28M ~$325M --
(1) For conversions, incremental investment calculated as additional investment required for conversion vs normal renovation
(2) Stabilized EBITDA
(3) Assumed 14x stabilized EBITDA for Conversions and 12x average industry mid-cycle multiple for Revenue Enhancements and Margin Expansion initiatives
OCTOBER 2021 19CONVERSION | WYNDHAM SANTA MONICA
KEY HIGHLIGHTS
▪ Santa Monica is a top leisure market in the U.S.
▪ Hotel located at the entrance of Santa Monica Pier
▪ Expect significant lift in ADR
– Position as a “Lifestyle” hotel to capture higher ADR already in the
market
▪ Expected to also unlock significant real estate value
– Cap rate compression with up-branding
VALUE CREATION OPPORTUNITY
▪ Enhance margins by 400 to 500 bps
Irreplaceable Santa Monica location
▪ Conversion investment includes:
– Comprehensive guestroom renovation
– Addition of al fresco dining / sidewalk café
– Reimagined lobby
– Enhanced pool experience
– $10M to $11M of conversion capex(1)
▪ Evaluating Phase 2 opportunity to create new rooftop bar
$50 - $60 $2M - $3M 40%+
Incremental Incremental
Unlevered IRR
RevPAR(2) EBITDA(2)
(1) Total investment, including conversion related CapEx expected to be ~$18M - $20M
(2) Annual, upon stabilization
OCTOBER 2021 20CONVERSION | MILLS HOUSE CHARLESTON
KEY HIGHLIGHTS
▪ Charleston is a top leisure, drive-to market
– Over 7M annual visitors
▪ Location in Charleston Historic District
▪ Expect significant lift in ADR
– Reposition as a Curio Collection to capture higher ADR
– Curio will attract top Hilton Honors members
▪ Expected to also unlock significant real estate value
– Cap rate compression with up-branding
VALUE CREATION OPPORTUNITY
▪ Capture higher rated Hilton Honors guests and enhanced F&B to
Irreplaceable CharlestonCharleston
Irreplaceable Historic District location
location drive higher out-of-room spend
▪ Conversion investment includes
– Comprehensive guestroom renovation
– Reimagined public space, including upscale finishes
– Adding new premium cafe
– Enhanced pool experience and adding a bar
– $6M to $7M of conversion capex(1)
$30 - $40 $2M - $3M 50%+
Incremental Incremental
Unlevered IRR
RevPAR(2) EBITDA(2)
(1) Total investment, including conversion related CapEx to be ~$15M - $17M, net of key money
(2) Annual, upon stabilization
OCTOBER 2021 21CONVERSION | MANDALAY BEACH
KEY HIGHLIGHTS
▪ Beachfront location between Los Angeles and Santa Barbara
▪ Physical configuration consistent with high-end destination resort
experience
▪ Expect significant lift in ADR
– Reinvented as a “curated” lifestyle resort
– Curio collection will attract higher rated Hilton Honors members
▪ Elimination of Embassy Suites complimentary services
▪ Expected to also unlock significant real estate value
VALUE CREATION OPPORTUNITY
▪ Attract higher rated Hilton Honors members and reconcepting F&B
Irreplaceable beachfront location
to increase profitability
▪ Conversion scope includes:
– Comprehensive guestroom renovation
– Addition of meeting space, new pool deck and outdoor spaces
– New outdoor coffee bar / food truck
– Reinvented arrival experience throughout public space
– $12M to $13M of conversion capex(1)
$30 - $40 $3M - $4M 40%+
Incremental Incremental
Unlevered IRR
RevPAR(2) EBITDA(2)
(1) Total investment, including conversion related CapEx expected to be ~$28M - $30M
(2) Annual, upon stabilization
OCTOBER 2021 22CONVERSIONS | INCREMENTAL OPPORTUNITIES
Additional conversions to unlock significant embedded value
REPRESENTS ~20%(1) OF PORTFOLIO
Wyndham Portfolio (remaining 6)
Conversion Opportunities Include:
8-10 additional opportunities
▪ Brand expirations ▪ Remix customer
base
▪ Conversions with
Boston
renovations ▪ Drive higher ADR
▪ Gain Market Share San Francisco Pittsburgh Philadelphia
Los Angeles
San Diego Phoenix
Charleston
Austin
New Orleans
Houston
Key West
Expect to execute two incremental conversions per year
(1) Consolidated, based on 2019 Hotel EBITDA
OCTOBER 2021 23REVENUE ENHANCEMENT | OPPORTUNITIES
Revenue ROI opportunities expected to generate incremental EBITDA
PIPELINE TOTAL
COMPLETED
$6M $9M
$3M
EBITDA(1)
+ $8M
to
= $11M
to
EBITDA(1) EBITDA(1)
RECENTLY COMPLETED PIPELINE TOTAL REVENUE ENHANCING
▪ Additional rooms in Emeryville, Buckhead, ▪ Guestroom additions
South San Francisco and Milpitas ▪ Parking contract renegotiations Projects require small investments
▪ Retail / antenna leases while generating significant returns
▪ New meeting space in Buckhead
▪ Antenna, retail and amenity fees ▪ Amenity fees
▪ F&B reconfigurations
(1) Annual, upon stabilization
OCTOBER 2021 24MARGIN EXPANSION | MANAGEMENT AGREEMENT AMENDMENTS
Amendments provide favorable terms with increased flexibility
▪ Harvest the embedded value at contract renewals
~50 Improved
Margins(1)
to reduce fees + additional incentives
• Reduce base fees by 50 to 125 bps
bps • Additional incentives:
• Key money
~$85 Value
Total • Fee ramp at certain assets
Enhanced contract flexibility will enhance exit
M Creation
(2)
▪
value
• Significantly increase the number of agreements with
$7 Incremental
“at-will” termination and terminable on sale
Pipeline of 2022 - 2023 renewals should generate
EBITDA(1) ▪
M incremental margin improvement and EBITDA
• Management agreements at 20 hotels are either
month-to-month or maturing near-term
Margin lift from amended contracts are incremental to 2019 EBITDA margins
(1) Annualized, based on 2019A
(2) Assumes 12x average industry mid-cycle multiple
OCTOBER 2021 25MARGIN EXPANSION | COMPLETED AND PIPELINE
Represents ~50 bps of incremental margins, including ~30 bps of recently completed initiatives and
~20 bps from 2022 - 2023 renewals
Portfolio Margin Lift(1) | Completed vs. Pipeline
COMPLETED PIPELINE
+20 bps 32.3%
+30 bps 32.1%
31.8%
2019 Recent Amendments Pro forma Near-term Amendments Adj. Pro forma
Total margin lift incremental to expected industrywide post COVID-19 EBITDA margin expansion
(1) Annualized, based on 2019A
OCTOBER 2021 26STRONG
LIQUIDITY
AND
BALANCE SHEET
RENAISSANCE PITTSBURGH
OCTOBER 2021 27STRONG AND FLEXBILE BALANCE SHEET
Recent financing initiatives have created significant flexibility to drive growth and further
strengthened balance sheet
Raised $1.0B of debt in 2021 resulting in improved laddering of debt maturities and
reduced interest expense
▪ June: completed an oversubscribed, $500M five-year, high-yield bond offering
− Annual coupon of 3.75%; tightest pricing ever for a non-investment grade lodging REIT
− Proceeds used to repay 2021, 2022 and 2023 maturing debt
▪ September: completed a $500M eight-year, high-yield bond offering
− Annual coupon of 4.0%
− Proceeds used to redeem Sr. Notes at 6.0%, representing annual interest savings of $9.5M
▪ Extended weighted average maturity by 1.4 years and reduced weighted average interest rate by ~50 bps
Amended our corporate credit agreements
▪ Covenant waivers through Q1 2022
▪ Added option for one-year extension on $225M of 2023 maturing term loans
▪ Extended the maturity on $100 million term loan from January 2022 to June 2024
▪ Increased acquisition bucket to $450M(1)
$658M $1.0B + 100%
Unrestricted Cash(2) Total Liquidity(2) Debt Fixed or Hedged(2)
(1) Subject to zero balance on the line of credit
(2) As of June 30, 2021
OCTOBER 2021 28BEST-IN-CLASS BALANCE SHEET
RLJ has solid liquidity, low leverage and a well-staggered maturity profile with no debt maturities
until 2023
RLJ maintains best-in-class balance sheet
▪ Entered 2020 with Net Debt to EBITDA of 3.1x, below peer average
▪ ~$658M of cash as of June 30th
▪ Nearest debt maturity is only $94M in 2023
▪ $400M of undrawn line of credit
▪ 100% of debt is fixed or hedged and 83 of 97 hotels are unencumbered(1)
Debt Maturity Schedule(2)
Secured Senior Notes Unsecured Term Loans Revolver Undrawn Revolver
Amount Due ($ in millions)
$400
$200
$500
$325
$400 $500
$200 $181
$94
2021 2022 2023 2024 2025 2026 2027 2028 2029
% of Debt
Outstanding - - 4% 22% 25% 28% - - 21%
(1) Portfolio as of September 15, 2021
(2) As of September 15, 2021; pro forma for the repayment of $475M FelCor Senior Notes due 2025; assumes all extension options are exercised; % of Debt Outstanding based on Revolver balance of $200M
OCTOBER 2021 29INVESTMENT HIGHLIGHTS
RLJ’s portfolio construct, embedded growth catalysts and liquidity uniquely position the Company to
outperform throughout the entire lodging cycle
▪ Outperforming during early recovery with strong occupancy and positive
OPERATING cash flow
PERFORMANCE
– Poised to benefit from the next leg of recovery as Business Travel and Group strengthen
HIGH-QUALITY ▪ RLJ’s reshaped portfolio has an enhanced growth profile
PORTFOLIO – Lean operating model and footprint is ideally suited to benefit throughout this cycle
▪ Actively deploying capital - executed on a high-quality acquisition in a
EXTERNAL
GROWTH growth market
– Strong pipeline of attractive acquisition opportunities
UNLOCKING ▪ Positioned to deliver $23M - $28M of incremental EBITDA from
INTERNAL
GROWTH Conversions, Revenue Enhancements and Margin Expansion initiatives
CATALYSTS – Ability to generate “above-cycle” growth
STRONG ▪ Over $1.0B of liquidity, significant flexibility and a well-laddered debt
BALANCE maturity profile
SHEET
– Balance sheet positioned to support growth initiatives
EMBASSY SUITES MANDALAY BEACH RESORT
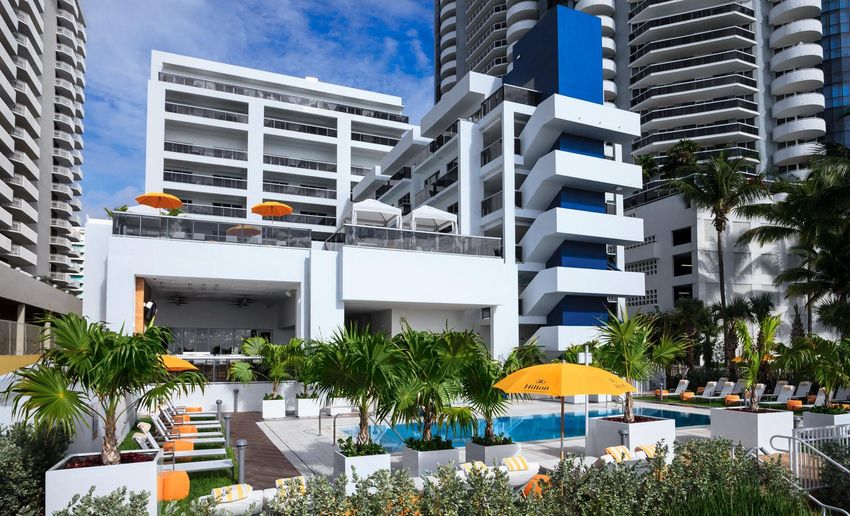
OCTOBER 2021 30ESG
UPDATE
HILTON CABANA MIAMI BEACH
OCTOBER 2021 31RLJ ESG | CORPORATE RESPONSIBILITY
Our sustainability strategy aligns our ESG objectives with our commitment to all stakeholders
▪ In recognition of the strategic importance of increasing environmental
efficiency we…
– Achieved cost reductions through investment in energy, carbon and water efficiency projects
ENVIRONMENTAL
across our portfolio
– Routinely track asset efficiency profile to monitor progress and identify opportunities for
continued cost and energy reductions
▪ Our commitment and leadership on social responsibility continues with…
– Supporting communities through inclusive labor practices, policies and philanthropic volunteer
and donation programs that encourage a culture of generosity and community engagement
SOCIAL
– Maintaining a diverse and inclusive culture at all levels of our organization from associate to
board membership
▪ We are strengthening our approach to governance by…
– Maintaining transparency with investors on our strategic approach to ESG performance
– Establishing a Corporate Responsibility Committee reporting to the Board of Trustees
GOVERNANCE
OCTOBER 2021 32RLJ ESG | CORPORATE RESPONSIBILITY IMPACT
Our longstanding commitment to ESG is evidenced by…
ENVIRONMENTAL SOCIAL GOVERNANCE
▪ 77% of our properties have equipped Associate Ethnicity ▪ Maintain a highly diverse and independent Board,
guestrooms with digital thermostats and committed to continuing refreshment
− 7 of 9 trustees are independent, including all
▪ 76% of our properties utilize an environmental members of our Board Committees
management system, while 73% have low-flow 30%
− 3 of 9 trustees are women
toilets, faucets, or showerheads 44% − 5 of 9 trustees are ethnically diverse
▪ 40% cost savings on water & carbon reduction − Trustee skills, qualifications and experience matrix
investments are disclosed in proxy statements
18%
3% 5%
▪ Robust Code of Business Conduct and Ethics to
8.70
consistently guide and set our ethical standards
8.12
7.98 across our Company
African American Asian Hispanic Other White
▪ 56% of trustees are ethnically diverse, with ▪ Robust policy development centered around
2017 2018 2019
33% female ethics and risk mitigation
Carbon Intensity (kgCO2e)
137.06 ▪ Over half of RLJ’s corporate employees are Board Independence
136.62
ethnically diverse, with 52% female
132.06
▪ RLJ is active in social contribution with over 22%
2017 2018 2019 $4 million in donations and 427 service hours
Water Intensity (kGal) among associates
25.69 PARTNERSHIPS
25.46
25.25 78%
2017 2018 2019
Independence Executive Chairman & CEO
Energy Intensity (kWh)
OCTOBER 2021 33FORWARD-LOOKING STATEMENTS
This information contains certain statements, other than purely historical information, including estimates, projections, statements relating to the Company’s business plans,
objectives and expected operating results, measures being taken in response to the COVID-19 pandemic, and the impact of the COVID-19 pandemic on our business, and the
assumptions upon which those statements are based, that are “forward-looking statements” within the meaning of the Private Securities Litigation Reform Act of 1995, Section
27A of the Securities Act of 1933, as amended and Section 21E of the Securities Exchange Act of 1934, as amended. These forward-looking statements generally are
identified by the use of the words “believe,” “project,” “expect,” “anticipate,” “estimate,” “plan,” “may,” “will,” “will continue,” “intend,” “should,” or similar expressions.
Although the Company believes that the expectations reflected in such forward-looking statements are based upon reasonable assumptions, beliefs and expectations, such
forward-looking statements are not predictions of future events or guarantees of future performance and the Company’s actual results could differ materially from those set
forth in the forward-looking statements. Some factors that might cause such a difference include the following: the current global economic uncertainty and a worsening of
global economic conditions or low levels of economic growth; the duration and scope of the COVID-19 pandemic and its impact on the demand for travel and on levels of
consumer confidence; actions governments, businesses and individuals take in response to the pandemic, including limiting or banning travel; the impact of the pandemic on
global and regional economies, travel, and economic activity; the speed and effectiveness of vaccine and treatment developments and their deployment, including public
adoption rates of COVID-19 vaccines; the pace of recovery when the COVID-19 pandemic subsides; the effects of steps we and our third party management partners take to
reduce operating costs; increased direct competition, changes in government regulations or accounting rules; changes in local, national and global real estate conditions; declines
in the lodging industry, including as a result of the COVID-19 pandemic; seasonality of the lodging industry; risks related to natural disasters, such as earthquakes and
hurricanes; hostilities, including future terrorist attacks or fear of hostilities that affect travel and epidemics and/or pandemics, including COVID-19; the Company’s ability to
obtain lines of credit or permanent financing on satisfactory terms; changes in interest rates; access to capital through offerings of the Company’s common and preferred
shares of beneficial interest, or debt; the Company’s ability to identify suitable acquisitions; the Company’s ability to close on identified acquisitions and integrate those
businesses; and inaccuracies of the Company’s accounting estimates. Moreover, investors are cautioned to interpret many of the risks identified under the section entitled "Risk
Factors" in the Company's Form 10-K for the year ended December 31, 2020 as being heightened as a result of the ongoing and numerous adverse impacts of the COVID-19
pandemic. Given these uncertainties, undue reliance should not be placed on such statements. Except as required by law, the Company undertakes no obligation to update or
revise publicly any forward-looking statements, whether as a result of new information, future events or otherwise. The Company cautions investors not to place undue reliance
on these forward-looking statements and urges investors to carefully review the disclosures the Company makes concerning risks and uncertainties in the sections entitled “Risk
Factors,” “Forward- Looking Statements,” and “Management’s Discussion and Analysis of Financial Condition and Results of Operations” in the Company’s Annual Report, as
well as risks, uncertainties and other factors discussed in other documents filed by the Company with the Securities and Exchange Commission.
OCTOBER 2021 34You can also read


