Bali Hotel & Branded Residences Update 2014 - Hotel, Tourism and Leisure
←
→
Page content transcription
If your browser does not render page correctly, please read the page content below

TM

Hotel, Tourism and Leisure

Bali Hotel & Branded
Residences Update
2014
Bali Hotel & Branded Residences Update                                             2014

 HOTEL & BRANDED RESIDENCES UPDATE                        BALI DOMESTIC VS FOREIGN

 Bali hoteliers are weathering
 the storm of new supply with
 solid performance. Rates are
 slipping, caution caution,
 but occupancy is strong. Bali
 is successfully broadening its
 demand base, developments
 are spreading, the airport is                            Source : BPS Indonesia
 operational and the future
 looks bright.                                            The second phase of Ngurah Rai Airport expansion was
                                                          completed (more or less) in mid-September 2014
                                                          evidently boosting terminal capacity to 25 million
 BALI TOURISM ARRIVALS
                                                          passengers. Anticipating the opening, airport
 The Bali’s tourism arrivals boom continued in 2013,
                                                          authorities increased the airport tax for international
 recording a 14% increase YOY. Foreign arrivals out
                                                          and domestic flights by 33% and 88% respectively in
 performed expectations with 13% growth compared
                                                          April 2014.
 to 2012’s 4% increase. Year-end 2013 and 2012,
 showed Indonesians were the number one source
                                                          In 2013, Ngurah Rai trumped other airports across
 market for the island contributing 68% of total
                                                          Indonesia in attracting the greatest number and the
 arrivals. YTD August 2014 and the fun continues,
                                                          greatest growth (13%) in foreign arrivals. Soeharno
 with BPS preliminary data showing that foreign
                                                          Hatta foreign arrivals jumped by a smaller 3% and
 arrivals are up a further 15% YOY. Good times and a
                                                          Batam’s Airport 5%. In H1 2014 growth rates at Soe-Ta
 welcome relief to hotelies who are battling increased
                                                          and Hang Nadim were slower YOY. The slowdown in
 room inventory across the island.
                                                          Jakarta arrivals can be attributed to the elections
                                                          uncertainty, a wave of public holidays and the lack of
 Big news this month is that newly elected President
                                                          major international events being held in the city (2%
 Jokowi has pushed through visa free entry to passport
                                                          growth YOY). The expansion of Soekarno Hatta Airport
 holders from Australia, China, South Korea, Japan and
                                                          should be completed by year end 2015 which will
 Russia. This is squarely aimed at boosting numbers
                                                          greatly alleviate the current bottleneck (and perhaps
 from the top 5 international source markets and will
                                                          we will get the occasional air bridge) by increasing
 no doubt have that effect from 1 January 2015 when
                                                          capacity to 32 million passengers.
 the rule kicks in. One less queue at Ngurah Rai
 Airport.
                                                          INDONESIA TOP 3 AIRPORTS

 Low cost carriers continue to play an integral part in
 transporting Indonesians to Bali. That said, it would
 be worthwhile if the government helped develop
 other means of transportation to boost water arrivals
 which currently accounts for 37% of the Indonesian
 domestic market (63% by plane). This will have the
 additional benefit of pushing tourism arrivals to the
 west and away from increasingly crowded south            Source : BPS Indonesia
 Bali. Ferries and boats are not popular with
 international arrivals, carrying less than 2% of total
 arrivals.

www.horwathhtl.com      www.c9hotelworks.com/                                         TM
Bali Hotel & Branded Residences Update                                         2014

  PHUKET VS BALI: DOMESTIC MARKET WILL BE                  Secondly, arrival mode differs with Bali airport
  A GAME CHANGER                                           reporting 38% more movements than Phuket with
  Short update on the Phuket vs Bali battle for regional   about 15.6 million. It is understood that less than 40%
  tourism supremacy and Phuket is going from strength      of Phuket’s international arrivals come through the
  to strength! Since 2011 when Phuket overtook Bali in     airport, with the majority crossing the bridge from the
  total tourism arrivals, Phuket has continued to blast    mainland (something that is not possible in Bali…).
  forward welcoming nearly 12 million tourists in 2013     This would typically indicate that for those 60%,
  in comparison to Bali’s 10.2 million. As noted           Phuket was not the only Thai destination visited.
  previously the tourist dynamic is very different
  between the 2 destinations. Firstly, Phuket attracts     Bali has similar potential to become a multi-stop
  predominantly foreigners and Bali predominantly          tourism hub surrounded by well-known destinations
  Indonesians (both around 70%).                           including Bromo, Malang Highlands, Alas Purwo
                                                           National Park, Lombok of course, Labuan Bajo and the
                                                           Komodo National Park. The development of safe,
   FOREIGN BALI VS PHUKET
                                                           secure, licensed and insured alternative transportation
                                                           solutions connecting the islands has great potential.

                                                           President Jokowi’s vision of Indonesia becoming a
                                                           maritime power in the Indo-Pacific region feeds well
                                                           into the creation of a maritime tourism hub in Bali. The
                                                           plan includes the construction of more deep sea ports
                                                           and incentives for shipyard businesses in the short term.

  Source : BPS Indonesia and TAT

 www.horwathhtl.com          www.c9hotelworks.com/                                      TM
Bali Hotel & Branded Residences Update                                               2014

 NATIONALITY MIX                                            Something to note is a significant increase in guests
                                                            from the Middle East which traditionally favoured
                                                            West Java (Bogor and Bandung) over Bali as it is more
                                                            Islamic and offers the cool climate unlike Bali.

                                                             TOP FIVE FOREIGN MARKETS
                                                             YTD SEPTEMBER 2014

                                                             Australia        26%
  Source : BPS Indonesia                                     China            16%
                                                             Malaysia         6%
  In 2013, Singapore replaced South Korea in the top         Japan            6%
 5 source markets for foreign arrivals to Bali possibly      Singapore        5%
 due to a few factors: shift away from Bintan due to
                                                             TOP FIVE GROWTH MARKETS
 the lack of improvements and limited choice of
                                                             YTD SEPTEMBER 2014
 accommodation; easy and affordable air connectivity
 between Singapore and Bali; and bad publicity run           China            144,153
 by a major South Korean TV station over alleged key         Australia        120,677
 card fraudsters. Singapore retained its place in the        Singapore         33,731
 top 5 YTD September 2014, with more than 33                 Malaysia          18,067
 thousand extra Singaporeans holidaying in Bali.             India             15,644

 The other 4 big source markets have remained the            TOP FIVE REGIONAL MARKETS 2013
 same since 2012 with Australia rebounding strongly          Asia Others      32%
 YTD 2014 after a slow performance in 2013. This was         Australasia & NZ 28%
 possibly due to poor publicity about increasing cases       Europe           20%
 of dengue fever and other infectious diseases plus an       ASEAN            12%
 Australian government travel advisory at the end of         Americas          5%
 2013.
                                                            Source : BPS Statistics Indonesia

  2012 and 2013 were great years for the Japanese
  market after a series of bad years with declining
  numbers since 2008. YTD September and the tide            ADR vs OCCUPANCY, CHANGE IN FOCUS
  has turned again, with arrivals numbers down 2%           After years of consistent rate growth, Bali market USD
  YOY.                                                      ADR declined 1% in 2013 and a further 3% YTD
                                                            September 2014. The great flipside is that market
 Hooray for the Chinese, recording strong growth            occupancy bumped 5% in 2013 and a further 4% YTD
 again YTD 2014 up over 144,000 people YOY. This            September 2014.
 was in part due to the negative sentiment
 surrounding Malaysia after the MH370 disaster
 together with continuing geopolitical rumblings
 between the PRC and Thailand, Vietnam and the
 Philippines.

 As India develops further, it remains a relatively
 undeveloped market for Bali, with no direct flights
 connecting the two. There are similar cultural and
 religious aspects to explore and the tourism authorities
 are now placing more effort behind promoting Bali
 and Indonesia to this market.

www.horwathhtl.com         www.c9hotelworks.com/                                                TM
Bali Hotel & Branded Residences Update                                          2014

 HOTEL PERFORMANCE 2009 -                                LUXURY HOTEL PERFORMANCE 2009 -
 YTD SEPTEMBER 2014                                      YTD SEPTEMBER 2014

 Source : BHA and Horwath HTL                            Source : BHA and Horwath HTL

 Q4 is traditionally a strong quarter pushing YE         UPPER UPSCALE (USD 151 - 349): Both
 occupancy higher than YTD September occupancy,          occupancy and ADR are down for this segment. This
 as indicated by hotel performance in 2012 and 2013.     is attributed to the 13% increase in supply weighing
 October was a great month for Bali hotels so there is   heavily upon the market, despite healthy RND growth
 nothing to suggest that market occupancy will not       of 10%. ADR remained quite flat and the resulting
 end 2014 at 73% or slightly higher.                     USD RevPAR was down 4% YOY.

 Occupancy growth has been assisted by an increase       YTD Sept 2014 and a 4% bump in RND outstripped
 in ALOS in the last couple of years. Based on BPS       RNA with a resultant increase in occupancy of about
 data, ALOS of tourists in Bali increased to 9.6 from    3% YOY. The slide in ADR worsened however as the
 9.1 days for foreigners and 3.6 to 3.7 days for the     newer properties are still ramping up their
 domestic tourist (2013 over 2012). Some of this can     performance pulling the market ADR down about 3%
 be attributed to increasing long haul tourists from     (rather than assuming that all hotels reduced rates).
 Europe (France, England and Germany mostly) and         Ultimately RevPAR grew by a single dollar to USD 155
 America.                                                YOY.

 PERFORMANCE BY SEGMENT                                  UPPER UPSCALE HOTEL PERFORMANCE 2009
 Luxury (> USD 350): this was the only segment           -YTD SEPTEMBER 2014
 with positive USD RevPAR performance in 2013, an
 interesting parallel to hotel performance in Jakarta.
 YOY, RND was up 3%, RNA up slightly less, ADR up
 3% with a resultant 4% YOY increase in RevPAR.

 This is despite BPS data showing a 5% decrease in
 the average foreign tourist spend in 2013.

 YTD September 2014 and the luxury segment
 remains in positive growth territory, with occupancy
 increasing to 57% and the USD ADR up 1%. This is
 reflected in a 3% YOY increase in RevPAR.

                                                         Source : BHA and Horwath HTL

www.horwathhtl.com        www.c9hotelworks.com/                                         TM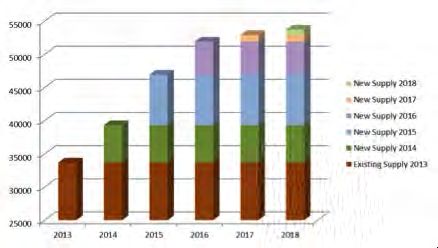
Bali Hotel & Branded Residences Update                                    2014

 UPSCALE (USD 101 - 150): The pressure of new      MIDSCALE (USD 40 – 101): the midscale category
 supply also started affecting upscale hotels’     saw a 6% increase in supply in 2013 but demand failed
 performance in 2013. Despite a small growth in    to match supply and occupancy fell by 1% over 2012.
 RND (around 1%), the average ADR, occupancy and   ADR also fell in the midscale segment, but
 RevPAR each fell by 2%, 4% and 8% respectively.   unfortunately by a larger margin and on the back of
                                                   falls in 2012. ADR ended 2013 down 8% over 2012
 This market segment may also have been affected   and RevPAR was down 9% YOY. It appears to be an
 by the lower average spend in 2013 (chicken and   occupancy end-game in this segment as occupancy
 egg) of Indonesians who lowered their spending    remains solid.
 average by 22% YOY, significantly more than the
 5% drop in foreign spend.                         YTD September 2014 is somewhat brighter with
                                                   occupancy up 2% in line with the 2% growth in RND.
 YTD September 2014 and RND growth is very         What is not brighter is the continuing fall in ADR,
 encouraging up, 8% YOY which pushed occupancy     down a further 5% ultimately dragging RevPAR down
 up 6% points and RevPAR up 5%. The price war or   by 3% YOY.
 price competition intensified YTD with ADR down
 another 3% YOY. Not a big drop at least.
                                                   MIDSCALE HOTEL PERFORMANCE 2009
                                                   -YTD SEPTEMBER 2014
 UPSCALE HOTEL PERFORMANCE 2009
 -YTD SEPTEMBER 2014

                                                   Source : BHA and Horwath HTL

 Source : BHA and Horwath HTL

www.horwathhtl.com        www.c9hotelworks.com/                                   TM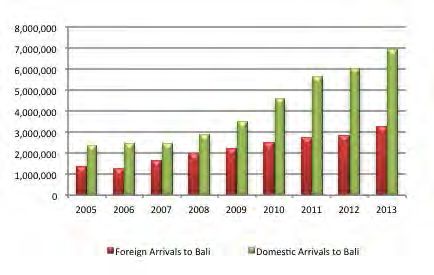
Bali Hotel & Branded Residences Update                                     2014

 OCCUPANCY PERFORMANCE BY LOCATION                     Ubud is the only area able to maintain ADR
                                                       growth for the past 5 years driven mainly by less
                                                       inventory increases, small room counts,
                                                       exclusivity and uniqueness vis a vis beach Bali.
                                                       Jimbaran ADR lept ahead in 2010 but has failed
                                                       to retain the momentum falling slightly in 2013
                                                       and further below Ubud YTD 2014. Increased
                                                       mass tourism oriented developments have
                                                       appeared in Jimbaran including condotels
                                                       resulting in a lowering in image and average
                                                       ADR. Jimbaran and Ubud are still way ahead of
                                                       other areas.

                                                       The next cluster is Legian & Seminyak plus Nusa Dua
 Source : BHA and Horwath HTL
                                                       & Tanjung Benoa with less luxury, more
 Legian & Seminyak lead the pack for occupancy         conventional hotels especially Nusa Dua which is
 performance over Kuta & South Kuta Beach-Tuban        now very well positioned as Bali’s MICE destination.
 in second place. Not surprising, given they also      Kuta & Tuban is the cheapest option, it is the mass
 enjoyed the highest RND growth with 13% YOY           market with everything positive and negative that
 followed by Jimbaran with only 6%.                    goes with it. These hotels are the most affected by
                                                       domestic economics as they house the greatest
 2013 was not a good year in Ubud with the small       proportion of Indonesians. The greatest growth is
 increase in supply of around 2% being matched by      expected from China as Kuta & Tuban has the best
 a RND slump of 2% YOY. As development spans           supporting facilities for big groups, low budgets.
 further west to Tabanan and density increases along   The Others category is a combination of Sanur,
 the South Coast, Ubud must improve its                Tabanan, and Candi Dasa and the rate is mostly
 connectivity to compete with these areas for short    driven by Sanur hotels who traditionally operate with
 term demand.                                          good occupancy but low ADR.

 YTD September 2014, Nusa Dua has excelled             OUTLOOK FOR 2014/15
 generating an additional 58,000 RND YOY, more         In 2013 Indonesia’s central bureau of statistics (BPS)
 than double the second highest growth area. That      recorded 227 official star rated hotels in Bali
 said, occupancy is up in each of the 6 zones          representing nearly 25,000 rooms. The Horwath HTL
 covered thus far this year.                           database recorded nearly 34,000 rooms (including
                                                       non-star rated properties) in 2013, with an additional
 ADR PERFORMANCE BY LOCATION                           5,000+ rooms entering the market in 2014, 3,600+ of
                                                       which are online as of September 2014. By mid-2015,
                                                       Bali inventory is expected to top 40,000 rooms. The
                                                       following table shows projected inventory increases to
                                                       2017 based on rumoured developments.

 Source : BHA and Horwath HTL

www.horwathhtl.com        www.c9hotelworks.com/                                     TM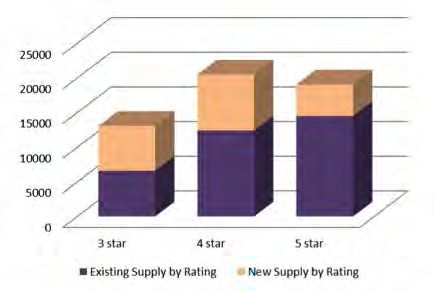
Bali Hotel & Branded Residences Update 2014
SUPPLY GROWTH 2012-2016 Development regulations have been imposed by the
government in an attempt to curb midscale and
economy hotel developments. Minimum land size
restrictions:
• 5,000sqm in Kuta;
• 7,500sqm in North Kuta (Canggu, Seminyak);
and
• 10,000sqm in South Kuta (Jimbaran, Uluwatu,
Nusa Dua, and Tanjung Benoa).
Source : BHA and Horwath HTL
In addition there is a minimum room size requirement
of 32sqm in each of the above areas. This does not
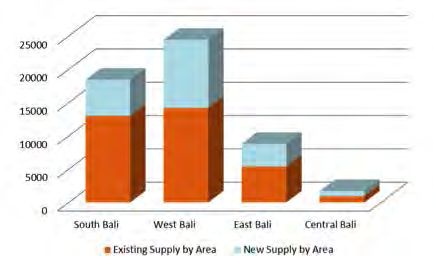
The new hotspot is clearly north-west of Seminyak, apply to hotel licenses that have already been
Canggu and Tabanan with many new hotel approved.
developments plus restaurants, retail and beach
clubs launched or under development. Controversy still surrounds the Tanjung Benoa
reclamation project where 831 hectares of land is the
Kuta, Legian and Seminyak remain strong favourites subject of development plans much to the chagrin of
with developers and guests alike although space now many local groups.
comes at a premium so new properties have
relatively small room counts. South Bali covering Mid-tier and upscale remain the favourite categories
Nusa Dua, Uluwatu, Pecatu, Tanjung Benoa and for developers with fewer larger projects being 4 stars
Jimbaran are going big in terms of average room and the greater number of smaller projects being 3
count. The number of projects is half of north-west stars.
Bali but the room count is much larger.
SUPPLY BY STAR 2012-2016
The jewel in the east, Sanur, is also beginning to
blossom thanks in no small part to the airport toll
road reducing traveling time by half.
Denpasar has a lot more keys in the mid-tier
segment, catering predominantly for domestic
guests with no upscale developments anticipated.
SUPPLY BY AREA 2012-2016
Source : BHA and Horwath HTL
Source : BHA and Horwath HTL
www.horwathhtl.com www.c9hotelworks.com/ TM
Bali Hotel & Branded Residences Update                                           2014

 MONITORING ENERGY & WATER                                 ELECTRICITY KWH/GUEST

 CONSUMPTION
 According to the State Electricity Company, the
 energy supply to Bali is in safe hands with the
 Ministry of Energy and Mineral Resources targeting
 Bali electricity supply will increase to 1,000 MW by
 2018.

  Ground breaking at the government’s Bangli power
  plant occurred in April 2014. The project will be done
  in several phases, with phase one adding 400 MW,
  phase two a further 400 MW.                              Source : BHA and Horwath HTL

 The table below shows the consumption of electricity      On the back of increased population and tourism
 per guest across hotel categories in 2013 and YTD         developments, fresh water supplies are a major
 September 2014. As seen, luxury properties consume        concern to Bali’s local community. Wells are being
 almost triple that of other categories due mainly to      dug deeper and water trucks are ploughing the
 space, facilities and lower key counts. The good news     congested streets delivering much needed extra
 is that consumption has decreased YOY although            supplies.
 higher electrical costs in 2014 have hampered cost
 savings.

www.horwathhtl.com      www.c9hotelworks.com/                                             TM
Bali Hotel & Branded Residences Update                                           2014

 WATER CUBIC METERS/GUEST                                Pricing points and guaranteed yields continue to drive
                                                         sales absorption in the condominium/apartment
                                                         market, while design, location and aspect significantly
                                                         impact villa transactions. Investment motivation
                                                         remains a priority for purchasing properties for both
                                                         domestic and overseas buyers, though Indonesians
                                                         are the driving force in sales momentum. Focusing on
                                                         current trends, market absorption rates have
                                                         markedly declined signaling possible oversupply,
                                                         while pricing continues to shift steadily downwards in
                                                         hope of inducing renewed demand. Looking forward
  Source : BHA and Horwath HTL                           overseas investors are optimistic over possible reforms
                                                         by the Indonesian government allowing foreign
                                                         property ownership.
 As anticipated, greater volumes of water are
 consumed by guests at luxury properties, driven by
 private pools and larger gardens. Interestingly YTD     HOTEL MANAGED APARTMENT/CONDOMINIUM
 2014, consumption is up at luxury hotels and at         PROJECTS - CURRENT INVENTORY
 economy properties with mid-tier and upscale            We have focused on 13 key projects with 1,938 units
 properties successfully implementing water saving       in total, which are managed or branded by hotel
 techniques.                                             operators.

 HOTEL BRANDED RESIDENCES MARKET
 Market sales pace slows as
 unabated development
 surges
 After the economic stress during the Global Financial   Source: C9 Hotelworks Market Research
 Crisis (GFC) in 2008/2009, the Bali resort grade
 property market has skyrocketed in recent years.
 Starting in 2010 up to the present, a steady stream
 of hotel managed projects have been launched into
                                                         Investment oriented property
 the sector. The majority of products are dominated      continues to be the catalyst
 by hotel managed condominiums and apartments.           for Bali’s resort real estate
 Those projects primarily located in Seminyak,
 Jimbaran, Tanjung Benoa, Uluwatu, Bukit, and            sector
 Pecatu and expanding to Canggu and beyond. Bali’s
 outer islands and Lombok are now seeing a tick up in
 real estate development, though sales in these areas
 are coming at significantly lower prices than South
 Bali.

www.horwathhtl.com         www.c9hotelworks.com/                                           TM
Bali Hotel & Branded Residences Update 2014
PRICING PER UNIT
Units falling into 50-70 square
meter range most popular size
INVENTORY MIX
Square meters
Source: C9 Hotelworks Market Research
Nearly 50% of inventory is
priced in range of US
$200,000 – 400,000 per Source: C9 Hotelworks Market Research
unit
UNIT CONFIGURATION MIX
Weighted average market-
wide unit size is 70 square
meters
APARTMENT/CONDOMINIUM PROJECT METRICS
PRICING COMPARISON
Source: C9 Hotelworks Market Research PER SQUARE METER PRICE BY AREA
US $ per sq.m
Suite/studio are most
popular unit types Average
accounting for 79% of
supply
UNIT SIZE MIX Source: C9 Hotelworks Market Research
Source: C9 Hotelworks Market Research
www.horwathhtl.com www.c9hotelworks.com/ TMBali Hotel & Branded Residences Update 2014
Seminyak and Canggu ABSORBTION RATE BY TYPE
Number of units Monthly Sales Pace
generate premium pricing
levels
PER SQUARE METER PRICE BY TYPE
% Units US $ per sq.m
Source: C9 Hotelworks Market Research
Lowest unit pricing points
Source: C9 Hotelworks Market Research stimulates higher average
sales pace
Market-wide average price
HOTEL BRANDED VILLA PROJECTS
per square meter is US - CURRENT INVENTORY
$5,071 Four hotel managed villa projects are represented, with a total
of 127 units.
MARKET ABSORPTION RATE
ABSORPTION RATE BY AREA
Average
Source: C9 Hotelworks Market Research
Bali’s over US$1 million
villas show limited traction
PRICING PER VILLA
Monthly Sales Pace
Source: C9 Hotelworks Market Research
Hotel unit sizing and
attractive pricing points
driving Nusa Dua and
Benoa developments
Source: C9 Hotelworks Market Research
www.horwathhtl.com www.c9hotelworks.com/ TMBali Hotel & Branded Residences Update 2014
INVENTORY MIX
Square meters
Two bedroom villas are
most popular units by sales
pace
PER SQUARE METER PRICE BY TYPE
% Villas US$ per Sq.m
Source: C9 Hotelworks Market Research
Average built-up area for
villas is 369 square meters
Source: C9 Hotelworks Market Research
PRICING COMPARISON AND MARKET
ABSORPTION RATE
ABSORPTION RATE BY TYPE Average sales price per
Number of Villas Monthly Sales Pace square meter registered
US$3,810
Source: C9 Hotelworks Market Research
www.horwathhtl.com www.c9hotelworks.com/ TMTM
ASIA PACIFIC EUROPE NORTH AMERICA
AUCKLAND, NEW ZEALAND AMSTERDAM, NETHERLANDS ATLANTA, USA
auckland@horwathhtl.com amsterdam@horwathhtl.com mbeadle@horwathhtl.com
BANGKOK, THAILAND ANDORRA LA VELLA, ANDORRA ATLANTA, USA
ishweder@horwathhtl.com vmarti@horwathhtl.com pbreslin@horwathhtl.com
BEIJING, CHINA BARCELONA, SPAIN DALLAS, USA
beijing@horwathhtl.com vmarti@horwathhtl.com jbinford@horwathhtl.com
HONG KONG, SAR BUDAPEST, HUNGARY CHICAGO, USA
hongkong@horwathhtl.com mgomola@horwathhtl.com tmandigo@horwathhtl.com
JAKARTA, INDONESIA DUBLIN, IRELAND DENVER, USA
jakarta@horwathhtl.com ireland@horwaththl.com jmontgomery@horwathhtl.com
KUALA LUMPUR, MALAYSIA FRANKFURT, GERMANY LOS ANGELES, USA
kl@horwathhtl.com frankfurt@horwathtl.com ynathraj@horwathhtl.com
MUMBAI, INDIA ISTANBUL, TURKEY LAS VEGAS, USA
vthacker@horwathhtl.com merdogdu@horwathhtl.com lboll@horwathhtl.com
SHANGHAI, CHINA LISBON, PORTUGAL MONTREAL, CANADA
shanghai@horwathhtl.com vmarti@horwathhtl.com pgaudet@horwathhtl.com
SINGAPORE, SINGAPORE LONDON, UK NEW YORK, USA
singapore@horwathhtl.com eheiberg@horwathhtl.com sdavis@horwathhtl.com
SYDNEY, AUSTRALIA MADRID, SPAIN PHOENIX, USA
jsmith@horwathhtl.com.au vmarti@horwathhtl.com ddean@horwathhtl.com
TOKYO, JAPAN MOSCOW, RUSSIA SAN FRANCISCO, USA
tokyo@horwathhtl.com mohare@horwathhtl.com jhiser@horwathhtl.com
OSLO, NORWAY TORONTO, CANADA
oslo@horwathhtl.com horwath@horwathhtl.com
LATIN AMERICA
BUENOS AIRES, ARGENTINA PARIS, FRANCE
cspinelli@horwathhtl.com pdoizelet@horwathhtl.com
AFRICA
SÃO PAULO, BRAZIL ROME, ITALY CAPE TOWN, SOUTH AFRICA
mcarrizo@horwathhtl.com zbacic@horwathhtl.com capetown@horwathhtl.com
MEXICO CITY, MEXICO SALZBURG, AUSTRIA
mjgutierrez@horwathhtl.com DAKAR, SENEGAL
gkroell@horwathhtl.com
bmontagnier@horwathhtl.com
DOMINICAN REPUBLIC WARSAW, POLAND
sotero.peralta@crowehorwath.com.do jmitulski@horwathhtl.com
SANTIAGO, CHILE ZAGREB, CROATIA
cspinelli@horwathhtl.com scizmar@horwathhtl.com
BOGOTA, COLOMBIA ZUG, SWITZERLAND
mjgutierrez@horwathhtl.com hwehrle@horwathhtl.com
C9 Hotelworks Company Ltd
9 Lagoon Road, Cherngtalay,
Thalang, Phuket 83110, Thailand
T: +66 (0)81 956 1802
E: bill@c9hotelworks.com
www.c9hotelworks.com
www.horwathhtl.comYou can also read


