Potential Business Combination between Landcadia Holdings, Inc. and Waitr Incorporated - August 2018

Page created by Alma Morales
 
CONTINUE READING
Potential Business Combination between Landcadia Holdings, Inc. and Waitr Incorporated - August 2018
Potential Business Combination
between Landcadia Holdings,
Inc. and Waitr Incorporated      August 2018
Potential Business Combination between Landcadia Holdings, Inc. and Waitr Incorporated - August 2018
Important Information
This investor presentation (“Investor Presentation”) is for informational purposes only and does not constitute an offer to sell, a solicitation of an offer to buy, or a recommendation to purchase any equity, debt or other financial instruments of Landcadia Holdings, Inc. (“Landcadia”) or Waitr Incorporated
(“Waitr”) or any of Landcadia’s or Waitr’s affiliates. The Investor Presentation has been prepared to assist parties in making their own evaluation with respect to the proposed business combination (the “Business Combination”), as contemplated in the Agreement and Plan of Merger (the “Merger Agreement”),
of Landcadia and Waitr and for no other purpose. It is not intended to form the basis of any investment decision or any other decision in respect of the Business Combination. The information contained herein does not purport to be all-inclusive. The data contained herein is derived from various internal and
external sources. No representation is made as to the reasonableness of the assumptions made within or the accuracy or completeness of any projections or modeling or any other information contained herein. Any data on past performance or modeling contained herein is not an indication as to future
performance. Landcadia and Waitr assume no obligation to update the information in this Investor Presentation.
Important Information About the Business Combination and Where to Find It
In connection with the proposed Business Combination, Landcadia intends to file a preliminary proxy statement and a definitive proxy statement with the United States Securities and Exchange Commission (“SEC”). Landcadia’s stockholders and other interested persons are advised to read, when available,
the preliminary proxy statement and the amendments thereto and the definitive proxy statement and documents incorporated by reference therein filed in connection the Business Combination, as these materials will contain important information about Waitr, Landcadia and the Business Combination. When
available, the definitive proxy statement and other relevant materials for the Business Combination will be mailed to stockholders of Landcadia as of a record date to be established for voting on the Business Combination. Stockholders will also be able to obtain copies of the preliminary proxy statement, the
definitive proxy statement and other documents filed with the SEC that will be incorporated by reference therein, without charge, once available, at the SEC’s web site at www.sec.gov, or by directing a request to: Landcadia Holdings, Inc., 1510 West Loop South, Houston, Texas 77027, Attention: General
Counsel, (713) 850-1010.
Participants in the Solicitation
Landcadia, its directors and executive officers, and its sponsors, Fertitta Entertainment, Inc. and Jefferies Financial Group Inc. (f/k/a Leucadia National Corporation), may be deemed participants in the solicitation of proxies from Landcadia’s stockholders with respect to the Business Combination. A list of the
names of those directors and executive officers and a description of their interests in Landcadia is contained in Landcadia’s annual report on Form 10-K for the fiscal year ended December 31, 2017, which was filed with the SEC and is available free of charge at the SEC’s web site at www.sec.gov, or by
directing a request Landcadia Holdings, Inc., 1510 West Loop South, Houston, Texas 77027, Attention: General Counsel, (713) 850-1010. Additional information regarding the interests of such participants will be contained in the proxy statement for the Business Combination when available.
Waitr and its directors and executive officers may also be deemed to be participants in the solicitation of proxies from the stockholders of Landcadia in connection with the Business Combination. A list of the names of such directors and executive officers and information regarding their interests in the
Business Combination will be included in the proxy statement for the Business Combination when available.
Forward-Looking Statements
This presentation includes “forward-looking statements” within the meaning of the “safe harbor” provisions of the Private Securities Litigation Reform Act of 1995. Landcadia’s and Waitr’s actual results may differ from their expectations, estimates and projections and consequently, you should not rely on these
forward looking statements as predictions of future events. Words such as “expect,” “estimate,” “project,” “budget,” “forecast,” “anticipate,” “intend,” “plan,” “may,” “will,” “could,” “should,” “believes,” “predicts,” “potential,” “continue,” and similar expressions are intended to identify such forward-looking
statements. These forward-looking statements include, without limitation, Landcadia’s and Waitr’s expectations with respect to future performance and anticipated financial impacts of the Business Combination, the satisfaction of the closing conditions to the Business Combination and the timing of the
completion of the Business Combination. These forward-looking statements involve significant risks and uncertainties that could cause the actual results to differ materially from the expected results. Most of these factors are outside Landcadia’s and Waitr’s control and are difficult to predict. Factors that may
cause such differences include, but are not limited to: (1) the occurrence of any event, change or other circumstances that could give rise to the termination of the Merger Agreement or could otherwise cause the transaction to fail to close; (2) the outcome of any legal proceedings that may be instituted
against Landcadia and Waitr following the announcement of the Merger Agreement and the transactions contemplated therein; (3) the inability to complete the Business Combination, including due to failure to obtain approval of the stockholders of Landcadia or other conditions to closing in the Merger
Agreement; (4) the receipt of an unsolicited offer from another party for an alternative business transaction that could interfere with the proposed Business Combination; (5) the inability to obtain or maintain the listing of the post-acquisition company’s ordinary shares on The Nasdaq Stock Market following the
Business Combination; (6) the risk that the announcement and consummation of the Business Combination disrupts current plans and operations; (7) the ability to recognize the anticipated benefits of the Business Combination, which may be affected by, among other things, competition, the ability of the
combined company to grow and manage growth profitably and retain its key employees; (8) costs related to the Business Combination; (9) changes in applicable laws or regulations; (10) the possibility that Waitr or the combined company may be adversely affected by other economic, business, and/or
competitive factors; and (11) other risks and uncertainties indicated from time to time in the proxy statement relating to the Business Combination, including those under “Risk Factors” therein, and in Landcadia’s other filings with the SEC. Landcadia cautions that the foregoing list of factors is not exclusive.
Landcadia cautions readers not to place undue reliance upon any forward-looking statements, which speak only as of the date made. Landcadia does not undertake or accept any obligation or undertaking to release publicly any updates or revisions to any forward-looking statements to reflect any change in its
expectations or any change in events, conditions or circumstances on which any such statement is based.
No Offer or Solicitation
This presentation shall not constitute a solicitation of a proxy, consent or authorization with respect to any securities or in respect of the Business Combination. This presentation shall also not constitute an offer to sell or the solicitation of an offer to buy any securities, nor shall there be any sale of securities in
any states or jurisdictions in which such offer, solicitation or sale would be unlawful prior to registration or qualification under the securities laws of any such jurisdiction. No offering of securities shall be made except by means of a prospectus meeting the requirements of section 10 of the Securities Act of
1933, as amended.
Industry and Market Data
In this presentation, we rely on and refer to information and statistics regarding market participants in the sectors in which Waitr competes and other industry data. We obtained this information and statistics from third-party sources, including reports by market research firms, and company filings.
Preliminary Results
The financial results presented in this investor presentation are preliminary and unaudited. They are subject to the completion and finalization of Waitr’s financial and accounting procedures, and reflect management’s estimate based solely upon information available to management as of the date of this
investor presentation. Further information learned during that completion and finalization may alter the final results. In addition, the preliminary estimates should not be viewed as a substitute for full quarter financial statements prepared in accordance with generally accepted accounting principles in the United
States of America.
Projected Financial Information
This presentation contains financial forecasts, including with respect to Waitr’s gross food sales and revenue for Waitr’s fiscal years 2018-2020. These financial forecasts were prepared in good faith by Landcadia and Waitr on a basis believed to be reasonable. Such financial forecasts have not been prepared
in conformity with GAAP. Neither Landcadia’s nor Waitr’s independent auditors have audited, reviewed, compiled or performed any procedures with respect to the projections for the purpose of their inclusion in this presentation, and accordingly, neither of them expressed an opinion nor provided any other
form of assurance with respect thereto for the purpose of this presentation. These projections are for illustrative purposes only and should not be relied upon as being necessarily indicative of future results. Certain of the above-mentioned projected information has been provided for purposes of providing
comparisons with historical data. The assumptions and estimates underlying the prospective financial information are inherently uncertain and are subject to a wide variety of significant business, economic and competitive risks and uncertainties that could cause actual results to differ materially from those
contained in the prospective financial information. Projections are inherently uncertain due to a number of factors outside of Waitr’s control. Accordingly, there can be no assurance that the prospective results are indicative of future performance of Waitr or the combined company after the Business
Combination or that actual results will not differ materially from those presented in the prospective financial information. Inclusion of the prospective financial information in this presentation should not be regarded as a representation by any person that the results contained in the prospective financial
information will be achieved.
Trademarks
As of the date of this presentation, Waitr had two trademarks registered in the United States, including “Waitr.” This presentation may contain trademarks, service marks, trade names and copyrights of other companies, which are the property of their respective owners. Solely for convenience, the trademarks,
service marks, trade names and copyrights referred to in this presentation are listed without the TM, SM, © and ® symbols, but Waitr will assert, to the fullest extent under applicable law, its rights or the rights of the applicable owners, if any, to these trademarks, service marks, trade names and copyrights.

                                     / Landcadia                                                                                                                                                                                                                                                                                  2
Potential Business Combination between Landcadia Holdings, Inc. and Waitr Incorporated - August 2018
Delivering On Landcadia’s Investment Thesis

  Restaurant ordering and food delivery technology platform

  Massive underpenetrated market

  Tremendous organic growth

  Actionable acquisition opportunities to drive scale

  Great customer experience and differentiated value proposition for restaurant partners

  Capital efficient model with strong unit economics – with a proven track record

  Significant operating leverage on par with industry leaders

  Highly complementary with Landcadia’s sponsors

           / Landcadia                                                                      3
Potential Business Combination between Landcadia Holdings, Inc. and Waitr Incorporated - August 2018
Landcadia Brings Industry Expertise And Strong Sponsorship

    Access to Tilman J. Fertitta and the Landry’s management team

    Immediate access to restaurants to seed new growth markets

    Promotion of Waitr as a delivery partner within Fertitta’s portfolio of over 4 million loyalty
     members across Landry’s restaurants and Golden Nugget Casinos

    Tilman J. Fertitta will drive elevated media exposure nationally and in strategic markets for
     Waitr

    Partnership with NBA Houston Rockets - over 10 million Facebook followers alone

           / Landcadia                                                                                4
Potential Business Combination between Landcadia Holdings, Inc. and Waitr Incorporated - August 2018
Summary Transaction Terms
($ and shares in millions, except per share values)
Transaction Terms                                                                                                                          Sources & Uses
•      Pro-forma enterprise value of $388 million                                                                                                                                       Sources of Funds
       –     Implied 2018E revenue multiples of 5.8x - 6.3x(1)                                                                                         LCA Cash                                                                            $235.6
                                                                                                                                                                                                                                                      (3)

                                                                                                                                                       Waitr Rollover Equity                                                                 225.0
       –     Implied 2019E revenue multiples of 3.0x - 3.2x(2)                                                                                         Total Sources                                                                       $460.6
•      $141 million of cash to fund growth initiatives and for general
       corporate purposes                                                                                                                                                                  Uses of Funds
                                                                                                                                                       Cash to existing Waitr Shareholders                                                   $75.0
•      Existing Waitr owners receive total consideration of $308
                                                                                                                                                       Fund Balance Sheet                                                                    140.6
       million(3)
                                                                                                                                                       Waitr Rollover Equity                                                                 225.0
       –     Transaction consideration includes $75 million of cash and                                                                                Estimated Fees & Expenses                                                                20.0
             22.5 million of shares in Landcadia at close(4)                                                                                           Total Uses                                                                          $460.6

Pro-Forma Illustrative Enterprise Value at Close                                                                                           Illustrative Post-Transaction Ownership Breakdown

                Pro-Forma Shares Outstanding                                                            52.8                                                        Pro Forma Ownership - Fully Diluted                                     %
                                                                                                                                                                                                                                   (5)
                LCA Illustrative Price per Share                                                     $10.00                                            LCA Shares                                                          23.3                 44%

                Equity Value                                                                         $528.2                                            Waitr Rollover Shares                                               22.5                 43%
                                                                                                                                                       LCA Founder Shares                                                    6.3                12%
                Less: Pro Forma Cash                                                                   140.6                                                                                                                       (4)
                                                                                                                                                       Waitr Unvested Options                                                0.8                 2%
                Pro-Forma Enterprise Value                                                          $387.6
                                                                                                                                                       Total Shares Outstanding                                            52.8
(1)   Assumes 2018E net revenue (excl. gratuity) of $62M - $67M.
(2)   Assumes 2019E net revenue (excl. gratuity) of $120M - $130M.
(3)   Assumes no redemptions in connection with the vote to approve the business combination. Includes gross cash in trust at 5/31/18, net of 1.7 mm shares redeemed in connection with the extension. Minimum cash consideration is $50.0M less the aggregate Waitr
      convertible note cash out amount, less the aggregate cash amount payable to the non-accredited Waitr stockholders. The total number of shares outstanding will increase as the cash to existing shareholders decreases.
(4)   Approximately 793,000 unvested options of Waitr will be rolled over into new options issued by Landcadia.
(5)   Includes 638,561 shares owned by Landcadia’s sponsors as of December 31, 2017 or 1.2% of the pro forma entity.

                                 / Landcadia                                                                                                                                                                                                                           5
Potential Business Combination between Landcadia Holdings, Inc. and Waitr Incorporated - August 2018
Comparable Company Benchmarking
 Operating and Trading Metrics

 2018E & 2019E Revenue Growth
                                                                                                      2018 Median: 40%
                                                                                                      2019 Median: 29%
           125%+

                           90%+

                                                                               44%            41%     40%          39%
                                                                                       28%                                 30%    33%
                                                                                                                                         21%

                                                                                                      2018 Median: 10.7x
 2018E & 2019E Revenue                                          Multiple(1)                            2019 Median: 7.9x
                                                                               11.4x          11.0x
                                                                                                                   10.3x
                                                                                       9.0x
                                                                                                      7.9x                 7.9x
                                                                                                                                  7.1x
          5.8x-6.3x                                                                                                                      5.9x

                           3.0x-3.2x

  2018E Implied Revenue: $62M - $67M(2)
  2019E Implied Revenue: $120M - $130M(2)

Source: Company filings and Capital IQ as of 7/31/18.
(1) Waitr multiples assume a pro forma enterprise value at close of $387.6M.
(2) Net revenue excludes gratuity.

                                / Landcadia                                                                                                     6
Potential Business Combination between Landcadia Holdings, Inc. and Waitr Incorporated - August 2018
Company Overview

/ Landcadia                      7
Potential Business Combination between Landcadia Holdings, Inc. and Waitr Incorporated - August 2018
Waitr Has Accomplished A Great Deal In A Short Period Of Time

                                                                                                                                                         Orders

                                                                       Launched 3rd                                            Begin
                                                                         Market in                                            Grocery
                                                                      Baton Rouge in                                          Delivery
                                                                       January 2016                                          March 2017

                                                                                                            January                                      25
                                                                                                                                                   Markets Profitable
                                                                                                             2017

                                                                                                              1M                                      7.7M
                                                                                                         Cumulative Orders                         Cumulative Orders

  Founded                Launched 1st     Launched 2nd
                                                          Orders Per Day(1)            1,000               5,000                  10,000            21,300
   2013                     Market in       Market in                                  March 2016          January 2017           September 2017       June 2018
                         Lake Charles      Lafayette in
                          in late 2014      April 2015

      2013                  2014             2015             3        2016                         11    2017                     24                 2018E             45+
                                                            markets                            markets                            markets                               markets

(1)   Monthly average.

                            / Landcadia                                                                                                                                       8
Potential Business Combination between Landcadia Holdings, Inc. and Waitr Incorporated - August 2018
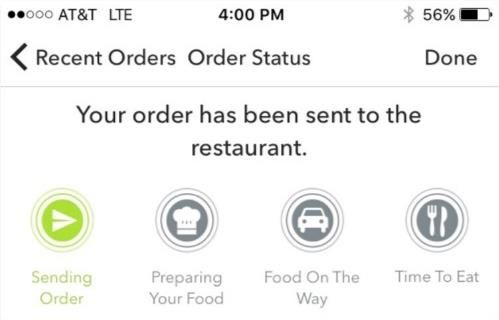
Waitr Investment Highlights

                                  Massive Restaurant Delivery Market Is Underpenetrated And
                              1   Moving Online

                                  Leading Position In Our Current Markets With A Marketplace
                              2   Model And Proven Expansion Strategy

                              3   Strong Value Proposition To Customers And Restaurants

                              4   Powered By A Differentiated Proprietary Technology Platform

                              5   High Growth Business Model Built In A Capital Efficient Manner

                                  Partnership With Landcadia Is Expected To Accelerate Growth
                              6   And Entrench Competitive Positioning

        / Landcadia                                                                             9
Potential Business Combination between Landcadia Holdings, Inc. and Waitr Incorporated - August 2018
Massive Restaurant Delivery Market Is Underpenetrated And Moving
Online
    Consumers Are Moving Online…                         …With Restaurants Following Suit…           …Creating A Massive
                                                                                                     Addressable Market
          Shopping                      Transportation
                                                             Online Restaurant Delivery Is
                                                                  Expected To Double

                                                                   U.S. Market Size

                                                               $13B              $32B

                                                                                 11%
         Hospitality                     Digital Media                                         $13B Current U.S. Online
                                                                6%                             Restaurant Delivery
                                              /
                                 /
                                                                                               $220B Total U.S. Restaurant Industry
                                                                                               Off-Premise(1)
                                                               2016             2022E

                                                          Online Restaurant Delivery Revenue   $520B Total U.S. Restaurant Industry
                                                               As A % Of Total Restaurant
                                                                 Industry Off-Premise(1)
Source: Wall Street Research.
(1) Includes drive-thru.

                                / Landcadia                                                                                     10
Waitr Focuses On A Massive Underserved Market

               Waitr Targets Underserved Tier Two and Three                          Restaurants On Waitr’s Platform By Market
                                 Markets                                                         Population Rank
         Number of U.S. Restaurants By Market Population(1)

                                                                  205K

                    179K                      177K
                                                                                                                   15%

                                                                                                         85%
                                                                              28K

                  Top 10                     11-50                51-500      500+      Market Ranking
                                                                Core market             by Population     11-50   51-500
                                                                 represents
                                                                35% of U.S.
                                                                restaurants

(1)   Source: U.S. Census Bureau, Bureau of Labor Statistics.

                                 / Landcadia                                                                                     11
Waitr’s Marketplace Platform Connects Consumers And Restaurants

                        Restaurants                                                                                   Consumers

                    Higher Average Order
                                                                                                                Discovery
                     Value And Incremental
                     Orders

                    Deep Restaurant
                                                                                                                Convenience
                     Integration
                                                                                                                Personalization
                    Rich Customer Data

                               5,900+                                                                                      678K+
                    Restaurants Under           Contract(2)                                                               Active Diners(1)

                                              Drivers                             Primarily W-2 Employees   7,500+
                                                                                                             Active Drivers(3)
                                                                                   With Scheduled Hours
(1)   Diners who have placed an order over the past 12 months as of Q2 2018.
(2)   As of 6/30/18.
(3)   Number of drivers who were active in Q2 2018.

                                 / Landcadia                                                                                                 12
Supporting Waitr’s Restaurant Customers: Its Drivers

                             Every driver interviewed in-person with city team

                             Background-checked, trusted partners

                             Ability to schedule and optimize performance

                             Quality control for demeanor, appearance, safety

                             Readily identifiable and uniformed

                             Stable jobs enhance reputation in community

        / Landcadia                                                              13
Waitr Has Created A Great Consumer Experience For Online Discovery
And Ordering

 1                                        2                                 3
         Pick your location                   Personalize your experience       Discover New Restaurants

     4    Choose Your Order & Customize       5                                   6
                                                     Track Your Order                         Enjoy
                  With Add-Ins

              / Landcadia                                                                                  14
A Better Business Model

                          Our Focus Is On Full Service Restaurants                                                                                              Leading To Higher Net Revenue Per Order

                                                   Average Order Value                                                                                                            Net Revenue Per Order

                        ~ $35

                                                                                                                                                                           ~$10

                                                                                                                                                                                                          ~$8
                                                               $16-20

                                                                                                          ~ $6

                                                                                  (1)                                                                                                                           (2)
                                         (1)
                                                         QSR Delivery                             QSR Dine-In                                                                                        QSR Delivery

            Our business model encourages restaurant buy-in and generates more net revenue per order
Source: Wall Street Research.
(1) Includes Gratuity and delivery fees. QSR Delivery calculated as average meal delivery value of $9-12, plus $5 delivery fee and $2-3 average tip per equity research.
(2) Based on delivery economics of one of Waitr’s major competitors.

                                 / Landcadia                                                                                                                                                                          15
Delivering A Differentiated Experience For Restaurants

                                           Upfront restaurant investment
Partnership Focused                        Menu onboarding & photography
        Restaurant Experience              In-market local team support

                                           Most attractive transaction pricing             Substantial Uplift For Waitr’s
       Attractive Pricing                     – 15% commission versus ~30% at competitors      Restaurant Partners
              For Restaurants              ~2 – 4 week restaurant payback on upfront
                                            investment

                                                                                              1.95x more sales
                                           Access to our marketing resources
      Partner Marketing                    In-store marketing collateral                     per restaurant(1)
               To Restaurants              Actionable data insights & analytics
                                                                                                Market Cohorts Three Years on
                                                                                               Platform vs One Year on Platform

                                           Dedicated restaurant support
      Customer Service                     Live consumer support
      And Driver Relationships             Professionally branded drivers

(1)   For period Q2 2018.

                            / Landcadia                                                                                           16
A Growing List Of Leading Restaurant Partners
                        Waitr is Focused on Serving                                   And Supports Regional and
                       Local Independent Restaurants                                National Chains and Franchises

                                                        5,900+
                                                       Restaurants Under Contract

Note: As of 6/30/18.

                       / Landcadia                                                                                   17
How Waitr Launches And Grows New Markets

               Phase 0                              Phase 1                             Phase 2                            Phase 3

        Pre-launch markets                    0-100 Orders per day             100-1,000 Orders per day            1,000+ Orders per day

 • ~$200K average cost                  • Rapid growth in restaurants and   • Market breakeven ~350 orders    • Sustainable profitability in
                                          users                               per day                           market
 • 1 new market launched every 2
   weeks                                • Optimizing orders per driver in   • Word of mouth increases         • Order per driver per hour,
                                          the field                           restaurant interest               driving margin into the system
 • Identification of markets and key
   restaurant partners                                                      • Managing orders per driver in
                                                                              the field
 • Building supply and stimulating
   early demand, awareness, app                                             • Hire more drivers to handle
   installs                                                                   increase in volume

 • Launch with 40+ restaurants

 • 1:1 driver to restaurant initially

 • City Manager for driver
   operations

Average
number of
days for new     60                                     6                                 30-90
markets:

                    / Landcadia                                                                                                                  18
New Market Opportunities
                                                                                                        Proximity: 11 states with major interstate
                                                                                                         connectivity, 105 million people, 32% of US
                  ~200 New Markets Identified within this Footprint                                      addressable population
                                                                                                        Population Size: 50,000 - 750,000
                                                                                           7
                                                                              3
                                                                  9                                     Tip Credit: many states count tips toward wages
                                  8
                                             8                                8        4
                                                                      5                                 Competitive Presence: focus on the underserved
                                                                                                         market in secondary and tertiary cities
                                                          1                       6
                       88
                                   30                                 4                                 Other Factors:
                                             4
                                                              2
                                                                                                         •   Leverage Waitr Restaurant Partner Network
                                                                          2
                                                 66
                                                                                                         •   Restaurant Spending per Capita
                                        20
                                                                                           31
                                                                                                       Total Number of Markets Served by Year:
                                                                                      16                       Current Business Plan                    70+

                                             Interstate
                                                                                                                                         45+

                                                                                                                                          34
                                                                                                                             24

                                                                                                                10
                                                                                                 3

Note: As of Q2 2018.                                                                            2015           2016        2017        2018E           2019E

                            / Landcadia                                                                                                                       19
Improving Launches In New Markets

                                                          Days to reach 1,000 Cumulative Orders
                                      76

                                                                    32

                                                                                          12
                                                                                                         6

                             Lake Charles                       Baton Rouge            Birmingham      Jackson

                              Late 2014                        January 2016            June 2017    November 2017

Note: Date shown below market represents date launched.

                               / Landcadia                                                                          20
Waitr Is Winning Versus The Competition
 Market Rank by Number of Restaurants on Platform in Each Market                                                                      Google Trends Web Search Interest

                                           #1        #2         #3         #4+                                         New Orleans, LA                                         Baton Rouge, LA

                                                                                                               6/16    12/16   6/17   12/17   6/18                 6/16      12/16       6/17       12/17      6/18

                                                                                                                      Launched July 2016                                  Launched January 2016

                                                                                                                                                                                 Columbus, GA
         #1                                                                                                      Mobile, AL / Pensacola, FL

                                                                                                               6/16    12/16   6/17   12/17   6/18                6/16       12/16       6/17      12/17       6/18

                                                                                                                      Launched June 2017                                  Launched February 2018

Note: Defined by the number of restaurants served by Company in market vs. Grubhub, UberEats and BeyondMenu.                                                                                                 Source: Google Trends.
Based on company websites.                                                                                                                      Note: Shown as 8-week moving average; information from 6/30/2016 through 6/30/2018.

                                / Landcadia                                                                                                                                                                                21
Waitr Outperforms The Competition

                                                                                                                                                                Average Monthly Customer
                                                                    Market Share
                                                                                                                                                                       Retention(1)
                                               Share of June 2018 sales in cities where Waitr operates

                                                                                                                                                                   40%+ outperformance
                                                                                                                                                                    versus competition

            Competitor 1

            Competitor 2                                                                                                                                                         : 30%
            Competitor 3
                                                                                                                                                                                (2)
                                                                                                                                                                    Industry
                                                                                                                                                                             : 21%
            Competitor 4                                                                                                                                            Average

                                             0%                  10%                  20%                   30%                  40%                      50%
Source: Second Measure.
(1) Weighted average one year monthly customer retention for customers who made their first purchase with each company between July 2016 and June 2018.
(2) Industry includes top five competitors that overlap with Waitr’s markets.

                               / Landcadia                                                                                                                                                 22
Experienced Founder-Led Management Team

        Chris Meaux                                                                               Dave Pringle
        Co-Founder & Chief Executive Officer                                                      Chief Financial Officer

                                                      Meaux’s 2 Geaux

             Joe Stough
             Chief Strategy Officer                                     Sonny Mayugba                                           Travis Boudreaux
                                                                        Chief Marketing Officer                                 Director of Software Engineering

     Manuel                                                                                                                                   Addison
                                       Evan Diaz                         Tyson Queen                                                          Killebrew
     Ramirez                                                                                                  Coco Pahl
     Co-Founder, Chief                 de Arce                           Director of
                                                                                                              Head of Product                 Co-founder,
                                       Co-founder, Finance               Sales & Marketing                                                    Chief Innovation
     Architect
                                                                                                                                              Officer

          / Landcadia                                                                                                                                              23
Financial Highlights

/ Landcadia                          24
Waitr Financial Highlights

                            Massive Growth Continues 130%+ Q2 2018 Year-Over-Year
         1                  Gross Food Sales(1) Growth

                            Proven Market Economics and Marketplace Model With
         2                  Positive Contributions in 25 of 34 Markets

         3                  Strong Gross Profit with ~30% Gross Margin to Net Revenue(2)

                            Proven Customer Return On Investment With Over 10x
         4                  Lifetime Value(3) / Customer Acquisition Cost

                            Capital Efficient Business Model With Only ~$26M In Capital
         5                  Raised To Date
Note: As of Q2 2018.
(1) Gross food sales represents food and beverage receipts, plus taxes, prepaid gratuities and delivery fees.
(2) Net revenue excludes gratuity payments.
(3) On a net revenue basis

                                   / Landcadia                                                                  25
Rapid Growth And Scale

               Contracted Restaurants                                                                  (in thousands)
                                                                                                                         Active Diners(2)            (in thousands)
                                                                                                                                                                         Orders
          99%                                                                                           90%                                         139% Y-o-Y
       Retention(1)                                                                                  Retention(3)                                     Growth
                                                                                                                                            679                       3,400
                                                                     5,933

                             3,742                                                                                         419
                                                                                                                                                                                      1,865

                                                 2,129                                                                              243

                                                                                                                                                       874
                                                                                                                                                                              781
         1,099                                                                                                 118

          2016                2017               Q2'17               Q2'18                                    2016        2017     Q2'17    Q2'18     2016            2017    Q2'17   Q2'18
(1)   Restaurant retention calculated using historical restaurant churn since inception. Excludes restaurant closures.
(2)   Diners who have placed an order over the past 12 months.
(3)   Diner retention is quarterly as of Q1 2018.

                                   / Landcadia                                                                                                                                                26
Continued Improvements In Market Cohorts

                                                                                        Number of Orders per Quarter by Annual Market Cohort(1)
       (in thousands)
                              900                                                                                                           2016

                              800

                              700

                              600
         Orders per Quarter

                              500                                                                     2017
                                                                                                                                                                       2015
                              400

                              300

                              200
                                                         2018
                              100

                               0
                                    1         2              3             4              5     6       7        8       9      10     11    12    13   14   15   16    17
                                                                                                            Quarters Since Market Launch

(1)   Annual market cohort refers to all markets established by Waitr in a respective year.

                                        / Landcadia                                                                                                                           27
Proven Market Contribution – Gross Margin

               80%                                                                                                                                                                                                             Market               Profitable
                                                                                                                                                                                                                               Cohort              Gross Margin

                                                                                                                                                                                                                                2015                     2
               60%
                                                                                                                                                                                                                                2016                     7
                                                                                                                                                                                                                                2017                     12
               40%                                                                                                                                                                                                              2018                     4
Gross Margin

               20%

                0%
                                                 500+

               (20%)

               (40%)
                                                                                          Average Orders per Day

  Note: YTD as of Q2 2018; Gross Margin defined as gross profit / adjusted net revenue (excluding pass through gratuity). Cost of sales primarily consists of driver costs, payroll and expenses for city-level teams and credit card processing fees.

                                   / Landcadia                                                                                                                                                                                                                    28
High Growth Profile
 ($ Millions)

Gross Food Sales(1)                                                                                                                          $850+

                                                                                                                                $500+

                                                                                                                  $260-$280
                                                                                   ~$120
                                ~$30

                                2016                                                2017                           2018E        2019E        2020E

         Gross Food Sales Growth:                                                  275%+                            115%+       90%+         70%+

Net Revenue(2)
                                                                                                                                           $200-$220+

                                                                                                                              $120-$130+

                                                                                                                   $62-$67
                                                                                     ~$27
Q2 Update
 ($ Millions)

Gross Food Sales(1)                                                                                                                             $263                 $260-280

                                                                                                                          $216

                                                                                                         ~$120

                                                            ~$30

                                                                                                                                     (2)                      (3)
                                                             2016                                         2017    Q1 2018 Run Rate         Q2 2018 Run Rate            2018E

      Number of
                                                         1,099                                          3,742             4,670                  5,933                  ~7,000
      Restaurants

      Number of
                                                 874 thousand                                      3.4 million       6.1 million               7.5 million          7.5 - 8.0 million
      Orders

      Number of
                                                            10                                             24              29                        34                   45+
      Markets
        Net Revenue Growth:                                                        170%+                          125%+                      100%+                    ~70%+
(1)   Gross food sales represents food and beverage receipts, plus taxes, prepaid gratuities and delivery fees.
(2)   Run rate gross food sales and orders calculated as Q1 2018 actual numbers multiplied by four.
(3)   Run rate gross food sales and orders calculated as Q2 2018 actual numbers multiplied by four.

                                  / Landcadia                                                                                                                                           30
You can also read