Second Quarter 2021 Presentation Title in
←
→
Page content transcription
If your browser does not render page correctly, please read the page content below

Presentation Title in
Second
Title Case Quarter 2021
Earnings      Presentation
Presentation subtitle in
sentence case
Presenter Name

Event name
xx Month 201x

                             © 201X Virtu Financial. All rights reserved. Not to be reproduced
                             or retransmitted without permission. Compliance #XXXX-XXXX
                                                         © 2021 Virtu Financial. All rights reserved.
Second Quarter Highlights

Adj. NTI1                                Normalized Adj. EPS1       2Q 2021 Highlights
$342M                                    $0.63
                                                                    • Quarterly results reflective of market conditions
                                                                        o   Realized volatility 9% below 2019 average
                                                                        o   US equity share TCV 3% below 2020 average
Adj. NTI/day1,2                          Adj. EBITDA1
                                                                    • Generated $32M of Adj. NTI1 from organic growth
$5.4M                                    $197M                        initiatives – 9% of total firm Adj. NTI1
                                                                        o   Options market making +22% QoQ

                                                                    • 8.2M shares repurchased as of 7/30/21 – 4% of
Debt to LTM Adj.        EBITDA1          Adj. EBITDA    Margin1,3
                                                                      shares outstanding as of 9/30/20 – at an average cost
1.2x                                     57.7%                        of $27.87 for total of $229M repurchased4
                                                                        o   3.4M shares repurchased in 2Q 2021 for a total
                                                                            of $101M4

See endnotes at end of this supplement                                                                                    2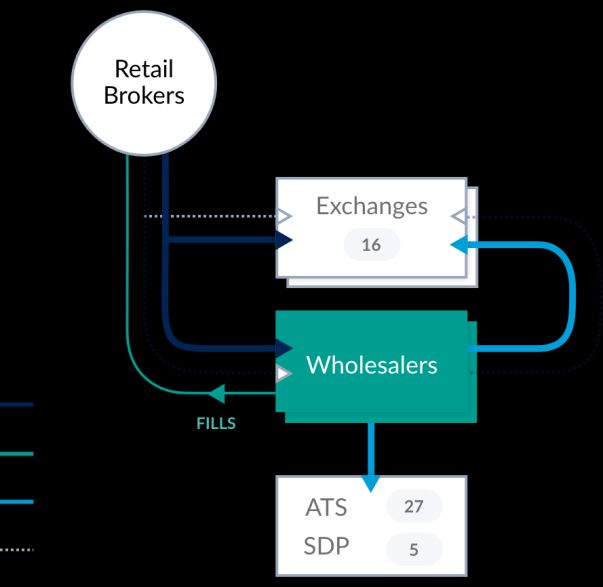
Key Financial Metrics
                                                                                                                                Full Year                                      2Q 2021 v
                                                                    1Q 2020       2Q 2020          3Q 2020        4Q 2020                         1Q 2021       2Q 2021
  ($M)                                                                                                                            2020                                             1Q 2021
                                             1
  Total Adjusted Net Trading Income                                   $784           $669           $362            $456             $2,271            $728      $342
                                                                                                                                                                                     - 55%
                             1
    Daily Average Adj. NTI                                            $12.7         $10.6           $5.7            $7.1             $9.0              $11.9     $5.4
     Market Making Adj. NTI                                           $652           $552           $257            $321             $1,782            $575      $232
                                                                                                                                                                                     - 61%
       Mark et Mak ing Daily Average Adj. NTI                         $10.5          $8.8           $4.0            $5.0             $7.0              $9.4      $3.7

     Execution Services Adj. NTI2                                     $132           $117           $105            $135             $489              $153      $110
                                                                                                                                                                                     - 30%
       Execution Services Daily Average Adj. NTI                      $2.1           $1.9           $1.6            $2.1             $1.9              $2.5      $1.7
  Adjusted Cash Operating Expenses 1                                  $215           $183           $114            $112             $623              $163      $145                - 11%
                                         1
  Total Adjusted Operating Expenses                                   $232           $200           $130            $128             $690              $180      $161                - 11%
                     1
  Adjusted EBITDA                                                     $570           $486           $249            $344             $1,648            $565      $197                - 65%
                                 3
    Adjusted EBITDA Margin                                           72.6%         72.6%            68.7%          75.4%             72.6%             77.6%     57.7%             - 19.8 pts
  Long Term Debt (at end of period)                                  $1,957        $1,769           $1,669         $1,670            $1,670            $1,667    $1,631             - 2.1%
    Debt / LTM Adjusted EBITDA                                        2.2x           1.4x            1.2x            1.0x             1.0x              1.0x      1.2x              + 19%
                                     1
  Normalized Adjusted EPS                                             $2.05         $1.73           $0.81           $1.18            $5.76             $2.04     $0.63               - 69%

Execution Services business has grown steadily, through acquisition and organic growth                                                                          CAGR4          CAGR4
Average Daily Adjusted NTI in $ million (excluding ANTI from KCG and ITG pre-acquisition)                                                                       +13%               +22%

                                                                                                                                               $7.05
                                                                                                                                                                                   $6.51

                                                                   $3.68
                                                                                                        $2.40                                                   $2.12
                         $1.96                                                                                               $1.93
                                                                                      $1.47
       $0.28                                     $0.38

               FY 2017                                   FY 2018                              FY 2019                                FY 2020                            YTD 2021

                                                                              Execution Services             Market Making

See endnotes at end of this supplement                                                                                                                                                          3
Major Market Metrics
Full Year 2Q 2021 v
1Q 2020 2Q 2020 3Q 2020 4Q 2020 1Q 2021 2Q 2021
2020 1Q 2021
Market Metrics (Average Daily)
Volume Metrics
US Equity Consolidated Volume (mm shares) 10,972 12,352 9,942 10,454 10,924 14,650 10,559 - 28%
U.S. OTC Equity Volume (mm $ notional) 1,939 1,729 1,498 2,043 1,800 3,809 2,736 - 28%
IBKR Retail Equity Volume (mm shares) 966 1,045 1,378 1,899 1,216 5,019 2,721 - 46%
OCC ADV (mm contracts) 28.0 28.2 29.5 32.2 29.5 42.0 36.4 - 13%
CME FX ADV (k contracts) 1,078 725 829 818 861 850 770 - 9%
Hotspot ADV FX (mm $ notional) 43,530 31,753 30,208 33,635 34,724 36,889 32,598 - 12%
Volatility Metrics
S&P 500 Index Realized Volatility 57.3 31.9 17.0 16.4 30.4 15.8 11.2 - 29%
SX5E Realized Volatility 47.3 33.0 19.5 21.3 30.1 13.6 12.9 - 5%
NKY Realized Volatility 38.1 28.5 15.7 14.5 24.1 20.1 19.1 - 5%
CVIX Realized Volatility 146.4 46.7 74.1 36.8 75.6 32.1 25.0 - 22%
GS Comm Realized Volatility 16.3 36.1 13.1 10.8 19.0 8.4 5.4 - 35%
See endnotes at end of this supplement 4Virtu Has Multiple Levers to Drive Growth
Normalized Historical Results
Virtu Pro Forma
Pro forma results for Virtu +
KCG + ITG result in through-
Through- ANTI
per Day1
Adj.
EPS1
Adj.
EBITDA1
the-cycle Adj. NTI per day of
~$5.5M annually -- before the
the-Cycle benefits of growth initiatives and
Median2 integration
Earnings $5.5 $2.69 $831
Impact of Growth Initiatives Combined Earnings Power Organic growth initiatives,
Incremental: Pro Forma Median
together with our stable cost
Organic ANTI Adj. ANTI Adj. Implied structure, result in an estimated
per Day3 EPS4 per Day5 EPS5 Growth5 $0.34 to $1.03 of incremental
Business Adj. EPS annually, or ~26%
growth from median EPS
Growth High
Low
$1,500k
$500k
$1.03
$0.34
Median $6.5 $3.37 ANTI: 18%
EPS: 26%
(based on midpoint of ranges)
Illustrative Range of Outcomes based on 2021 Expense Guidance
Target Range Shares (mm) % Reduction in
ANTI Full-Year Available for Share Repurchased at Current Share Incremental EPS growth from
Capital per Day6
$6.00
Adj. NTI 6
$1,512
Repurchases
$120 - $140
Current Share Price 7
5.1
Count8
2.6%
annual reduction in share
count
Management $7.00
$8.00
$1,764
$2,016
$200 - $250
$300 - $400
8.7
13.6
4.5%
7.0%
$9.00 $2,268 $400 - $500 17.5 9.0%
$10.00 $2,520 $500 - $600 21.4 11.0%
$11.00 $2,772 $600 - $700 25.3 13.0%
See endnotes at end of this supplement 5Organic Business Growth
CAGR2
+ 82% $942k/day
$656k/day
$503k/day
1 $296k/day
Daily Average Adj. NTI from
$160k/day
Organic Growth Initiatives
FY 2018 FY 2019 FY 2020 1Q 2021 2Q 2021
Total Adj. NTI 1 $40M $75M $166M $57M $32M
% of Firmwide Adj. NTI 1 3% 7% 7% 8% 9%
Expansion into New Markets Growth in Existing Markets
• Options market making improved average daily ANTI by • Quant-style KCG strategies that have been adapted and
22% from 1Q 2021 to 2Q 2021 deployed into new markets and asset classes continue to
improve and remain above prior year ANTI averages
• Virtu Capital Markets continues to utilize execution and
distribution expertise to deliver liquidity to corporate • Customer-facing ETF block franchise desk maintains
issues and create a strong pipeline of relationships that steady performance
are leveraged across the firm
• Designated Broker / Lead Market Maker in Bitcoin and
Ether ETFs in Canada
See endnotes at end of this supplement 6Capital Management
Scaled business model delivers superior return on capital
Steady Payout in All Environments Share Buybacks2,3
Dividends declared per share and adjusted earnings per share1 per quarter Shares outstanding (million shares) and share repurchases ($ million) per quarter
$2.05 $2.04 $140Weighted
Avg. 198.1 199.0
Shares 197.5
$1.73 $120 197.0
Period- $101
$100 End 197.1 196.0
Share 194.8
Count 195.6
$1.18 195.0
$80
$63 193.0
$0.81 $60
EPS $0.76
$0.67 $0.63 191.9
$40 $34
190.0
$0.31 $0.34
Quarterly $0.22 $0.27 $20
$0.21 Shares
Dividend $0.16
of $0.24 Repurchased
$- 187.0
1Q18 2Q18 3Q18 4Q18 1Q19 2Q19 3Q19 4Q19 1Q20 2Q20 3Q20 4Q20 1Q21 2Q21 3Q 2020 4Q 2020 1Q 2021 2Q 2021
Superior Return on Invested Capital4
2,000 120%
1,800 101% 98%
Period Average Invested Capital ($M)
100%
Return on Invested Capital (%)
1,600 87%
1,400 78% 77%
80%
1,200
55%
1,000 60%
800
36% 35% 35% 40%
600 29%
400
20%
200
0 0%
1Q 2019 2Q 2019 3Q 2019 4Q 2019 1Q 2020 2Q 2020 3Q 2020 4Q 2020 1Q 2021 2Q 2021
Average of LTM Invested Capital LTM Pro Forma Adjusted EBITDA Return on Invested Capital
See endnotes at end of this supplement 7Update on Share Buybacks
Currently on pace for target repurchase range
3Q 2020 Authorization $100M Illustrative Range of Outcomes Based on
4Q 2020 Authorization $70M 2021 Expense Guidance
1Q 2021 Authorization $300M Target Range
Adj. NTI Full-Year Adj.
Available for Share
Buyback Authorization to Date $470M per Day1 NTI1
Repurchases
Shares Repurchased to Date 8.2M $6.00 $1,512 $120 - $140
Average Price of Shares Repurchased $27.87 $7.00 $1,764 $200 - $250
Total Executed to Date $229M $8.00 $2,016 $300 - $400
$9.00 $2,268 $400 - $500
Authorization Remaining $241M
$10.00 $2,520 $500 - $600
$11.00 $2,772 $600 - $700
1H21 Adj. NTI = $8.6M/day
Shares Average Total $195M of repurchases YTD in calendar
year 2021
Repurchased Price Notional
4Q 2020 1.4M $23.61 $34M
1Q 2021 2.3M $27.82 $63M
2Q 2021 3.4M $30.17 $101M
QTD 7/30/21 1.1M $26.54 $30M
Grand Total 8.2M $27.87 $229M
See endnotes at end of this supplement 8The current US equities market structure provides
meaningful and measurable benefits to retail investors
Significant Price and Size Improvement
• Wholesalers provided over $3.6B in price improvement to retail investors in 2020, based on Rule 605’s
calculation method; however, this method greatly understates the value provided to retail investors
• Wholesalers fill marketable orders at prices typically better than the NBBO, regardless of the quantity of shares
displayed at the NBBO. This improvement to both displayed price and size - or “Real Price Improvement” - is
not captured by Rule 605 figures1
• Virtu alone provided over $3B in Real Price Improvement to retail investors in 20201
Order Handling and Execution
• Wholesalers commit capital to execute marketable retail orders
• The price and size of non-marketable limit orders are reflected on exchanges2
• In total, approximately 40% of retail flow handled by Virtu interacts with public and / or lit markets
Robust Broker Competition
• The wholesale service model lowers entry barriers for new retail brokers and therefore bolsters competition
• Leveraging wholesaler partnerships allows retail brokers to offer more services at lower costs
Competitive and Resilient Execution Ecosystem
• Wholesalers compete against other liquidity sources, including over 40 exchanges and ATSs
• Brokers concurrently route to many execution partners and exchanges, mitigating single-point-of-failure risk
See endnotes at end of this supplement 9Separating Fact From Fiction
Myth Reality
Retail flow is not • Approximately 40% of total retail flow handled by Virtu interacts with displayed, hidden and
accessible midpoint liquidity on public exchanges and ATSs or are displayed on lit exchanges
• Most retail brokers are capable of routing directly to exchanges and many do – but retail brokers also
route to wholesalers to obtain price and size improvement over what’s available elsewhere1
Wholesalers • Marketable orders are promptly executed and printed to the tape with full transparency to the
have information marketplace, while non-marketable limit orders are reflected on lit exchanges where they are visible
advantage publicly2
• Wholesalers receive retail orders without any advanced notice or information about the retail investor that
placed the order
Price • Wholesalers effectively narrow the NBBO for retail investors – taken as a whole, all wholesalers provided
improvement is over $3.6B in price improvement in 2020, as measured by current Rule 605
not real • NBBO is only the ‘top of the book’ price and size – when Virtu’s performance is compared to all displayed
quotes for the quantity of shares to fill the order, Virtu alone provided over $3B in price improvement3
Wholesaling is • Competition among wholesalers drove a 750% increase in net PI per share since 20134
not competitive • Virtu competes with at least 7 other wholesaler firms5 as well as the entire ecosystem of over 40
exchanges and ATSs to provide the best price improvement to retail investors; barriers to entry are
minimal and there are new entrants on a regular basis
Exchanges & • Wholesalers provide execution in all market conditions; exchanges do not have best execution
ATSs would obligations
provide better • When Virtu seeks liquidity on exchanges and ATSs it achieves price improving fills on only ~18% of
executions routed shares. To remain competitive, Virtu provides Supplemental Price Improvement6 at significant
expense to itself by improving the execution prices for shares filled on exchanges and ATSs. This
Supplemental PI is paid out of Virtu’s own pocket. Virtu also incurs meaningful trading fees to execute
orders at exchanges and ATS, an expense we expect would fall to retail brokers if they routed orders
directly to these market centers
See endnotes at end of this supplement 10Operating Expenses and Long Term Debt
Disciplined focus on expense management
Operating Expense Results & Guidance
Adj. Operating Expense Forecast 1Q 2Q YTD FY 2021
FY 2019 FY 2020
($M) 2021 2021 2021 Guidance
Cash Compensation 230 321 90 70 160 270 - 280
Comms & Data Processing, Ops & Admin 313 302 73 74 148 273 - 298
1
Adjusted Cash Operating Expenses $543 $623 $163 $145 $308 $545 - 575
Depreciation & Amortization 66 67 17 16 33 60 - 70
1
Total Adjusted Operating Expenses $608 $690 $180 $161 $341 $605 - $645
Debt Structure at June 30, 2021
Debt Description Annual
Maturity Rate Balance
($M) Interest
First Lien Debt - Floating Mar 2026 L + 3.00% $75 $2.3
2
First Lien Debt - Fixed with 4.565% swap Mar 2026 4.565% $1,000 $45.7
First Lien Debt - Fixed with 4.465% swap3 Mar 2026 4.465% $525 $23.4
4
Japannext Jan 2023 5.00% $32 $1.6
Total 5 4.47% $1,631 $73.0
LTM Adjusted EBITDA1 $1,355
Debt / LTM Adjusted EBITDA1 1.2x
See endnotes at end of this supplement 11GAAP Reconciliations and Other Information
GAAP Income Statement

  Income Statement
                                                                            FY 2018   FY 20191   1Q 2020   2Q 2020   3Q 2020   4Q 2020   FY 2020   1Q 2021   2Q 2021
  ($mm)
  Trading income, net                                                       $1,267     $912       $802      $744      $441      $505     $2,493     $813      $385
  Commissions, net and technology services                                   184        499       171       148       134       148       601       192       143
  Interest and dividends income                                               88        109        27        9         11        15        62        7         10
  Other, net                                                                 340        (2)        1         5         70        8         83        1         11
  Total Revenues                                                            $1,879     $1,517    $1,001     $906      $656      $677     $3,239    $1,013     $549
  Brokerage, exchange, clearance fees and payments for order flow, net       376        387       174       204       196       185       759       259       171
  Communications and data processing                                         176        209        55        56        52        51       214        52        53
  Employee compensation and payroll taxes                                    216        384       170       121        36        66       394       105        84
  Interest and dividends expense                                             142        158        41        29        27        28       126        24        25
  Operations and administrative                                               67        104        27        22        25        21        95        26        22
  Depreciation and amortization                                               61        66         17        17        17        16        67        17        16
  Amortization of purchased intangibles and acquired capitalized software     26        71         19        19        18        18        74        18        18
  Termination of office leases                                                23        66         0         0         0         9         10        1         4
  Debt issue cost related to debt refinancing and prepayment                  12        41         4         13        10        2         29        2         2
  Transaction fees and expenses                                               11        26         0         0         2         0         3         (0)       (0)
  Financing interest expense                                                  72        122        26        22        20        20        88        19        20
  Total Operating Expenses                                                  $1,182     $1,633     $534      $501      $404      $417     $1,856     $523      $414
  Income (Loss) Before income taxes                                          $696      ($116)     $466      $405      $253      $260     $1,383     $490      $135
  Provision for income taxes (benefit)                                        76        (12)       78        69        53        62       262        81        26
  Net Income (Loss)                                                          $620      ($104)     $388      $335      $200      $198     $1,121     $409      $109

See endnotes at end of this supplement                                                                                                                                 13
GAAP Balance Sheet
Assets Liabilities and Equity
6/30/2021 6/30/2021
($M) ($M)
Cash and cash equivalents 848 Short-term borrowings, net 214
Cash and securities segregated under regulations and other 67 Securities loaned 1,143
Securities borrowed 1,535 Securities sold under agreements to repurchase 491
Securities purchased under agreements to resell 55 Payables to broker-dealers and clearing organizations 777
Receivables from broker-dealers and clearing organizations 1,609 Payables to customers 128
Receivables from customers 208 Trading liabilities, at fair value 3,123
Trading assets, at fair value 3,642 Tax receivable agreement obligations 255
Property, equipment and capitalized software, net 108 Accounts payable and accrued expenses and other liabilities 399
Operating lease right-of-use assets 240 Operating lease liabilities 286
Goodwill 1,149 Long-term borrowings, net 1,603
Intangibles (net of accumulated amortization) 418 Total Liabilities $ 8,419
Deferred taxes 180
Other assets 281 Equity 1,923
Total Assets $ 10,341 Total Liabilities and Equity $ 10,341
Invested Capital
($M) As of: 3/31/191 6/30/19 9/30/19 12/31/19 3/31/20 6/30/20 9/30/20 12/31/20 3/31/21 6/30/21
2
Trading Capital 1,714 1,631 1,637 1,604 1,997 2,141 1,981 2,075 2,266 2,089
(-) Cash reserved for operations, taxes payable, and other accrued
(20) (35) (56) (77) (496) (463) (303) (338) (418) (246)
and unpaid liabilities 3
Invested Capital 1,694 1,596 1,581 1,527 1,501 1,678 1,678 1,737 1,848 1,843
See endnotes at end of this supplement 14Share Count Roll Forward
(M shares) 4Q 2020 1Q 2021 2Q 2021
Beginning of Period Shares 197.1 195.6 195.0
Class A Buybacks - 1.44 - 2.28 - 3.36
Net Shares Issued - 0.05 + 1.70 + 0.19
End of Period Shares 195.6 195.0 191.9
See endnotes at end of this supplement 15Adjusted EBITDA & Normalized Adjusted EPS
Adj. EBITDA / Adj. EPS
FY 2018 FY 20191 1Q 2020 2Q 2020 3Q 2020 4Q 2020 FY 2020 1Q 2021 2Q 2021
($M)
Income (Loss) Before income taxes $696 ($116) $466 $405 $253 $260 $1,383 $490 $135
(+) Financing interest expense 72 122 26 22 20 20 88 19 20
(+) Debt issue cost related to debt refinancing and prepayment 12 41 4 13 10 2 29 2 2
(+) Depreciation and amortization 61 66 17 17 17 16 67 17 16
(+) Amortization of purchased intangibles and acquired capitalized software 26 71 19 19 18 18 74 18 18
EBITDA $867 $183 $532 $475 $318 $315 $1,640 $546 $192
EBITDA Margin 85.0% 18.8% 67.9% 71.1% 87.7% 69.1% 72.2% 75.0% 56.0%
(+) Severance 11 103 4 (0) 3 3 10 2 1
(+) Transaction fees and expenses 11 26 0 0 2 0 3 (0) (0)
(+) Termination of office leases 23 66 0 0 0 9 10 1 4
(+) Share-based compensation 35 51 26 17 (5) 22 60 13 13
(+) Reserve for legal matters 2 1 4 (1) (0) 0 3 4 -
(+) Coronavirus one time costs & donations - - 3 0 0 1 5 0 -
(-) Other (340) 2 (1) (5) (70) (8) (83) (1) (11)
Adjusted EBITDA $620 $432 $570 $486 $249 $344 $1,648 $565 $197
Adjusted EBITDA Margin 60.8% 44.3% 72.6% 72.6% 68.7% 75.4% 72.6% 77.6% 57.7%
(-) Financing interest expense 72 122 26 22 20 20 88 19 20
(-) Depreciation and amortization 61 66 17 17 17 16 67 17 16
Normalized Adjusted Pre-Tax Income $487 $244 $527 $447 $212 $308 $1,494 $528 $161
(-) Normalized provision for income taxes 112 59 126 107 51 74 358 127 39
Normalized Adjusted Net Income $375 $186 $400 $340 $161 $234 $1,135 $402 $122
Weighted average fully diluted shares outstanding 191.3 192.6 195.0 197.1 198.1 197.5 196.9 197.0 194.8
Normalized Adjusted EPS $1.96 $0.96 $2.05 $1.73 $0.81 $1.18 $5.76 $2.04 $0.63
See endnotes at end of this supplement 16Adjusted Net Trading Income Reconciliation
Operating segments
Adjusted Net Trading Income Reconciliation Market Making
($M) 1Q 2020 2Q 2020 3Q 2020 4Q 2020 1Q 2021 2Q 2021
Trading income, net 803 745 442 466 801 381
Commissions, net and technology services 1 (1) 9 43 14 9
Brokerage, exchange, clearance fees and payment for order
(137) (173) (178) (176) (223) (145)
flow, net
Interest and dividends, net (15) (19) (16) (12) (17) (13)
Adjusted Net Trading Income 652 552 257 321 575 232
Adjusted Net Trading Income Reconciliation Execution Services
($M) 1Q 2020 2Q 2020 3Q 2020 4Q 2020 1Q 2021 2Q 2021
Trading income, net (0) (1) (1) 39 11 4
Commissions, net and technology services 170 148 124 105 178 134
Brokerage, exchange, clearance fees and payment for order
(37) (31) (19) (9) (36) (26)
flow, net
Interest and dividends, net (0) (0) (0) (0) 0 (3)
Adjusted Net Trading Income 132 117 105 135 153 110
Adjusted Net Trading Income Reconciliation Total
($M) 1Q 2020 2Q 2020 3Q 2020 4Q 2020 1Q 2021 2Q 2021
Trading income, net 802 744 441 505 813 385
Commissions, net and technology services 171 148 134 148 192 143
Brokerage, exchange, clearance fees and payment for order
(174) (204) (196) (185) (259) (171)
flow, net
Interest and dividends, net (15) (20) (16) (13) (17) (15)
Adjusted Net Trading Income 784 669 362 456 728 342
See endnotes at end of this supplement 17Adjusted Net Trading Income Reconciliation
Organic growth initiatives
Adjusted Net Trading Income Reconciliation Organic Growth Initiatives
($M) 2018 2019 2020 1Q 2021 2Q 2021
Trading income, net 36 77 246 62 35
Commissions, net and technology services 7 11 23 13 7
Brokerage, exchange, clearance fees and payment for order
(2) (9) (88) (12) (7)
flow, net
Interest and dividends, net (1) (4) (15) (6) (4)
Adjusted Net Trading Income 40 75 166 57 32
See endnotes at end of this supplement 18Adjusted Operating Expense Reconciliation
Adjusted Operating Expenses Reconciliation
1Q 2020 2Q 2020 3Q 2020 4Q 2020 1Q 2021 2Q 2021 FY 20191 FY 2020
($M)
Employee compensation and payroll taxes $170 $121 $36 $66 $105 $84 $384 $394
Operations and administrative $27 $22 $25 $21 $26 $22 $104 $95
Communications and data processing $55 $56 $52 $51 $52 $53 $209 $214
Depreciation and amortization $17 $17 $17 $16 $17 $16 $66 $67
Less:
Severance ($4) $0 ($3) ($3) ($2) ($1) ($103) ($10)
Share-based compensation ($26) ($17) $5 ($22) ($13) ($13) ($51) ($60)
Other ($8) $1 ($0) ($1) ($4) - ($1) ($8)
Adjusted Operating Expenses $232 $200 $130 $128 $180 $161 $608 $690
See endnotes at end of this supplement 19Disclaimer
Cautionary Statement Regarding Forward Looking Statements
This presentation may contain “forward-looking statements” made pursuant to the safe harbor provisions of the Private Securities Litigation Reform Act of 1995. Statements
regarding Virtu Financial, Inc.’s (“Virtu’s”, the “Company’s” or “our”) business that are not historical facts are forward-looking statements. Forward-looking statements should not
be read as a guarantee of future performance or results, and will not necessarily be accurate indications of the times at, or by which, such performance or results will be
achieved. The Company assumes no obligation to update forward-looking statements to reflect actual results, changes in assumptions or changes in other factors affecting
forward-looking information, and if the Company does update one or more forward-looking statements, no inference should be drawn that the Company will make additional
updates with respect thereto or with respect to other forward-looking statements. Forward-looking statements are based on information available at the time and/or
management’s good faith belief with respect to future events, and is subject to risks and uncertainties, some or all of which are not predictable or within Virtu’s control, that could
cause actual performance or results to differ materially from those expressed in the statements. Those risks and uncertainties include, without limitation: risks relating to the
COVID-19 pandemic, including the possible effects of the economic conditions worldwide resulting from the COVID-19 pandemic and governmental and other responses thereto;
fluctuations in trading volume and volatilities in the markets in which we operate; the ability of our trading counterparties and various clearing houses to perform their obligations
to us; the performance and reliability of our customized trading platform; the risk of material trading losses from our market making activities; swings in valuations in securities or
other instruments in which we hold positions; increasing competition and consolidation in our industry; the risk that cash flow from our operations and other available sources of
liquidity will not be sufficient to fund our various ongoing obligations, including operating expenses, short term funding requirements, margin requirements, capital expenditures,
debt service and dividend payments; regulatory and legal uncertainties and potential changes associated with our industry, particularly in light of increased attention from media,
regulators and lawmakers to market structure and related issues; potential adverse results from legal or regulatory proceedings; our ability to remain technologically competitive
and to ensure that the technology we utilize is not vulnerable to security risks, hacking and cyber-attacks; risks associated with third party software and technology infrastructure.
For a discussion of the risks and uncertainties which could cause actual results to differ from those contained in forward-looking statements, see Virtu’s Securities and Exchange
Commission filings, including but not limited to Virtu’s Annual Report on Form 10-K, Quarterly Reports on Form 10-Q and Current Reports on Form 8-K filed with the SEC.
GAAP and Non-GAAP Results
This presentation includes or may include certain non-GAAP financial measures, including Adjusted EPS, Normalized Adjusted EPS, Adjusted Net Trading Income, Normalized
Adjusted Net Income, Normalized Adjusted Pre-Tax Income, EBITDA, Adjusted EBITDA, EBITDA Margin, Adjusted EBITDA Margin, Trading Capital, Invested Capital, Adjusted
Operating Expense and Adjusted Compensation Expense. Non-GAAP financial measures should be considered only as supplemental to, and not as superior to, financial
measures prepared in accordance with GAAP. Other companies may use similarly titled non‐GAAP financial measures that are calculated differently from the way we calculate
such measures. Accordingly, our non‐GAAP financial measures may not be comparable to similar measures used by other companies. We caution investors not to place undue
reliance on such non‐GAAP measures, but instead to consider them with the most directly comparable GAAP measure. Non‐GAAP financial measures have limitations as
analytical tools, and should not be considered in isolation, or as a substitute for our results as reported under GAAP. A reconciliation of non‐GAAP measures to the most directly
comparable financial measure prepared in accordance with GAAP is included at the end of this presentation.
20End Notes
These notes refer to metrics and/or defined terms presented on:
Slide 2
1. This reflects a non-GAAP measure. Please refer to slides at the end of this presentation for reconciliation to the equivalent GAAP measure. Prior period reconciliations available
https://ir.virtu.com/financials-and-filings/quarterly-results/default.aspx.
2. 2Q 2021 Adj. Net Trading Income per day calculated using 63 trading days
3. Adj. EBITDA margin is calculated as Adjusted EBITDA / Adj. Net Trading Income
4. Shares repurchased calculated on a settlement date basis.
Slide 3
1. This reflects a non-GAAP measure. Please refer to slides at the end of this presentation for reconciliation to the equivalent GAAP measure. Prior period reconciliations available
https://ir.virtu.com/financials-and-filings/quarterly-results/default.aspx
2. Includes MatchNow revenues prior to sale in July 2020
3. Adj. EBITDA margin is calculated as Adjusted EBITDA / Adj. Net Trading Income
4. CAGR measures the annually-compounded rate of return of Daily Average ANTI. Execution Services CAGR measures the 2-year period from 2Q 2019 (the first full quarter after
the ITG acquisition) to 2Q 2021. Market Making CAGR measures the 3.5-year period from 4Q 2017 (the first full quarter after the KCG acquisition) to 2Q 2021.
Note: # of trading days used in Adj. Net Trading Income per day calculations: 62, 63, 64, 64, 61, 63, 251, 251, 252, 253, and 124 for 1Q20, 2Q20, 3Q20, 4Q20, 1Q21, 2Q21, FY
2017, FY 2018, FY 2019, FY 2020, and YTD 2021, respectively.
Slide 5
1. This reflects a non-GAAP measure. Please refer to slides at the end of this presentation for reconciliation to the equivalent GAAP measure. Prior period reconciliations available
https://ir.virtu.com/financials-and-filings/quarterly-results/default.aspx
2. Calculated as median of observed values from FY 2015 through FY 2020
3. The range of Incremental ANTI per day due to growth initiatives reflects a Virtu management estimate of long term steady state ANTI from growth initiatives
4. Incremental Adj. EPS uses a trading day count of 252 to calculate full-year Incremental ANTI, 70% pre-tax margin, 24% tax rate, and share count of 194.8 million shares
5. Combined Pro Forma ANTI / Adj. EPS calculated as the sum of median Normalized Historical Pro Forma ANTI / Adj. EPS and median Incremental ANTI / Adj. EPS. Implied
Growth compares the results from the median Incremental ANTI & Adj. EPS to the median Normalized Historical Pro Forma results.
6. Figures are shown for illustrative purposes only
7. Assumes midpoint of Target Range Available for Share Repurchases and share price of $25.74
8. Current share count uses 2Q 2021 weighted average share count of 194.8 million shares
Note: All numbers in millions, except per share numbers or unless otherwise stated
Slide 6
1. This reflects a non-GAAP measure. Please refer to slides at the end of this presentation for reconciliation to the equivalent GAAP measure. Prior period reconciliations available
https://ir.virtu.com/financials-and-filings/quarterly-results/default.aspx
2. Organic Growth Initiatives CAGR measures the annually-compounded rate of return of Organic Growth Initiatives Daily Average ANTI over the 2.5-year period from FY 2018 to
YTD June 30, 2021
Note: # of trading days used in Adj. Net Trading Income per day calculations: 251, 252, 253, 61, and 63 for FY 2018, FY 2019, FY 2020, 1Q 2021 and 2Q 2021, respectively.
21End Notes—continued
These notes refer to metrics and/or defined terms presented on:
Slide 7
1. This reflects a non-GAAP measure. Please refer to slides at the end of this presentation for reconciliation to the equivalent GAAP measure. Prior period reconciliations
available https://ir.virtu.com/financials-and-filings/quarterly-results/default.aspx
2. Weighted average fully diluted shares assumes that (1) holders of all vested and unvested non-voting common interest units in Virtu Financial (“Virtu Financial Units”)
(together with corresponding shares of the Company's Class C common stock, par value $0.00001 per share (the “Class C Common Stock”)) have exercised their right to
exchange such Virtu Financial Units for shares of Class A Common Stock on a one-for-one basis, (2) holders of all non-voting Virtu Financial Units (together with
corresponding shares of the Company's Class D common stock, par value $0.00001 per share (the “Class D Common Stock”)) have exercised their right to exchange such
Virtu Financial Units for shares of the Company's Class B common stock, par value $0.00001 per share (the “Class B Common Stock”) on a one-for-one basis, and
subsequently exercised their right to convert the shares of Class B Common Stock into shares of Class A Common Stock on a one-for-one basis. Includes additional shares
from dilutive impact of options, restricted stock units and restricted stock awards outstanding under the Amended and Restated 2015 Management Incentive Plan and the
Amended and Restated ITG 2007 Equity Plan during the first and second quarters of 2021 and the years ended December 31, 2020, 2019 and 2018 as well as warrants
issued in connection with the Founder Member Loan Facility (as defined in Virtu’s Annual Report on Form 10-K) during the year ended December 31, 2020.
3. Shares repurchased calculated on a settlement date basis.
4. “Return on Invested Capital” is calculated as LTM Pro Forma Adjusted EBITDA divided by LTM Invested Capital. For periods post-ITG acquisition, LTM Invested Capital is
calculated as the average of beginning-of-period and end-of-period Invested Capital. For periods pre-ITG acquisition, LTM Invested Capital is calculated as end-of-period
Invested Capital. Pro Forma Adjusted EBITDA and Invested Capital are non-GAAP measures. Please refer to slides at the end of this presentation for reconciliation to the
equivalent GAAP measures. Prior period reconciliations available https://ir.virtu.com/financials-and-filings/quarterly-results/default.aspx
Slide 8
1. Figures are shown for illustrative purposes only, assuming 252 trading days in a year.
Note: Shares repurchased calculated on a settlement date basis.
Slide 9
1. Virtu Americas 2020, see appendix for methodology and example
2. Beyond the requirements of the Limit Order Display Rule.
Slide 10
1. See brokers’ Rule 606 Reports
2. Beyond the requirements of the Limit Order Display Rule
3. See appendix for methodology and example
4. See slide 31
5. Citadel Securities, G1 Execution, Goldman Sachs, Jane Street, Two Sigma Securities, UBS Securities, Wolverine
6. Supplemental Price Improvement reflects enhancements
Slide 11
1. This reflects a non-GAAP measure. Please refer to slides at the end of this presentation for reconciliation to the equivalent GAAP measure. Prior period reconciliations
22
available https://ir.virtu.com/financials-and-filings/quarterly-results/default.aspxEnd Notes—continued
These notes refer to metrics and/or defined terms presented on:
Slide 11 (continued)
2. Virtu entered into a fixed-for-floating interest rate swap ending February 2025
3. Virtu entered into a fixed-for-floating interest rate swap ending October 2024
4. 3.5 billion JPY
5. Blended rate
Slide 13
1. ITG revenues and expenses included in financials beginning on March 1, 2019 close date
Slide 14
1. ITG revenues and expenses included in financials beginning on March 1, 2019 close date.
2. This reflects a non-GAAP measure. Please refer to slides at the end of this presentation for reconciliation to the equivalent GAAP measure. Prior period reconciliations
available https://ir.virtu.com/financials-and-filings/quarterly-results/default.aspx
3. Comprises cash anticipated to be used in the operations of the business, including cash anticipated to be paid to satisfy tax and compensation liabilities, payments of debt
pursuant to debt covenants, as well as dividends and other distributions to equity owners.
Slide 15
Note: Assumes that (1) holders of all vested and unvested non-voting Virtu Financial Units (together with corresponding shares of the Company's Class C common stock, par
value $0.00001 per share (the “Class C Common Stock”)) have exercised their right to exchange such Virtu Financial Units for shares of Class A Common Stock on a one-for-
one basis, (2) holders of all non-voting Virtu Financial Units (together with corresponding shares of the Company's Class D common stock, par value $0.00001 per share (the
“Class D Common Stock”)) have exercised their right to exchange such Virtu Financial Units for shares of the Company's Class B common stock, par value $0.00001 per share
(the “Class B Common Stock”) on a one-for-one basis, and subsequently exercised their right to convert the shares of Class B Common Stock into shares of Class A Common
Stock on a one-for-one basis.
Does not include diluted shares (e.g. options, warrants), which totaled 1.5M, 1.3M and 0.7M shares at June 30, 2021, March 31, 2021 and December 31, 2020, respectively, and
reflects shares outstanding at a prior point in time or projected to be outstanding as of a future point in time, as opposed to a weighted average over a period.
The Weighted Average Adjusted shares outstanding are 194.8M, 197.0M and 196.9M for the three months-ended June 30, 2021, three months-ended March 31, 2021 and
twelve months-ended December 31, 2020, respectively. The Weighted Average Basic shares outstanding are 119.7M, 122.1M and 121.7M for the three months-ended June 30,
2021, three months-ended March 31, 2021 and twelve months-ended December 31, 2020, respectively. The Weighted Average Diluted shares outstanding are 121.2M, 123.4M
and 122.3M for the three months-ended June 30, 2021, three months-ended March 31, 2021 and twelve months-ended December 31, 2020, respectively.
Slide 16
1. ITG revenues and expenses included in financials beginning on March 1, 2019 close date
Slide 19
23
1. ITG revenues and expenses included in financials beginning on March 1, 2019 close date.Appendix: Measuring Real Execution Quality
Measuring Real Execution Quality
Benefits to Retail Are Significantly Understated

Douglas Cifu
Chief Executive Officer
Virtu Financial

U.S. Securities and Exchange Commission
Investor Advisory Committee
June 10, 2021

                                                                  © 2021 Virtu Financial. All rights reserved.
                                                   Not to be reproduced or retransmitted without permission.
Benefits of Current Market Structure
The current US equities market structure provides meaningful and
measurable benefits to retail investors
Significant Price and Size Improvement
• Wholesalers provided over $3.6B in price improvement to retail investors in 2020, based on Rule 605’s
calculation method; however, this method greatly understates the value provided to retail investors
• Wholesalers fill marketable orders at prices typically better than the NBBO, regardless of the quantity of shares
displayed at the NBBO. This improvement to both displayed price and size - or “Real Price Improvement” - is
not captured by Rule 605 figures1
• Virtu alone provided over $3B in Real Price Improvement to retail investors in 20201
Order Handling and Execution
• Wholesalers commit capital to execute marketable retail orders
• The price and size of non-marketable limit orders are reflected on exchanges2
• In total, approximately 40% of total retail flow handled by Virtu interacts with public and / or lit markets
Robust Broker Competition
• The wholesale service model lowers entry barriers for new retail brokers and therefore bolsters competition
• Leveraging wholesaler partnerships allows retail brokers to offer more services at lower costs
Competitive and Resilient Execution Ecosystem
• Wholesalers compete against other liquidity sources, including over 40 exchanges and ATSs
• Brokers concurrently route to many execution partners and exchanges, mitigating single-point-of-failure risk
1 Virtu Americas 2020, see appendix for methodology and example; 2 Beyond the requirements of the Limit Order Display Rule;
26Benefits to Retail Are Significantly Understated
A more fulsome measure of execution quality is necessary to
accurately quantify the experience of retail investors
1
Real PI Provided by Virtu Is Over 3x Greater Than What Is Measured by Rule 605
+210% +221%
+11% +3%
-3%
Add Odd Lot Add Odd Lot Add Short Sell Add Size
Current Rule 605 Real PI
Quotes Orders Orders Improvement
NBBO NBBO NBBO All displayed All displayed
Benchmark NBBO
+ Odd Lot Quotes + Odd Lot Quotes + Odd Lot Quotes quotes2 quotes2
Covered 100-9999 Shares 100-9999 Shares 1-9999 Shares 1-9999 Shares 1-9999 Shares 1-9999 Shares
Orders Excl. Short Sell Excl. Short Sell Excl. Short Sell Incl. Short Sell3 Incl. Short Sell3 Incl. Short Sell3
Real PI improves on Rule 605 by including odd lot and short sell orders and updating the
benchmark price to be the average price available for the same quantity of shares
considering all displayed quotes – NBBO, depth of book and odd lots
1 Virtu Americas 2020 activity; see appendix for methodology and example
2 All displayed quotes includes odd lots, NBBO, and depth of book from all lit exchanges
3
27
Includes Short Sell marked orders when not 201-restrictedRule 605 Recommended Reforms
We advocate for changes that enhance execution quality metrics and
disclosures to retail investors and encourage vigorous competition
In an attempt to measure fill quality on marketable orders, Rule 605 reports compare the
execution price of those orders to the NBBO price, regardless of the order size relative to
the quantity of shares displayed at the NBBO
• This measurement dramatically understates actual net PI provided to retail investors when the marketable
order size is larger than the number the shares displayed at the NBBO
• The current benchmark (NBBO), by definition, does not include unprotected, displayed odd lot orders
We believe reform to Rule 605 could result in more accurate measurements that reflect the
price improvement and execution quality benefits received by retail investors
• Current Rule 605 price improvement reports have four major shortcomings:
1. Unprotected odd lot quotes are not included in the benchmark reference price
2. Marketable odd lot orders are omitted
3. Marketable short sell orders are omitted
4. Rule 605 assumes there is always sufficient quantity of shares to fill marketable
orders at the NBBO
Addressing these shortcomings in Rule 605 reports would help the market to better
understand the actual benefits received by retail investors
28Separating Fact From Fiction
Myth Reality
Retail flow is • Approximately 40% of total retail flow handled by Virtu interacts with displayed, hidden and
midpoint liquidity on public exchanges and ATSs or are displayed on lit exchanges
not accessible
• Most retail brokers are capable of routing directly to exchanges and many do – but retail brokers also
route to wholesalers to obtain price and size improvement over what’s available elsewhere1
Wholesalers • Marketable orders are promptly executed and printed to the tape with full transparency to the marketplace,
while non-marketable limit orders are reflected on lit exchanges where they are visible publicly2
have information
• Wholesalers receive retail orders without any advanced notice or information about the retail investor that
advantage placed the order
Price • Wholesalers effectively narrow the NBBO for retail investors – taken as a whole, all wholesalers provided
over $3.6B in price improvement in 2020, as measured by current Rule 605
improvement
• NBBO is only the ‘top of the book’ price and size – when Virtu’s performance is compared to all displayed
is not real quotes for the quantity of shares to fill the order, Virtu alone provided over $3B in price improvement3
Wholesaling • Competition among wholesalers drove a 750% increase in net PI per share since 20134
is not • Virtu competes with at least 7 other wholesaler firms5 as well as the entire ecosystem of over 40
exchanges and ATSs to provide the best price improvement to retail investors; barriers to entry are
competitive minimal and there are new entrants on a regular basis
Exchanges & • Wholesalers provide execution in all market conditions; exchanges do not have best execution
obligations
ATSs would
• When Virtu seeks liquidity on exchanges and ATSs it achieves price improving fills on only ~18% of routed
provide better shares. To remain competitive, Virtu provides Supplemental Price Improvement at significant expense to
executions itself by improving the execution prices for shares filled on exchanges and ATSs. This Supplemental PI is
paid out of Virtu’s own pocket. Virtu also incurs meaningful trading fees to execute orders at exchanges and
ATS, an expense we expect would fall to retail brokers if they routed orders directly to these market centers
1 See brokers’ Rule 606 Reports; 2 beyond the requirements of the Limit Order Display Rule; 3 See appendix for methodology and example; 4 See slide 7;
5
29
Citadel Securities, G1 Execution, Goldman Sachs, Jane Street, Two Sigma Securities, UBS Securities, Wolverine;
6 Supplemental Price Improvement reflects enhancementsWholesalers Are Part of a Broad Ecosystem
Brokers leverage wholesalers for execution and order handling
Brokers evaluate wholesalers based on overall execution quality obtained, which incentivizes
wholesalers to seek price improving liquidity for the broker, including accessing better prices
on exchanges and ATSs where available
• Wholesalers typically incur and absorb trading fees on this flow when seeking liquidity; absent wholesaling
arrangements, these substantial costs would ultimately be paid by retail investors
Retail is Accessible: About 40% of retail orders handled by Virtu interact with displayed, hidden
and midpoint liquidity on exchanges and ATSs or are displayed on lit exchanges
Retail Brokers Leverage Wholesalers for Total Retail Volume Represents About 21% of
Routing and Executing Orders Total Market Volume Traded in US Equities1
~40% of Total Retail
Volume handled by
Virtu interacts on
exchanges and ATSs
and/or is displayed
on lit exchanges2
1 Per Rule 605 Reports from wholesalers for 2020; 30
2 Extrapolating from Virtu’s activity, excludes marketable and non-marketable orders routed directly to exchanges by retail brokersStrong Competition Benefits Retail
• Wholesalers compete against each other and over 40 other liquidity sources (exchanges, ATSs) for
the opportunity to provide execution and routing of orders for retail brokers
• Retail brokers measure liquidity sources based on the amount of price improvement provided
• This structure puts wholesalers in competition to provide the best execution for the retail broker on all
orders handled, including incentivizing wholesalers to access better prices on exchanges and ATSs
(where available) at the wholesalers’ own expense to remain competitive
2
Though significant, these figures substantiality understate benefits to retail investors
1 Net price improvement based on Rule 605 reports; 2 See appendix for methodology and example 31Appendix
Benefits to Retail Are Significantly Understated (con’t)
Current Rule 605 method ignores odd lot quotes, odd lot orders, short sell orders and the size of
covered orders relative to the amount of shares available at the NBBO
#    Method                       Net Price           Covered          Benchmark                                                                       Limitations / Notes
                                    Imp.               Order
                                   (2020)1             Sizes

1    Current                        $953M               100 –          The price at the NBBO, assuming infinite size at the NBBO.                      •   Doesn’t consider unprotected odd
     Rule 605                                           9999                                                                                               lots in the market data
                                                                                                                                                       •   Omits marketable orders for
                                                     Excl. Short                                                                                           1-99 shares
                                                     Sell orders                                                                                       •   Doesn’t consider the size of the
                                                                                                                                                           incoming order
                                                                                                                                                       •   Omits marketable orders marked
                                                                                                                                                           as Short Sell

2    Add Odd Lot                    $926M               100 –          The volume weight average price (VWAP) for the number of shares                 •   Omits marketable orders for
     quotes to                                          9999           required to fill the marketable order based on all displayed odd lots in            1-99 shares
     benchmark                    -3% vs.                              the market data plus infinite size at the NBBO for the size not satisfied       •   Doesn’t consider the size of the
                                Current Rule         Excl. Short       by odd lots.                                                                        incoming order
                                    605              Sell orders                                                                                       •   Omits marketable orders marked
                                                                                                                                                           as Short Sell

3    Add Odd Lot                   $1,031M              1-9999         The volume weight average price (VWAP) for the number of shares                 •   Doesn’t consider the size of the
     orders to                                                         required to fill the marketable order based on:                                     incoming order
     universe of                  +8% vs.            Excl. Short       • all displayed odd lots in the market data, plus                               •   Omits marketable orders marked
     covered orders             Current Rule         Sell orders       • infinite size at the NBBO for the size not satisfied by odd lots.                 as Short Sell
                                    605

4    Add Short Sell                $1,055M             1-99993         The volume weight average price (VWAP) for the number of shares                 •   Doesn’t consider the size of the
     marked orders                                                     required to fill the marketable order based on:                                     incoming order
     to universe of              +11% vs.                              • all displayed odd lots in the market data, plus
     covered orders             Current Rule                           • infinite size at the NBBO for the size not satisfied by odd lots.
                                    605

5    “Real PI”                     $3,062M             1-99993         The volume weight average price (VWAP) for the size of the covered
                                                                       order based on all displayed quotes (NBBO, depth, and unprotected
     Considers the               +221% vs.                             odd lots in the market data).
     size of the                Current Rule
     covered order                  605                                Note: The VWAP price is capped at 5% from the inside price to limit for
     vs. all displayed                                                 instances where the incoming marketable order (a) would have exhausted all
     quotes2                                                           displayed liquidity in the market and/or (b) would have traded through enough
                                                                       price levels to trigger an Limit-Up/Limit-Down halt.

1 See slide 10 for example calculation
2 All displayed quotes includes odd lots, NBBO, and depth of book from all lit exchanges                                                                                                      33
3 Includes Short Sell marked orders when not 201-restricted
Example: Why PI Calculation Matters
Ignoring size of orders understates the benefits retail receives
Consider the following scenario
Wholesaler receives a market order to sell long 600 shares.
The aggregate size on the bid looks like the illustration below. Benchmark Calculation
Wholesaler fills the sell order for 600 shares at $99.9700. Shares at each price level, by method
Rule 605 605 + OL Quotes "Real PI"
Price ($) Aggregate Size of Quotes on the Bid (across all exchanges) #1 #2 #5
$99.99 6 6 6
$99.97 9 9 9
$99.95 125Size Improvement Frequency
A significant percentage of retail activity comes from orders that exceed the displayed quantity of
shares at the NBBO1
Shares traded and notional value traded by retail often outsizes the displayed quantity
of shares at the NBBO1
60%
54%
50%
45%
40%
30%
20%
10%
0%
% of Retail Share Volume Traded % of Retail Notional Value Traded
from Orders > NBBO Qty from Orders > NBBO Qty
1
35
Virtu Americas 2020 activity, includes orders for 1-9999 shares and orders marked as short sellRetail 605 Volume as a % of Total Market Volume
Retail activity has grown from under 12% in 2018 and 2019 to 18% in 2020 and 20.4% for 2021 YTD
Retail Marketable 605 Activity as % of Total Market Activity
(Shares and Value Traded)
25% 25%
20% 20%
15% 15%
10% 10%
5% 5%
0% 0%
Retail 605 Volume as % of Total Market Volume (Shares) Retail 605 Notional as % of Total Market Notional Turnover (Value)
36
Source: Retail activity from Wholesalers’ Rule 605 Reports; Total market share and notional volume from Cboe Global MarketsWholesalers access other liquidity sources, including
exchanges and ATS, to fill about 30% of the volume
Internalized Retail 605 Marketable Volume accounts for approximately 14% of TCV1
20.4%
30%
14.3%
-6.1%
1 Extrapolating from Virtu’s activity, excludes marketable and non-marketable orders routed directly to exchanges by retail brokers
Source: Retail activity from Wholesalers’ Rule 605 Reports; Total market share and notional volume from Cboe Global Markets 37You can also read