CTU Monthly Economic Bulletin - No. 224 (November 2020) - NZCTU

Page created by Roberta Lawrence
 
CONTINUE READING
CTU Monthly Economic Bulletin - No. 224 (November 2020) - NZCTU
CTU Monthly Economic Bulletin
No. 224 (November 2020)
Thanks to everyone for your support and feedback. My contract finishes soon and Craig Renney –
the ‘chipper Georgie’ and finder of $5 billion hole1 – takes up the Bulletin writing from next
January.

Labour, Houses, and the Reserve Bank

Summary

What a wild ride the last year has been.
I look back to my first Bulletin in January – I had NO IDEA – and that wasn’t just that I was coming
out of tax and in to labour market things. It is trite to say that Covid has changed everything but
in some ways, it hasn’t changed anything.
Unemployment and underemployment is still structurally female, Māori and Pasifika. House
prices are still rising; the cost of living for low income people is still higher than for high income
people and the labour share of GDP resumes its downward fall.
So with this in mind as a final (from me) bumper issue2 this month’s Bulletin is in three parts:
    •    Discussion of the Labour Market Statistics and GDP (Income) that came out this month;
    •    Discussion of interest rates, the Reserve Bank and house prices; and
    •    The usual indicators.

How much do employees keep from what they produce?
The GDP (Income) data came out last week. From that we get information on things like
household savings but also information on how much of the income, earned by the people and
capital in the country, went to those of us earning wages.
Short answer – not enough.

1 https://www.stuff.co.nz/national/politics/300139041/election-2020-labour-connect-the-data-analysis-tool-that-boosted-
jacinda-arderns-campaign
2 But lot’s of graphs and pictures – so, I hope, a reasonably easy read.

1                                                                     CTU Monthly Economic Bulletin –November 2020
CTU Monthly Economic Bulletin - No. 224 (November 2020) - NZCTU
Long answer – not as much as was previously the case and its proportion is falling again.
The measure used by the CTU compares the amount received by employees to the amount
received by businesses before they pay employees – ie the total return or value added. As the
calculation is only to March 2020 it has yet to substantively feature the effect of the wage
subsidy or any possible reduction in income from businesses from the lockdown period.
Also, any return to self-employed labour remains in the denominator.

                            Labour (compensation of employees) share of
                                      GDP (Income - Nominal)
                                         Annual to March
           50.5%                            50.3%
                    50.1%
           50.0%            49.8% 49.7%
                                                                    49.6%
                                                            49.4%
           49.5%                                                            49.1%
                                                                                            48.9%
           49.0%                                    48.7%
                                                                                    48.5%           48.5%
           48.5%

           48.0%
                     2010    2011   2012    2013    2014    2015    2016    2017    2018    2019    2020
                                               Source: Stats NZ: SNE087AA

What about unemployment?
For those of you who have been following along, the June 2020 labour market statistics showed
a reduction in unemployment but a rise in those wanting more, or facing barriers to, paid work –
underutilisation. Namely 4% unemployment and 12% underutilisation.
The 4% unemployment was as much a feature of only counting people ‘actively seeking work’
during a period where we were locked down as much as the application of the wage subsidy – so
I was hanging out for this month’s figures.
At Budget time, Treasury was expecting unemployment to peak in the September quarter at just
under 10%3 and just before the election were looking at unemployment peaking in March 22 at
7.8%. That is a lower peak but a longer period at those levels.

3   https://www.treasury.govt.nz/publications/efu/budget-economic-and-fiscal-update-2020-html#section-4 Figure 1.3
2                                                                      CTU Monthly Economic Bulletin –November 2020
CTU Monthly Economic Bulletin - No. 224 (November 2020) - NZCTU
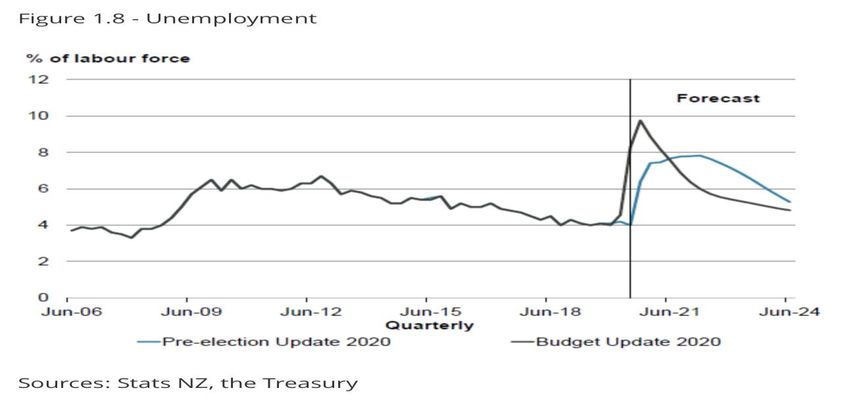
Not exactly a good thing – lower levels but for longer.
So all things considered, the actual results – 5.3% unemployment; 13.2% underutilisation – are
really not bad. This is the same as was the case in 2016 - 7 years after the Global Financial Crisis.
Although it is not clear if globally, we are coming out of the pandemic recession – or going into it
once the global government support comes off.
But as always – it is what is going on under the hood – how those figures are made up that tells
the story.
First of all, women’s employment has fallen faster than men’s employment over the last year.4

                                       Male v Female Employment
                       1,130.00

                       1,110.00
               (000)

                       1,090.00

                       1,070.00

                       1,050.00
                                  2019Q3         2019Q4          2020Q1         2020Q2          2020Q3
                                                     Source: Stats NZ HLF267AA

                                    Total male employees             Total female employees

4 This graph does look less extreme that the one I produced in the August bulletin. This is because Stats NZ have recalibrated the
information from the Household Labour Force Survey and not a mistake I made – which was my first thought.
3                                                                         CTU Monthly Economic Bulletin –November 2020
CTU Monthly Economic Bulletin - No. 224 (November 2020) - NZCTU
4
                                                                                                                                    People (000)

                                                                                                                                -10
                                                                                                                                 -8
                                                                                                                                 -4
                                                                                                                                 -2
                                                                                                                                  0
                                                                                                                                  2
                                                                                                                                  4
                                                                                                                                  6
                                                                                                                                  8
                                                                                                                                 10

                                                                                                                                 -6
                                                                                                                                 12
                                                                                                                                                                                                                                                                                                  Paid employees (000)

                                                                                                                                                                                                                                                                                                                                                             -30
                                                                                                                                                                                                                                                                                                                                                                   -20
                                                                                                                                                                                                                                                                                                                                                                         -10
                                                                                                                                                                                                                                                                                                                                                                               0
                                                                                                     Agriculture, Forestry, and…
                                                                                                           Manufacturing and…
                                                                                                                 Construction

                                                                                                                                                                                                                                                                                                      Years
                                                                                                             Wholesale Trade
                                                                                                              Retail Trade and…
                                                                                                         Transport, Postal and…
                                                                                                       Information Media and…

                                                                                                                                                                                                                                                                                                                 Years

                                                                                        Male
                                                                                                       Financial and Insurance…
                                                                                                 Rental, Hiring and Real Estate…
                                                                                                       Professional, Scientific,…

                                               Auckland
                                                                                                                                                                                                                                                                                                                            Years

                                                                                                    Public Administration and…

                                                                                                                                                                                                                                                                      Men
                                                                                                       Education and Training
                                                                                                        Health Care and Social…
                                                                                                                                                                                                                                                                                                                                       Years

                                                                                                   Arts, Recreation and Other…
                                                                                                                                                                                                                                                                      Women

                                               Wellington
                                                                                                                                                                                                              …with the primary impact being in Auckland for women.
                                                                                                     Agriculture, Forestry, and…
                                                                                                                                                                                                                                                                              Source: HLF267AA

                                                                                                           Manufacturing and…
                                                                                                                                                                                                                                                                                                                                                                                              Year to September 2020

                                                                                                                                                                                                                                                                                                                                                  Years

                                                                                                                 Construction

                                                                                                                                                                   Year to September 2020
                                                                                                                                                                                                                                                                                                    Aged 15-24 Aged 25-34 Aged 35-44 Aged 45-54 Aged 55-64

                                                            Source: Stats NZ HLF210AA
                                                                                                             Wholesale Trade

                                               Canterbury
                                                                                                              Retail Trade and…
                                                                                                                                                                                                                                                                                                   Over

                                                                                                         Transport, Postal and…
                                                                                                                                                                                                                                                                                                  Aged 65
                                                                                                                                                                                                                                                                                                 Years and
                                                                                                                                                                                                                                                                                                                                                                                   Change in paid employment by age and gender

                                                                                                       Information Media and…
                                                                                                                                                                                                                                                                                                                                                                                                                                 And this has impacted older women and young people disproportionately…

                                                                                                       Financial and Insurance…

                                                                                        Female
                                                                                                 Rental, Hiring and Real Estate…
                                                                                                                                                                                                                                                                                                     Ages
                                                                                                                                                                                                                                                                                                    Total All

                                                                                                       Professional, Scientific,…
                                                                                                                                                   Change in paid employment by industry, gender and region

                                                                                                    Public Administration and…
                                                                                                       Education and Training

CTU Monthly Economic Bulletin –November 2020
                                                                                                        Health Care and Social…
                                                                                                   Arts, Recreation and Other…
CTU Monthly Economic Bulletin - No. 224 (November 2020) - NZCTU
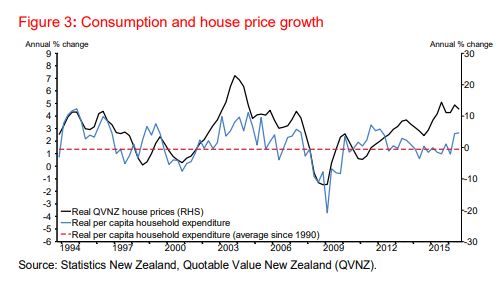
However, since June, the fall in part time and casual work seems to be reversing but with a drop
in both male and female permanent employment.

                                                    Employees by employment relationship
                                              120                                                                   1,040.00

                                                                                                                               Permanent employees (000)
            Casual, fixed term or temporary

                                              100                                                                   1,020.00
                                                                                                                    1,000.00
                                              80
                                                                                                                    980.00
                    employees (000)

                                              60                                                                    960.00
                                              40                                                                    940.00
                                                    2019Q3       2019Q4      2020Q1      2020Q2       2020Q3
                                                                   Source:Stats NZ HLF276AA

                                                            Male casual, fixed term or temporary employee (LHS)
                                                            Female casual, fixed term or temporary employee (LHS)
                                                            Male permanent employee (RHS)
                                                            Female permanent employee (RHS)

Although it is unclear how permanent the increase will be as perceived job security is much
lower for part time and casual work than it is for permanent employees - with the average being
about 21%.

                                                                 Job security
                                                High or medium perceived chance of losing job in
                                                               next 12 months
                   50.0%
                   40.0%
                   30.0%
                   20.0%
                   10.0%
                          0.0%
                                                Temporary     Casual    Fixed-term Permanent      Overall    Union       Not union
                                                employee                  & temp employee                   member       member
                                                                          agency
                                                            Source: Stats HLFS Table 7 Supplementary information

Moving now to unemployment and underemployment.

5                                                                                           CTU Monthly Economic Bulletin –November 2020
CTU Monthly Economic Bulletin - No. 224 (November 2020) - NZCTU
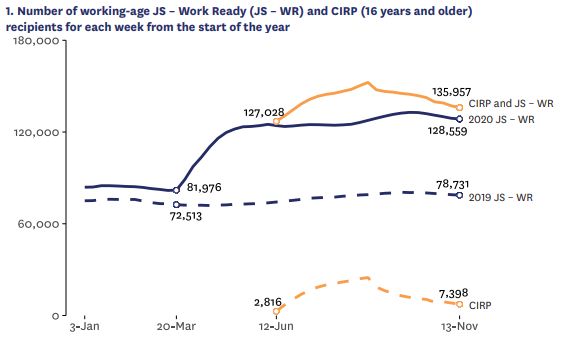
Pākehā men and women have broadly the same levels of unemployment at about 4%, while
Māori and Pasifika men and women have double those levels at 8%.

                                                  Unemployment rates by gender and ethnicity
                                10

                                8
                   Percentage

                                6

                                4

                                2

                                0
                                       European          Maori      Pacific Peoples      European            Maori         Pacific Peoples
                                                           Male                                              Female
                                                                           Source: HLF123AA

                                                      2019Q3      2019Q4     2020Q1       2020Q2      2020Q3

On the face of it while Māori, Pasifika and female unemployment is structurally higher than
Pākehā men’s unemployment; the increases are much lower than could have been expected
given we are currently living with a global pandemic – even with the benefit of the wage subsidy.
But unemployment involves actively looking for paid work and getting none. Other permutations
such as not enough paid work or having barriers to taking up employment are not included in the
unemployment statistics.
They are, however, included in the underutilisation statistics in addition to the unemployment
numbers. In terms of rates, we see Māori women, followed closely by Pasifika women, with
Māori and Pasifika men next in line, as having had the structural levels of high underutilisation
made worse in the last year.

                                              Underutilisation rate by gender and ethnicity
              25
              20
    Percent

              15
              10
               5
               0
                                     2019Q3              2019Q4             2020Q1                  2020Q2                 2020Q3
                                                                  Source: Stats NZ HLF280AA

                                         Male European              Male Maori                      Male Pacific Peoples
                                         Female European            Female Maori                    Female Pacific Peoples

6                                                                                     CTU Monthly Economic Bulletin –November 2020
Underutilisation by gender and ethnicity
                           140
            People (000)   120
                           100
                            80
                            60
                            40
                            20
                             0
                                  European       Maori        Pacific           European    Maori        Pacific
                                                             Peoples                                    Peoples
                                                 Male                                       Female
                                                             Source: HLF280AA

                                       2019Q3       2019Q4         2020Q1         2020Q2    2020Q3

And why all this matters is every number in the graph above is a person. Stats NZ recently
published their wellbeing survey. Two in particular caught my eye.
The first was overall life satisfaction. People had to rank their satisfaction on a scale of one to
ten. One being very low life satisfaction and ten being the highest possible. People who are
unemployed, underemployed or face barriers to paid employment recorded much lower life
satisfaction when compared to the total population. And while this is exactly as could be
expected, it is good to see it recognised formally.

                                                 Overall life satisfaction
                                                September 2020 quarter
                           35.0
                           30.0
                           25.0
                           20.0
               %

                           15.0
                           10.0
                            5.0
                            0.0
                                     0 to 6              7                  8               9             10
                                                  Source: Stats NZ: HLFS Wellbeing Table 9

                                                Total population        Underutilised people

7                                                                                   CTU Monthly Economic Bulletin –November 2020
The second was quality of housing. People who were underemployed, unemployed or face
barriers to paid employment are twice as likely to have major problems with damp or mouldy
homes or with heating or keeping warm in winter.

                                                           Housing quality - Major problems
                                                              September 2020 quarter
                      10.0
                             8.0
                             6.0
           %

                             4.0
                             2.0
                             0.0
                                                            Dampness or mould                 Heating or keeping warm in winter
                                                                      Source: Stats NZ HLFS Wellbeing Table 9

                                                                   Total population     Underutilised people

What about wages? How are they doing?
On a simple comparison to the consumer price index, while the increases are lower than this
time last year, they are still higher than the CPI.

                                                          Average hourly wage increases v CPI
                                                 4.7
            % change from same period previous

                                                 4.2
                                                 3.7
                                                 3.2
                                                 2.7
                           year

                                                 2.2
                                                 1.7
                                                 1.2
                                                          2019Q3           2019Q4         2020Q1          2020Q2          2020Q3
                                                                          Source: Stats NZ QEX047AA CPI035AA

                                                  Private Sector        Total public and private sector        Consumer Price Index

Although as we have discussed before, the CPI relates to an average basket of goods.

8                                                                                                 CTU Monthly Economic Bulletin –November 2020
For people with the lowest 20% of incomes in New Zealand; their ‘inflation’ with the exception of
the last quarter is significantly higher than the average. People with the highest 20% of incomes
have consistently lower ‘inflation’ than the lowest income group and the average CPI.

                                                                 Annual change in prices
                                              3.0%
            Percentage change on same month

                                              2.5%

                                              2.0%
                      previous year

                                              1.5%

                                              1.0%

                                              0.5%

                                              0.0%
                                                       2019M09       2019M12      2020M03      2020M06       2020M09
                                                                     Source: Stats NZ HPI001AA CPI009AA

                                              Consumer Price Index    Lowest 20% by income     Highest 20% by income

Housing is a key driver of this difference. With high rents being a disproportionate expense for
the lowest incomes and low interest rates being a greater feature of high-income people’s
expenditure – this helps explain a lot of the difference.

Allowing for the different types of ‘inflation’ this means that the effect of the higher wages in
raising living standards has been less for those with lower incomes, compared to their living
costs, than people with higher incomes.

But there seem to be some positives from a gender and ethnic perspective. Weekly earnings
received by women have increased by region…

9                                                                                        CTU Monthly Economic Bulletin –November 2020
10
                                                                                                                                                                                                                                                                                                                              0.0%
                                                                                                                                                                                                                                                                                                                                     2.0%
                                                                                                                                                                                                                                                                                                                                            4.0%
                                                                                                                                                                                                                                                                                                                                                   6.0%
                                                                                                                                                                                                                                                                                                                                                          8.0%

                                                                                                                            0.0%
                                                                                                                            2.0%
                                                                                                                            4.0%
                                                                                                                            6.0%
                                                                                                                            8.0%
                                                                                                                           12.0%
                                                                                                                           14.0%

                                                                                                                           -8.0%
                                                                                                                           -6.0%
                                                                                                                           -4.0%
                                                                                                                           -2.0%
                                                                                                                           10.0%
                                                                                                  Forestry and Mining

                                                                                                        Manufacturing

                                                                                                                                                                                                 and by industry.
                                                                                    Electricity, Gas, Water and Waste
                                                                                                  Services

                                                                                                          Construction
                                                                                                                                                                                                                                                                                                                      Men
                                                                                                     Wholesale Trade

                                                                                                           Retail Trade

                                                                                   Accommodation and Food Services

                                                                                   Transport, Postal and Warehousing
                                                                                                                                                                                                                                                       Auckland Regional Council Area

                                               Male
                                                                                                                                                                                                                    Canterbury Regional Council Area

                                                                                               Information Media and
                                                                                                                                                                                                                                                                                                                                                                                          change

                                                                                                Telecommunications

                                                                                                                                                             change

                                               Female
                                                                                     Financial and Insurance Services
                                                                                                                                                                                                                    Rest of NZ

                                                                                        Rental, Hiring and Real Estate
                                                                                                                                                                                                                                                                                          Source: Stats NZ QEX009AA
                                                                                                                                                                                                                                                                                                                                                                                 Year to September 2020

                                                                                                   Services

                                                        Source:Stats NZ QEX007AA
                                                                                                                                                    Year to September 2020
                                                                                    Professional, Scientific, Technical,
                                                                                       Administrative and Support…

                                                                                     Public Administration and Safety
                                                                                                                                                                                                                                                                                                                      Women

                                                                                                                                                                                                                                                       Wellington Regional Council Area

                                                                                               Education and Training

                                                                                    Health Care and Social Assistance
                                                                                                                                                                                                                                                                                                                                                                 Average weekly earnings (employee) by gender and region -

                                                                                           Arts, Recreation and Other
                                                                                                                                   Average weekly earnings (employee) by gender and industry -

                                                                                                     Services

                                                                                                    Total All Industries

CTU Monthly Economic Bulletin –November 2020
Except these numbers reflect the incomes of the people still in work. If low paid women have
been removed from the calculation – as appears to be the case from the previous discussion on
unemployment and underutilisation – it isn’t the positive story as it may appear and simply a
function of how averaging works.5

And for completeness, particularly in light of Jennifer Laulala’s plea to address the ethnic and
gender pay gap in the Ministry of Justice - here is the most recent gender wage gap by sector 6.
Although it has fallen since this time last year in both the public and private sector; it is unclear
how much of this is driven by the reduction in the number of low paid women from the
calculation.

                                     Gender wage gap by sector
                                       September 2020 year
            21%                          19%
                         18%
            19%                                             17%               17%           17%
            17%

            15%          14%
                                         13%                13%
            13%                                                               12%           12%

            11%
                       2019Q3          2019Q4              2020Q1           2020Q2        2020Q3
                                               Source: Stats NZ QEX002AA

                                           Public Sector            Private Sector

So what to do all about it?
While the wage subsidy has done its job in supporting the economy and employment generally –
it is time for targeting. When the Prime Minister was recently asked about the gender and ethnic

5 For example, if there are two people in paid work one who earns $1000 and another who earns $100 – the average wage is
$550. If the low paid person loses their job – the average becomes $1000. While there has been an increase of 82% in the
average wage – no one is better off and in fact the low paid person is worse off as they now have no income.
6 https://www.nzherald.co.nz/nz/politics/why-have-we-been-forgotten-prime-minister-urged-to-take-action-on-gender-pay-gap-

for-maori-and-pasifika-women/F4FL5VONZ7UM7C2EKNTVMMMSOI/
11                                                                      CTU Monthly Economic Bulletin –November 2020
disparities in the unemployment and under-utilisation figures she said that her hope was that the
flexiwage scheme would be of use in reducing the disparities.7
Now there is a lot to like about the flexiwage scheme8. It is a subsidy for employers to help with
training and mentoring a new staff member who comes from WINZ. For the employee to be
eligible they need to be on a main benefit - JobSeeker, Sole Parent, Supported Living - or WINZ
are helping them find a job.
And in terms of targeting those on a benefit – potentially long term – it is a great initiative.
For women though, if they have a partner who earns the fulltime minimum wage, they are not
eligible for a main benefit. They may have been eligible for the Covid Income Relief Payment but
if Māori or Pasifika they were twice as likely to have their application declined than Pākehā.9
So then the other eligibility criterion of having ‘asked [WINZ] for help with getting or keeping a
job’ becomes all the more important. If the flexiwage scheme is going to have an impact on the
structural nature of un, and under, employment for Māori, Pasifika, and women this criterion
needs to be extensively promoted.

What’s the deal with the Reserve Bank and House Prices?
As discussed in the February Bulletin, the Reserve Bank currently has a joint mandate – inflation
based on the consumer price index to be within 1 to 3% within the medium term and maximum
sustainable employment. 10
Maximum sustainable employment while ostensibly a new measure had been conveniently
interpreted to mean the Non-Inflationary Rate of Unemployment – or NAIRU – which they call
full employment – also known as 4% unemployment or 111,000 people, seasonally adjusted as at
December 2019, actively seeking paid employment and getting none. Plus of course the 90,000
who wanted more paid work and the 84,000 who want a job but face barriers to employment.
That’s right – full employment.11
The Reserve Bank’s main tool for keeping down inflation and holding up employment is interest
rates. In the days when we had higher interest rates it was able to reduce them through cutting

7
 https://www.stuff.co.nz/business/industries/123302797/prime-minister-pledges-311m-to-help-workers-made-unemployed-
due-to-covid19-get-into-jobs
8 https://www.workandincome.govt.nz/products/a-z-benefits/flexi-wage.html
9 https://www.rnz.co.nz/news/te-manu-korihi/429746/unfair-outcomes-for-maori-seeking-covid-income-support
10 https://www.union.org.nz/wp-content/uploads/2020/03/CTU-Economic-Bulletin-217-February-2020.pdf
11 In other words, this kind of monetary policy requires 110,000 people to be unemployed – if one finds a job it requires another

to lose theirs. So cut out the punitive rhetoric of people on benefits not wanting jobs and pay them proper compensation for
taking on unemployment in the public interest. Or change the policy!

12                                                                       CTU Monthly Economic Bulletin –November 2020
the OCR. This is the rate that the Reserve Bank pays on settlement balances Banks hold with the
Reserve Bank.
When they got to an OCR of 0.25% but with falling inflation and employment, they needed
another tool. Here is where the Large-Scale Asset Purchase Programme (LSAP) also known as
Quantitative Easing comes in. The Reserve Bank buys bonds held by Banks and pays for it with an
increase to the Bank’s settlement account with the Reserve Banks. This is money creation and is
also known as printing money.
The effect of the Reserve Bank providing extra demand for the bonds is that the bonds’ yields fall
which in turn lowers the prevailing interest rate in the market.
How this is supposed to help is by12:
     •   Lowering the exchange rate as New Zealand dollar denominated bonds become less
         valuable with a lower interest rate as people are less likely to want New Zealand dollars.
         A lower exchange rate should help New Zealand exporting businesses who, with sales in
         foreign currencies, could effectively charge higher NZD prices or at least receive more
         NZD for same amount of foreign currency and therefore be able to take on (or at least not
         lay off) staff.

     •   Lowering the ‘hurdle rate’ for business investment, making it more likely businesses
         expand/not fall over and take on (or at least not lay off staff).

     •   Increase the value of other assets with the effect that their owners feel richer and spend
         more – aka the wealth effect – aka trickle down.

All of which assume that the Banks will pass the lower interest rates on to businesses and
households.
What has actually happened is this:
     •   Housing loans have continued to climb,
     •   commercial property loans are up,
     •   agriculture loans have plateaued, and
     •   other business loans have fallen.

 All of which makes sense as with the current business uncertainty and rising house prices –
residential loans are a much better bet than lending to business.

12For a more fulsome explanation Chapter 6 https://www.rbnz.govt.nz/-/media/ReserveBank/Files/Publications/monetary-
policy-handbook/Monetary-Policy-Handbook.pdf?revision=4922a7fe-d539-4cab-a0d6-9bd47fb152fa
13                                                                  CTU Monthly Economic Bulletin –November 2020
Coomercial property, Agriculture
                                                     Bank Lending by Purpose
                                           80,000                                                           295,000
           and other Business loans

                                                                                                                      Housing loans $NZD
                                           70,000                                                           285,000
                                                                                                            275,000
                                           60,000
                                                                                                            265,000
                   NZD $M

                                           50,000
                                                                                                            255,000
                                           40,000                                                           245,000
                                           30,000                                                           235,000
                                                Sep 2017         Sep 2018         Sep 2019          Sep 2020
                                                    Source: RBNZ Banks: Assets- Loans by purpose - S31

                                            Total Commercial Property Loans       Other Business Loans
                                            Total Agriculture Loans               Housing Loans

While the exchange rate might be a channel for keeping investment and employment up –
although with New Zealand doing a better job in its Covid response than most countries and
every else doing QE – there may not be much happening in that area. Having said that, the
markets took the effect of Minister Robertson’s letter – discussed below – to mean that interest
rates would not fall further, and the exchange rate strengthened.

                                                                NZD exchange rates
                                 0.7020                                                                        0.9530
                                 0.7010
                                                                                                               0.9520
                                 0.7000
                                                                                                               0.9510
                                                                                                                                       AUD/NZD
                    USD/NZD

                                 0.6990
                                 0.6980                                                                        0.9500
                                 0.6970
                                                                                                               0.9490
                                 0.6960
                                                                                                               0.9480
                                 0.6950
                                 0.6940                                                                        0.9470
                                               23 Nov 2020 24 Nov 2020 25 Nov 2020 26 Nov 2020 27 Nov 2020
                                                                 Source: RBNZ - hb1 - daily

                                                                      USD (LHS)      AUD (RHS)

Business loans are falling – but maybe they would fall by more with higher interest rates?
But the stellar performer is housing loans and house prices.

14                                                                                           CTU Monthly Economic Bulletin –November 2020
A 2017 research note by Martin Wong at the Reserve Bank13 found a 1% increase in consumption
for every 10% increase in house prices with a weaker correlation post 2005.14 That is, the
increase in house prices is not a ‘bug – it’s a feature’.15

However, the graph ends in 2016. What is the current effect of house prices on demand?
While it is not easy to directly correlate the two – what we do know from the most recent
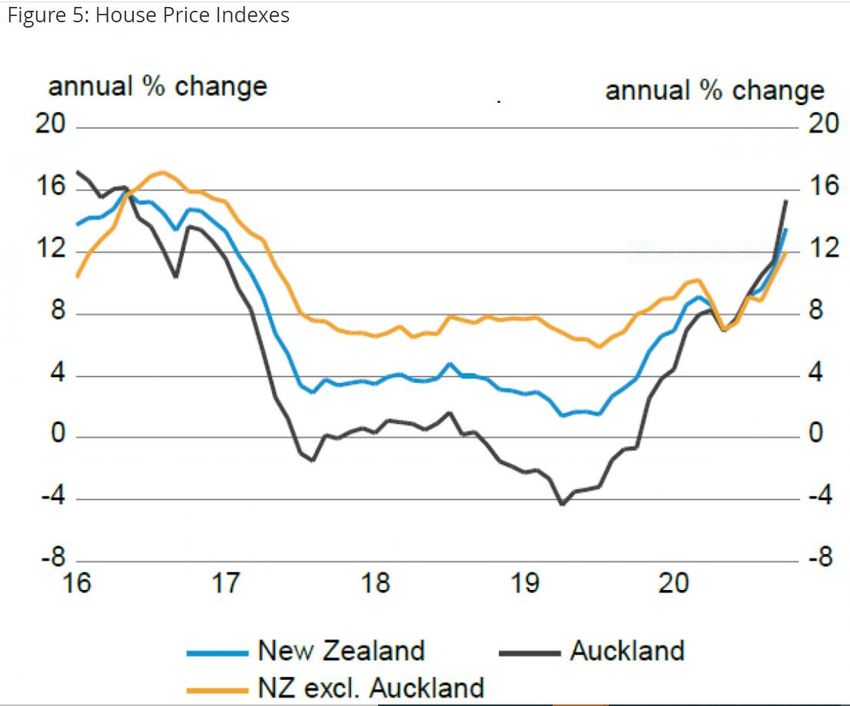
Treasury Economic Update16 is:

       Total electronic card spending in October was up 2.9% on the same month last
       year and retail card spending was up 8.2%. Spending at restaurants, cafes and
       takeaways was up 8.8% compared to October 2019. This is the second highest
       spend in this industry in over 20 years.

13
  https://www.rbnz.govt.nz/-/media/ReserveBank/Files/Publications/Analytical%20notes/2017/an2017-
03.pdf?revision=5c0378fd-d843-4a6f-b6a0-a73a665d8b2f
14 Page 5
15 https://thekaka.substack.com/p/q-and-a-who-is-to-blame-for-the-housing
16 https://www.treasury.govt.nz/publications/weu/weekly-economic-update-13-november-2020-html

15                                                                CTU Monthly Economic Bulletin –November 2020
So yes – as much as we might not like it – there does seem to be a correlation
between house prices, consumer spending – and higher than expected levels of
employment.
Which makes the Minister of Finance’s announcement that he had written to the Governor of
the Reserve Bank to perhaps think about considering factoring in house prices when setting
monetary policy quite interesting.17
Unless there is a further mechanism for increasing consumption – it could be that employment is
traded off for house prices.
But that other mechanism could be something as simple as increasing benefits18, raising wages in
the public sector or bringing forward the commitment to paying the living wage to contractors in
the public sector.
Because the more that stimulus is targeted at the lower income people; the more likely it will be
spent rather than saved.
All without increasing house prices. Double duty indeed.

17   https://www.beehive.govt.nz/sites/default/files/2020-11/Letter%20to%20RBNZ%20Governor.pdf
18   https://www.cpag.org.nz/news/?m=202011
16                                                                   CTU Monthly Economic Bulletin –November 2020
As always, I welcome feedback to andreab@nzctu.org.nz. I am still here until mid-December.

Kia Kaha
Andrea

The NZIER consensus forecast was released on 14 September 2020

      Annual Percentage Change (March Year)        2019/20    2020/21     2021/22    2022/23

      GDP                                            1.7        -7.2         6.7        3.5

      CPI                                            2.5         0.4         0.9        1.6
      Private Sector average hourly wage             3.4         1.8         1.4        1.9
      Employment                                     1.5        -5.2         3.1        2.8
      Unemployment rate (% of labour force)          4.2         7.8         6.8        5.8

17                                                   CTU Monthly Economic Bulletin –November 2020
Economic Indicators – November 2020

As I prepare these indicators, I am reminded that the reason I started was to show that even
though employment was down and income support from the Government was up; rents, house
and share prices were also all down.
This was the outcome with the Global Financial Crisis and is what could be expected normally
when there is as large a shock to the world’s economy as there has been with a global pandemic.
But other than for a brief moment, in March and April, this has proved not to be the case. While
unemployment – as discussed in the commentary – has not been as high as expected; the capital
markets have increased more than anyone could have expected.
This month the total number of people receiving income support from the Government has
reduced by over 3,000 predominately because of the decline in numbers of people on the Covid
Income Relief Payment. The wage subsidy has now run its course.
Rent and Food continue to increase faster – or much faster in the case of rent – than the
Consumer Price Index. Rent and food price rises continue to be the reason for the Household
Living Cost Price Index for low income to exceed that of high-income people. Also high income
people are benefiting from very low interest rates which are much less of a part of expenditure
than for low income people.
And while the Bond market has fallen slightly, house prices and share prices continue to be at
record levels.

     1) Jobseeker Support and Covid-19 Income Relief Payment19

As at 13 November there were 135,937 people on the Jobseeker Support – work ready and Covid
Income Relief Payment. In addition, there were 74,806 people on Jobseeker Support – Health
Condition and Disability. This gives a total of 210,743 people.
This is a reduction of 3,945 people from last month of which 3,119 people have gone off the
Covid Income Relief Payment. It is unclear how many of those people have gone into paid
employment and how many have simply had the payment come to an end.

19https://www.msd.govt.nz/documents/about-msd-and-our-work/publications-resources/statistics/benefit/2020/income-
support-and-wage-subsidy-weekly-update/income-support-weekly-update-13-november-2020.pdf

18                                                                 CTU Monthly Economic Bulletin –November 2020
2) Wage Subsidy

From a peak of 1.7 million jobs – there are now no jobs being supported by the wage subsidy.

       3) Rent, Food and CPI.

Rent – stock – is up 0.2% for the month of October and up 3.2% for the year to October 2020.
Food has declined by .66% in the month but increased by 2.7% in the year. In the last year the
cumulative impact of price rises for food over the last ten years exceeded the cumulative effect
of general price rises.
Given the higher weight food plays in the consumption of lower income people – as seen in the
Household Living Cost Indexes – than higher income people; it is heartening to see the
Government’s review into competition in the Supermarket Industry.20

20   https://www.beehive.govt.nz/release/supermarkets-announced-government%E2%80%99s-second-market-study
19                                                                CTU Monthly Economic Bulletin –November 2020
Annual Change in Cost of Rent and Food v. CPI
                                                              8%                                                                                               Rent - stock

             Percentage Change on Same Month
                                                                                                                                                               Food
                                                              6%                                                                                               CPI

                       Previous Year
                                                              4%

                                                              2%

                                                              0%

                                                              -2%
                                                                                                   2013M10
                                                                    2010M10

                                                                               2011M10

                                                                                         2012M10

                                                                                                             2014M10

                                                                                                                       2015M10

                                                                                                                                 2016M10

                                                                                                                                           2017M10

                                                                                                                                                     2018M10

                                                                                                                                                               2019M10

                                                                                                                                                                         2020M10
                                                                                  Source: Stats NZ CPI009AA, CPI045AA and CPI004AA

                                                                                             Rent and Food Indexes v. CPI
                                                              140
                             Index Rebased March 2010 = 100

                                                              135                        Rent - stock
                                                                                         Food
                                                              130                        CPI
                                                              125
                                                              120
                                                              115
                                                              110
                                                              105
                                                              100
                                                                    2010M10

                                                                               2011M10

                                                                                         2012M10

                                                                                                   2013M10

                                                                                                             2014M10

                                                                                                                       2015M10

                                                                                                                                 2016M10

                                                                                                                                           2017M10

                                                                                                                                                     2018M10

                                                                                                                                                               2019M10

                                                                                                                                                                          2020M10

                                                                        Source: Stats NZ CPI009AA, CPI045AA and CPI004AA rebased to 2010

     4) Household Living Cost Price Indexes

Continuing the trend, as food and rent have gone up faster than the consumer price index and
interest costs have gone down, the cost of living for low income people is much higher than that
for high income people. This is both on a ten-year cumulative basis and also in the September
2020 quarter.

20                                                                                                                               CTU Monthly Economic Bulletin –November 2020
Annual Change in Household Living-Cost Price Index v. CPI

           Percentage Change on Same Quarter Previous    6%                                                                                                           CPI
                                                                                                                                                                      Lowest 20% by income
                                                         5%
                                                                                                                                                                      Highest 20% by income
                                                         4%

                                                         3%

                                                         2%
                              Year

                                                         1%

                                                         0%

                                                        -1%
                                                                         2011Q3
                                                               2010Q3

                                                                                      2012Q3

                                                                                                  2013Q3

                                                                                                                    2014Q3

                                                                                                                                      2015Q3

                                                                                                                                                    2016Q3

                                                                                                                                                               2017Q3

                                                                                                                                                                            2018Q3

                                                                                                                                                                                     2019Q3

                                                                                                                                                                                                2020Q3
                                                                                      Source: Stats NZ CPI009AA and HPI001AA

                                                                             Household Living-Cost Price Index v. CPI

                                                        125                        CPI
                                                                                   Lowest 20% by income
                  Index Rebased Q1 2010 = 100

                                                                                   Highest 20% by income
                                                        120

                                                        115

                                                        110

                                                        105

                                                        100
                                                              2010Q3

                                                                          2011Q3

                                                                                         2012Q3

                                                                                                           2013Q3

                                                                                                                             2014Q3

                                                                                                                                               2015Q3

                                                                                                                                                             2016Q3

                                                                                                                                                                            2017Q3

                                                                                                                                                                                       2018Q3

                                                                                                                                                                                                     2019Q3

                                                                        Source: Stats NZ CPI009AA and HPI001AA rebased to 2010

      5) The sharemarket

As at 23 November, the sharemarket at 12,504 was again higher than its late February 2020 peak
of 12,073. 21

21   https://www.bloomberg.com/quote/NZSE50FG:IND
21                                                                                                                                                           CTU Monthly Economic Bulletin –November 2020
6) Bonds22

While lower, it is not materially lower than its August peak.

22For bonds, usually it is the yields that are tracked rather than the price of the bonds and so it can be difficult to find out what is
happening to the price. As a proxy I am looking at the exchange traded fund for New Zealand bonds.
https://www.nzx.com/instruments/NZB
22                                                                           CTU Monthly Economic Bulletin –November 2020
7) House prices23

The brief Lockdown 1.0 price drop is now over and house prices as at October continue to
increase steadily. The decline I had hoped for in March continues as a memory.

23https://www.reinz.co.nz/Media/Default/Statistic%20Documents/2020/October/REINZ%20Monthly%20HPI%20Report%20-
%20October%202020.pdf
https://treasury.govt.nz/publications/weu/weekly-economic-update-13-november-2020-html
23                                                             CTU Monthly Economic Bulletin –November 2020
Notes
This bulletin is available online at http://www.union.org.nz/economicbulletin224. For further information
contact Andrea Black

24                                                         CTU Monthly Economic Bulletin –November 2020
July 2020 (latest
data as at 6 July 2020)                                          8

Parliamentary Library, Research and Information   February 2020 (latestdata as at11February 2020)
You can also read