DE BEERS FINANCE SEMINAR - Anglo American
←
→
Page content transcription
If your browser does not render page correctly, please read the page content below
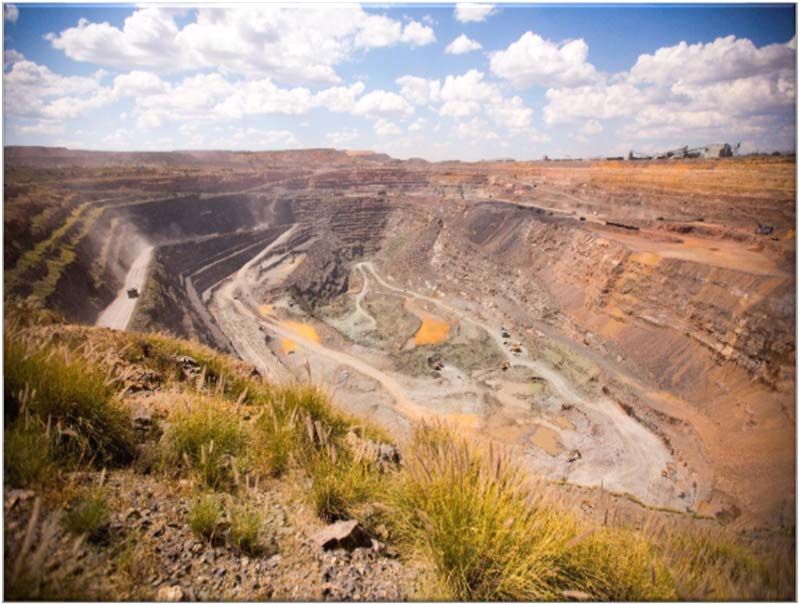
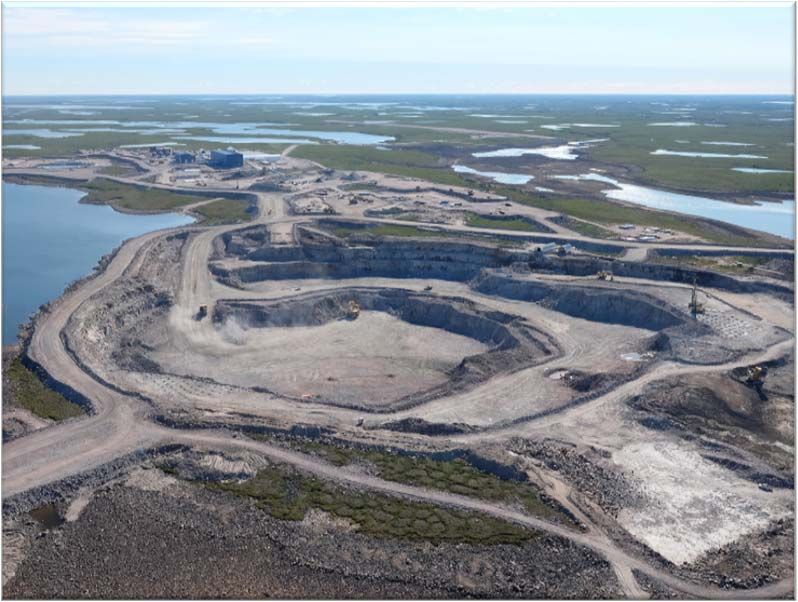
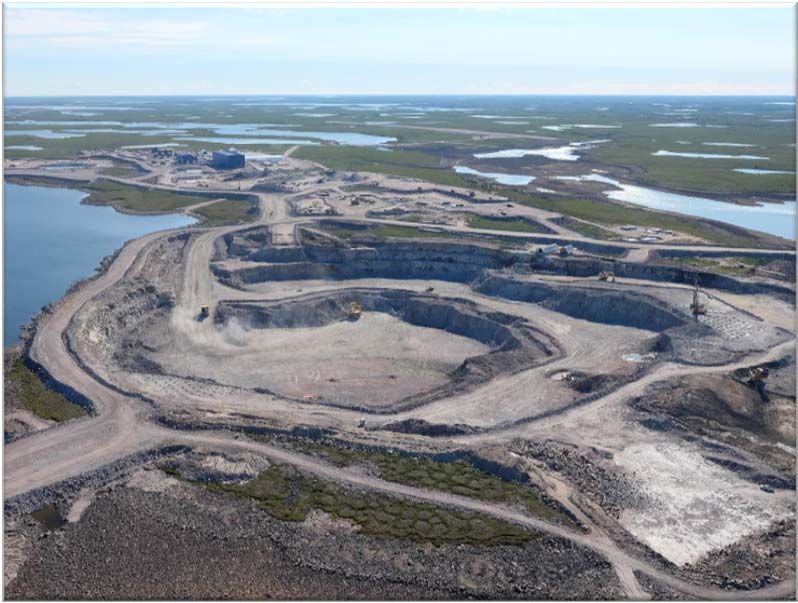
DE BEERS
FINANCE SEMINAR

Image: Gahcho Kué pit and process plant   Image: Aggregating / Sorting   Image: Forevermark by TBZ The Original Bracelet
CAUTIONARY STATEMENT

Disclaimer: This presentation has been prepared by Anglo American plc (“Anglo American”) and comprises the written materials/slides for a presentation concerning Anglo American. By
attending this presentation and/or reviewing the slides you agree to be bound by the following conditions.
This presentation is for information purposes only and does not constitute an offer to sell or the solicitation of an offer to buy shares in Anglo American. Further, it does not constitute a
recommendation by Anglo American or any other party to sell or buy shares in Anglo American or any other securities. All written or oral forward-looking statements attributable to Anglo
American or persons acting on their behalf are qualified in their entirety by these cautionary statements.

Forward-Looking Statements
This presentation includes forward-looking statements. All statements other than statements of historical facts included in this presentation, including, without limitation, those regarding
Anglo American’s financial position, business, acquisition and divestment strategy, plans and objectives of management for future operations (including development plans and objectives
relating to Anglo American’s products, production forecasts and reserve and resource positions), are forward-looking statements. By their nature, such forward-looking statements involve
known and unknown risks, uncertainties and other factors which may cause the actual results, performance or achievements of Anglo American, or industry results, to be materially different
from any future results, performance or achievements expressed or implied by such forward-looking statements.
Such forward-looking statements are based on numerous assumptions regarding Anglo American’s present and future business strategies and the environment in which Anglo American will
operate in the future. Important factors that could cause Anglo American’s actual results, performance or achievements to differ materially from those in the forward-looking statements
include, among others, levels of actual production during any period, levels of global demand and commodity market prices, mineral resource exploration and development capabilities,
recovery rates and other operational capabilities, the availability of mining and processing equipment, the ability to produce and transport products profitably, the impact of foreign currency
exchange rates on market prices and operating costs, the availability of sufficient credit, the effects of inflation, political uncertainty and economic conditions in relevant areas of the world,
the actions of competitors, activities by governmental authorities such as changes in taxation or safety, health, environmental or other types of regulation in the countries where Anglo
American operates, conflicts over land and resource ownership rights and such other risk factors identified in Anglo American’s most recent Annual Report. Forward-looking statements
should, therefore, be construed in light of such risk factors and undue reliance should not be placed on forward-looking statements. These forward-looking statements speak only as of the
date of this presentation. Anglo American expressly disclaims any obligation or undertaking (except as required by applicable law, the City Code on Takeovers and Mergers (the “Takeover
Code”), the UK Listing Rules, the Disclosure and Transparency Rules of the Financial Conduct Authority, the Listings Requirements of the securities exchange of the JSE Limited in South
Africa, the SWXSwiss Exchange, the Botswana Stock Exchange and the Namibian Stock Exchange and any other applicable regulations) to release publicly any updates or revisions to any
forward-looking statement contained herein to reflect any change in Anglo American’s expectations with regard thereto or any change in events, conditions or circumstances on which any
such statement is based.
Nothing in this presentation should be interpreted to mean that future earnings per share of Anglo American will necessarily match or exceed its historical published earnings per share.
Certain statistical and other information about Anglo American included in this presentation is sourced from publicly available third party sources. As such it presents the views of those third
parties, but may not necessarily correspond to the views held by Anglo American.

No Investment Advice
This presentation has been prepared without reference to your particular investment objectives, financial situation, taxation position and particular needs. It is important that you view this
presentation in its entirety. If you are in any doubt in relation to these matters, you should consult your stockbroker, bank manager, solicitor, accountant, taxation adviser or other independent
financial adviser (where applicable, as authorised under the Financial Services and Markets Act 2000 in the UK, or in South Africa, under the Financial Advisory and Intermediary Services Act
37 of 2002).
AGENDA

Section 1: Demand Drivers………………………………………………………………. 30 mins

Section 2: Group Overview……………………………………………………………..... 30 mins

                                   Q&A

Section 3: Upstream………………………………………………………………………… 20 mins

Section 4: Downstream……………………………………………………………………. 10 mins

                         Summary & Q&A

                                                                2
                           The De Beers Group of Companies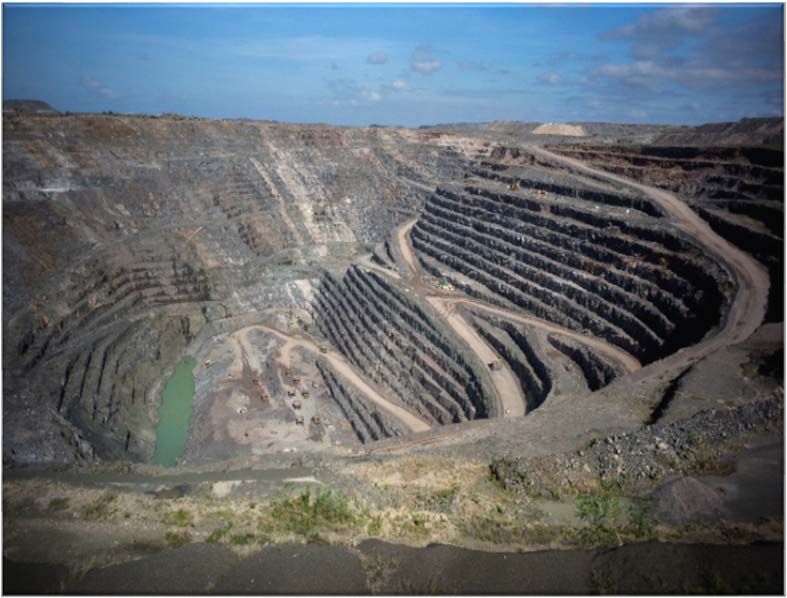
DEMAND DRIVERS
DIAMOND INDUSTRY OVERVIEW

     Diamond demand almost exclusively jewellery driven                                                     Global polished diamond demand has remained roughly flat
 % demand
                                                                                                             over the last 3 years at ~$25bn(1) while rough sales have
                                                                                                               been more volatile, impacted by midstream dynamics
     Jewellery             Industrial          Investment        Autocatalyst

                                                                 34%                                                  GDP
                                        47%
                                                                                                                                               2014              2015   2016
          99%                            8%
                                                                 22%
                                                                 4%                                                Personal                     Diamond jewellery sales ($bn)
                                                                                                               Disposable Income
                                        45%                      40%
           1%                                                                                                                                    81              79     80
                                                                                                                    Jewellery
      Diamonds                          Gold                Platinum                                                  Retail
                                                                                                                                             Polished diamond demand ($bn)(1)
Source: De Beers, World Gold Council, Johnson Matthey May 2016
                                                                                                                   Jewellery                     25              25     25
                                                                                                                 Manufacturing
  A greater proportion of value comes from larger diamonds

Same value ($500k), different volume – No two diamonds are alike
                                                                                                                    Cutting,                              Midstream
                                                                                                                   Polishing
                                                                                                                   & Trading
                                                                                                                                                  Rough diamond sales ($bn)
                                                                                                                     Rough
                                                                                                                  Distribution                   19               14     16
                                                                                                                   & Trading
                  (10ct)                        (100ct)                 (2000ct)

                                                                                                       Source: 2016 De Beers Insight Report; De Beers analysis
                                                                                                                                                                                4
                                                                          The De Beers Group of Companies
 (1)Measured   in polished wholesale terms
GDP
Personal
Disposable Income
Jewellery
KEY DEMAND DRIVERS
manufacturing
Cutting, polishing
& trading
Long term polished demand closely correlated to GDP US and China remain key, driving overall demand
Indexed polished demand vs. indexed GDP for the US Polished demand (polished wholesale price; nominal)
(1990 = 100) 2011: $23bn 2016: $25bn
Indexed polished demand
Other
Other
26% 22%
USA
38%
47% USA
Gulf 7%
Long term relationship 8%
clear, although short Gulf 5%
6% Japan
term divergences occur 6%
Japan 10% 11%
India 13%
Indexed GDP India China*
China*
Source: De Beers analysis Source: De Beers analysis; *Excluding Hong Kong and Macau
GDP forecasts weighted by region underpin growth estimates Polished demand has largely tracked GDP (in USD)
% GDP growth (real / local currency / unadjusted) 2016 2017 Polished demand (polished wholesale price; nominal; $bn)
7.1 6.9
6.7 6.7 25.4 25.5
24.5 25.2 Constant FX
23.0 23.6 0.6 0.8 (2014 rates)
USD terms
2.7 24.8 24.7
2.2 2.1 2.3
1.6 1.4
1.0
0.3
USA China India Japan Gulf World 2011 2012 2013 2014 2015 2016
Source: Oxford Economics, August 2017 Source: 2016 De Beers Insight Report and company analysis
5
The De Beers Group of Companies
GDP

                                                                                                                                                            Personal
                                                                                                                                                        Disposable Income
                                                                                                                                                           Jewellery

CURRENCY IMPACT
                                                                                                                                                          manufacturing
                                                                                                                                                         Cutting, polishing
                                                                                                                                                             & trading

       Non-US demand impacted by USD strengthening                                            USD strengthening impact felt in India, China & Japan
                   Global diamond jewellery demand                                      Global jewellery demand growth and related exchange rates
                             2016 = $80bn                                                                                          YoY Ave. FX
                                                                                                              Local growth %                        USD growth %
                                                                                                                                    change %
                                                                                          2015
                                                     US
                                                    $41bn                                            China                   3        (2)%                      1
            Non-US
             $34bn
                                                                                                      India       (4)                 (5)%         (9)

                                                                                                     Japan              0            (14)%       (13)

                                   US linked $5bn                                                      USA                     5                                    5
Source: De Beers Analysis

    partially offset by lower producer costs in USD terms                                            Global                                              (2)

Currencies versus USD (indexed to 100)
                                                                                         2016
 110                                                           100%
                                                                                                     China               1            (6)%              (5)
                                                                        US$
                                                                       USD
 100                                                                  Based
                                                                      Based                           India (9)                       (5)%       (13)
  90
                                                                      Non-USD
  80
                                                                        Non-
                                                                       Based
                                                                                                     Japan        (3)                 10%                               8
                                                                          US$
  70                                                                     Based                         USA                   4                                      4

  60                                                                                                 Global                                                     0
  Jan ‘14             Jan ‘15            Jan ‘16      Jan ’17 Upstream
                            Pula       Rand                     Costs                     Source: De Beers analysis
Source: FactSet
                                                                                                                                                                              6
                                                                   The De Beers Group of Companies
Personal
                                                                                                                                                              Disposable Income
                                                                                                                                                                 Jewellery
                                                                                                                                                                manufacturing
                                                                                                                                                              Cutting, polishing

MIDSTREAM
                                                                                                                                                                  & trading
                                                                                                                                                              Rough distribution
                                                                                                                                                                  & trading

 Midstream profitability / returns are driven by a number of                                      … one of which is the relationship between rough and
                          factors …                                                                                 polished prices …
                                                                                                  Index             Sustainable
                     Cutting, polishing, manufacturing                                                                margin
                                                                                            120
    Polished         • Labour / manufacturing costs             Rough
                                                                                            110
    demand                                                      sales
                     • Technology development
                                                                                            100
  2014 $25bn         • Stock levels                          2014 $19bn                                                                                                Polished
  2015 $25bn                                                 2015 $14bn                       90
                     • Finance cost and availability                                                                                                                   Rough
  2016 $25bn                                                 2016 $16bn
                                                                                              80
                                                                                                      2013         2014       2015          2016       2017
                                                                                             Source: De Beers analysis

      ... with returns also dependent on the amount and
                                                                                                 … with De Beers’ share of the rough market ~mid-30%
                          mix in stock …
                             Stock to sales ratio
                                                                                                                          35%                             36%
                                                                                                             33%                           31%
   Jewellery retail
                                             Normal levels
     Jewellery
   manufacturing

 Cutting / polishing            High          Low         Normalising

                                2014         2015        2016    H1 2017                                  2013            2014             2015           2016
Source: De Beers analysis                                                                    Source: 2016 De Beers Insight Report; De Beers analysis
                                                                                                                                                                                   7
                                                                    The De Beers Group of Companies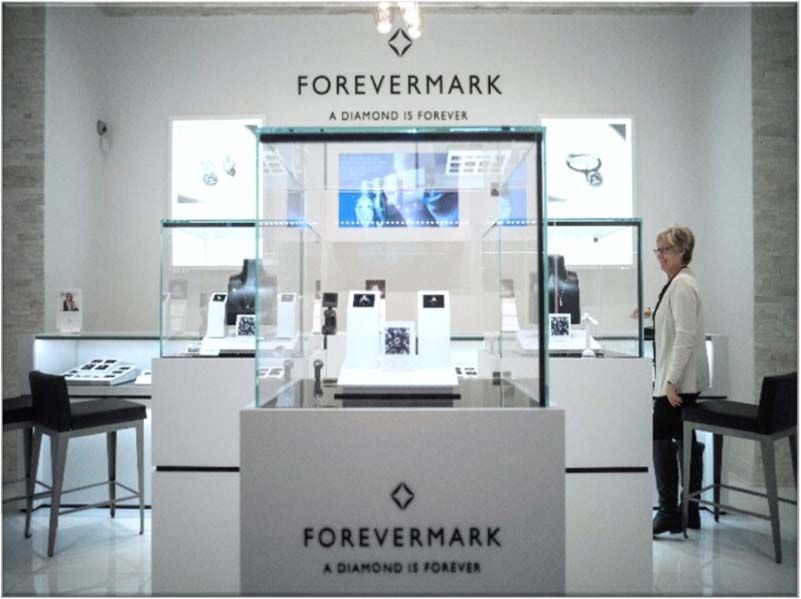
GROUP OVERVIEW
DE BEERS GROUP OVERVIEW

Ownership structure

                                        Anglo American (85%)                                                                     Government of the Republic of Botswana (15%)

                                                                                                De Beers Group

Operations                                                                                                                        Rough diamond sales             Brands / retail /
Exploration           Production                                                                                                                                  support services
                      Mining                                                                              Supermaterials

                                                  De Beers                                                     Element Six
                                                                        Debswana                                                       Global
     Global                                     Consolidated                             Namdeb               Technologies                                                              De Beers
                            Canada                                      Diamond                                                     Sightholder   Auction Sales     Forevermark
  Exploration(1)                                Mines (South                             Holdings                                                                                      Jewellers(2)
                                                                        Company                                                        Sales
                                                   Africa)                                                     Element Six
                                                                                                                Abrasives
                                                                                         Namdeb
                                                                                                                                    Sightholder                                        Debmarine
                                                                                         Diamond                                                                   Technologies
                             Victor                Venetia               Jwaneng                                                    Sales South                                        South Africa
                                                                                        Corporation
                                                                                                                                       Africa
                                                                                          (land)

                                                                                        Debmarine
                                                                           Orapa                                                       DTC
                         Gahcho Kué              Voorspoed                               Namibia
                                                                          Regime                                                     Botswana                         Wholly-owned or controlled
                                                                                         (marine)
                                                                                                                                                                      subsidiaries and divisions

                                                                                                                                                                      Joint Ventures
                                                                                                                                    Namibia DTC
(1) Exploration is undertaken through a number of controlled subsidiaries of De Beers
(2) De Beers Jewellers is a wholly owned subsidiary as of 20 March 2017

                                                                                                                                                                                                      9
                                                                                               The De Beers Group of Companies
LEGAL, ECONOMIC AND ACCOUNTING INTERESTS
Consolidation Business Legal Economic Account.
type
• Canada (excl. Gahcho Kué)
• Global Sightholder Sales
• Auction Sales
• Forevermark
100%
• E6 – Technologies
Subsidiaries • Technologies
• Debmarine South Africa
• De Beers Jewellers(1)
• DBCM(2) 74% 74% 100%
• Sightholder Sales South Africa(2) 74% 74% 100%
• E6 – Abrasives 60% 60% 100%
• Debmarine Namibia
• Namdeb (land)
50%
• DTC Botswana
Joint ventures • Namibia DTC
• Debswana 50% 19.2%(3) 19.2%(3)
• Gahcho Kué 51% 51% 51%
(1) De Beers Jewellers is a wholly owned subsidiary as of 20 March 2017
(2) For DBCM and Sightholder Sales South Africa, our BEE partner Ponahalo, owns a 26% interest, however, due to the arrangement in place it is consolidated with no minorities;
as such, Ponahalo net debt related to the acquisition of the 26% interest is on the De Beers balance sheet
(3) % interest applies to pre-tax profits
10
The De Beers Group of CompaniesFLOW OF DIAMOND VOLUMES Owned
3rd
Party
JVs
Namdeb Canada
Mining Debswana DBCM Victor Gahcho
Holdings Kué
10% 49% - Gahcho Kué
Revenue / Mountain
100% 100% 90% SDT(3)
volume Province
Trading DTCB JV NDTC JV DBSSSA 100% Victor
(50%) (50%) 51% Gahcho Kué
15% 15%
Revenue / 85% ODC(1) 85% Namdia(2)
volume
GSS (100%); ~10% onward sold to Auction Sales (100%)
Consol. revenue 92.5% 100% 100% Victor
/ volumes Only 50% of the 15% sales to ODC / Namdia consolidated 10% SDT, consolidated 51% Gahcho Kué
EBITDA Typically 6-8% trading margin on consolidated revenues
(1) Okavango Diamond Company (ODC) – wholly owned by GRB – has the right to 15% of Debswana run of mine production
(2) Namib Desert Diamonds Ltd (Namdia) – wholly owned by GRN – has the right to 15% of Namdeb Holdings run of mine production
(3) DBCM sells or offers 10% of run of mine production to the State Diamond Trader, in terms of SA diamond legislation
11
The De Beers Group of CompaniesTRADING EBITDA MARGIN - MODEL AT 6 - 8% ON AVERAGE
Value through aggregation, allowing for a more Historic analysis of EBITDA margins: average 6-8% but
consistent offering (volume and mix) impacted by changes in rough prices & mix
Trading EBITDA margin (%) Rough diamond revenue ($bn)
8.9%
6.8%
5.8 6.5
6.0%
5.6
4.1
2.6%
• Debswana until 2020
Marketing
• Namdeb Holdings in place until 2026
arrangement 2013 2014 2015 2016
• South Africa and Canada perpetual
12
The De Beers Group of CompaniesDE BEERS PORTFOLIO DIVERSITY AND FLEXIBILITY
Diverse portfolio with breadth in mix of production … … and flexibility in supply to meet demand
Average price & production 2016 (excluding Gahcho Kué) Production value Production volume (Mct) and value ($/ct)
Group $178/ct(2) $170/ct(3)
Voorspoed Average
Price 27Mct 31-33Mct
DBCM Venetia
De Beers
Canada Gahcho Kue Victor
Other
Gahcho
Namdeb Kué(1)
Holdings Debmarine Namibia Debmarine
Namibia
Namdeb (land) Venetia
Debswana
Orapa Jwaneng
Debswana
2016 Pro forma 2016 inc. full 2017 guidance
0 50 100 150 200 250 400 450 500 550 600 Gahcho Kué ramp up
(1) 100% basis except for the Gahcho Kué joint venture, which is on an attributable 51% basis
2016 Average price (100% selling value post aggregation; $/ct) (2) Achieved price based on sales mix of $187/ct. Price based on total production mix $178/ct
(3) Calculated using 2016 index
13
The De Beers Group of CompaniesDE BEERS REVENUE AND PRODUCTION
Revenue impacted by consumer demand … and production adjusted to meet
… with lower sales volumes …
and midstream destocking … demand, now returning to previous levels
De Beers rough diamond consolidated revenue ($bn) Total rough diamond sales volumes Total rough diamond production (Mct)
(incl. 100% DTCB and NDTC) (Mct)
-37% -40% +55% Guidance
+37%
6.5 34.4 32.0 31.2 32.6 31 - 33
5.8 5.6 29.8 28.7 27.3
4.1 20.6
2013 2014 2015 2016 2013 2014 2015 2016 2013 2014 2015 2016 2017
Lower rough prices to support a recovery, with flexibility in
De Beers average price above other rough producers
the mix of production
$/ct 207 Average achieved price ($/ct) Consolidated sales volume (Mct)
198 9 (9) 198 200 50
25 (26) 187
(16) 150 40
6
30
100
20
50 10
0 0
2013 Index Mix 2014 Index Mix 2015 Index Mix 2016 DB P1 P2 Avg.* P3 DB P1 P2 P3
14
The De Beers Group of CompaniesMODELLING CHANGES TO DE BEERS INVENTORY LEVELS
In value terms, 2015 inventory build was eliminated in … although India demonetisation impacted destocking of
2016 … lower value goods in late 2016 (completed in H1 2017)
$bn, restated to 2016 price index Mct
Production Total external gem sales
+1.1 +1.8
+0.1 +4.7
-0.1 -1.4
-1.2 -8.1
6.0 34.4
5.4 5.4 31.2 29.8 32.6 32.0 +3.9
5.1 5.0 4.9 4.9 28.7
+0.4 27.3
3.7 20.6 20.0
3.0 16.1
2.6
2013 2014 2015 2016 H1 2017 2013 2014 2015 2016 H1 2017
• Inventories held at the lower of cost or net realisable value:
• Equity production held at mined cost (average cost per mine)
• Non-equity production held at purchase cost (69%(1) of Debswana volumes; 43%(2) of Namdeb Holdings volumes)
• Typical inventory levels: GSS – ~1.5x value of average Sight; Mining - ~3 month production (to sort and value)
(1) Based on the purchase of 85% of 80.8% of JV partner’s share of production
(2) Based on the purchase of 85% of 50% of JV partner’s share of production
15
The De Beers Group of CompaniesCONTRIBUTION BY BUSINESS
EBITDA contribution by business Key components contributing to segments
$m
604
1,818 Debswana 379
571 80%
344
DBCM 282
Trading 579 268
44%
1,406 Upstream
207
Namdeb 147 40%
378 184
990 178
Canada 154
107 79
28% 55%(1)
579
Midstream Trading 107
378
7%
Upstream 1,333
1,102 (100)
962 Marketing (120)
(120)
92 2016 EBTIDA
Downstream Element Six 56 Margin
/ Other 50 2014
(79) (74) 2015
Downstream (94)
Other (15) 2016
Other 2014 2015 2016 (4)
(1) Excluding Snap Lake care and maintenance
16
The De Beers Group of CompaniesGROUP AND UPSTREAM EBITDA MARGINS
Group EBITDA blended margin % Consolidation of Group EBITDA margin
2016 EBITDA margin
23%
23% 54%
21%
7%
-1%
Upstream Trading Downstream
& Other
2016
2015 2016 Weighting (based on total revenue)
~30% 100% 100%
Upstream margin analysis
2016 Upstream EBITDA margin by BU Upstream EBITDA margin
Excl. Snap Lake care Excl. Snap Lake care
80% and maintenance 58% and maintenance
54%
55%
40% 44%
28% 54%
Debswana Namdeb DBCM Canada
Weighting (based on revenue x economic ownership)
~35% ~20% ~30% ~15%
2015 2016
17
The De Beers Group of CompaniesTAXATION
De Beers tax rate by jurisdiction Results in a group effective tax rate of 23%(3)
2016 Royalties Income tax
South Africa(1) Formulae based 28%
23% 23%
Canada (1,2) Formulae based 26%
Botswana: DTCB & DBGSS n/a 22%
Botswana: Debswana 0% 0%
Namibia 10% Turnover 55%
Note: In 2016 Debswana paid $0.9bn in local statutory taxes, including withholding taxes, and royalties 2015 2016
(1) Accelerated tax allowances for capital projects in place
(2) Tax losses available to offset against future income
(3) Debswana reflected at zero %
18
The De Beers Group of CompaniesSALES SEASONALITY
Jewellery sales driven by Q4 holidays, principally in the US . . . Rough sales are reported every cycle and drive total revenue
% diamond jewellery sales by quarter
~30% Provisional cycle revenue is reported after GSS Sight week and includes
auctions since the previous GSS Sight
~20% ~20% ~20%
2016 $m
Cycle 1 545
Q1 Q2 Q3 Q4 Cycle 2 617
Cycle 3 666
Typical pipeline Cycle 4 636
Cutting & Polishing Jewellery manufacturing / retail Cycle 5 564
~2-3 months ~7-8 months Cycle 6 528
Cycle 7 639
Cycle 8 494
. . . resulting in rough sales usually weighted to H1
Cycle 9 476
% H1/2 split of gem consol. sales Cycle 10 422 Plus parters' 50%
Total external
Total 5,587 share of revenue
100% 100% 100% 100% (1) gem sales
Timing differences 31 in JVs & Other
34% Gem consol sales 5,618 353 5,971
H2 48% 46% 46% Element Six 314
Other 136
66% Total De Beers
52% 54% 54% 6,068
H1 revenue
2013 2014 2015 2016
(1) Timing differences relate to sales by Auctions Sales or DTCB which occur post Cycle 10 but before 31 December and are reported in Cycle 1 of the following year
19
The De Beers Group of CompaniesPRESS RELEASE DISCLOSURE
Press release disclosure: Six months ended 30 June 2017: Reconciliation
Applied 7% to all operations in line with 6-8%
guidance; actual trading margins vary by region
Key performance indicators(1)
Production Realised price P&L cash cost Margin per carat Proxy EBITDA and comparison
n Adj. Less Add Proxy Proxy
Prod P&L cash Adj. P&L Margin EBITDA
Excl. GK product. Price trading Adj. price royalties / Margin % EBITDA % Interest EBITDA Variance
volume cost cash cost per carat reported
Volume margin GK adj. (100%) (propcon)
kct kct kct $/ct(3) $/ct $/ct $/ct(4) $/ct $/ct $/ct % $m % $m $m $m
De Beers 16,142 16,142 156 63 63 785
Debswana 11,124 11,124 165 (12) 153 26 26 127 77% 1,418 19.2% 272 272 0
Namdeb Holdings 863 863 568 (40) 528 237 53 290 238 42% 206 50% 103 105 (2)
South Africa 2,511 2,511 133 (9) 124 64 4 68 56 42% 141 100% 141 127 14
Canada(8) *
* 1,644 (1,273) 371 435 (30) 405 67 110 177 228 52% 84 100% 84 69 15
Trading – – – – – – – – – 281
Other(6) – – – – – – – – – (69)
* For Canada, price excludes Gahcho Kué contribution, as all profits arising from Gahcho Kué related to pre-commercial production were capitalised. Unit costs include Gahcho Kué contribution following
achievement of commercial production on 2 March 2017. As a result, for the production x margin calculation, Gahcho Kué production has been excluded
Note: For footnotes please refer to the Anglo American Press release for the six months ended 30 June 2017
20
The De Beers Group of CompaniesBASIC MODEL FLOW
1
ESTABLISH YEAR 1 DEMAND
2
ESTIMATE FORECAST DEMAND (MARKET FUNDAMENTALS)
3
EMBED STRUCTURAL AND PRICE CHANGES
4
USE PRODUCTION FLEXIBILITY TO DELIVER PRODUCTION GUIDANCE
5
DETERMINE STOCK MOVEMENT TO MEET FORECAST DEMAND
6
APPLY MARGINS TO CALCULATE UPSTREAM AND TRADING EBITDA
7
FOLLOW GUIDANCE ON DOWNSTREAM SPEND / E6 TO ARRIVE AT TOTAL
21
The De Beers Group of CompaniesQUESTIONS
UPSTREAM
UPSTREAM MODELLING
Summary of mines and data provided Modelling of production costs
Granular operational information to model costs presented High level disclosures Calculations
Debmarine
Jwaneng Orapa Production Tonnes
Namibia
(carats) ÷ Grade
x100 treated
Venetia Gahcho Kué
Waste Stripping
mined ratio × Ore mined
Press release data as currently provided (sum with
ore mined)
Namdeb Total tonnes $/t mining Total mining
Victor Voorspoed
(land) mined × cost costs
(add other
costs)
Total cash
costs
24
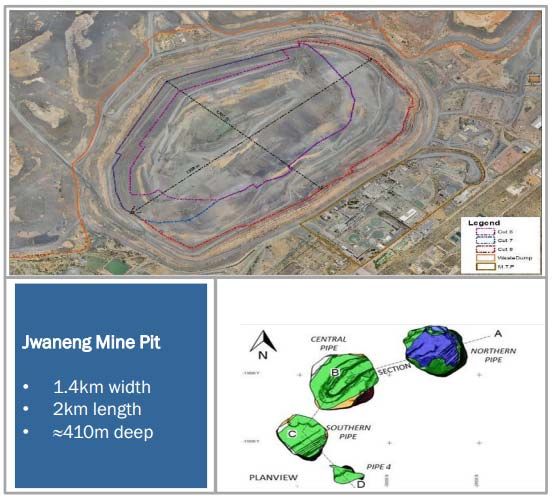
The De Beers Group of CompaniesJWANENG MINE - OVERVIEW
Plan view of Jwaneng pit Key mine information
• Life of mine (LOM): 2034
• Probable Diamond Reserve Estimates (Open
Pit): 139Mct; 130cpht(2); 106Mt
Reserves & • Mining licence: 2029
Resources(1) • Exclusive Diamond Resource Estimates(3)
(Open Pit):
• Indicated: 106Mct; 93cpht; 114Mt
• Inferred (ex. LOM Plan)(4): 64Mct;
83cpht; 77Mt
Cut 6
Cut 7 Cuts 6 & 7 • Current source of ore mining
Cut 8
• Cut 8 waste of ~700Mt in total
• ~500Mt of waste has been mined; First ore
extracted and processed in June 2017
Cut 8 • Expected to become the main source of ore
during 2018
• Approximately 84Mt material to be treated
containing an est. 93Mct (~110cpht)
• Further life extension opportunities exist
Projects • Cut 9 – Pre-feasibility stage
(1) For further information, see Anglo American Ore Reserves and Mineral Resources Report (2016) • Cut 10 vs. Underground - Concept study
(2) Grade (cpht / cpm2) - Carats per hundred metric tonnes / carats per square metre in progress
(3) Diamond Resources are reported as additional to Diamond Reserves
(4) Due to the uncertainty that may be attached to some Inferred Diamond Resources, it cannot be assumed that all or part of an Inferred Diamond Resource will necessarily be upgraded to an Indicated or
Measured Diamond Resource after continued exploration
25
The De Beers Group of CompaniesJWANENG MINE – PRODUCTION CHARACTERISTICS
Significant flexibility in mix and grade across Evolution of stripping activity
pipes and tailings
2016 = Jwaneng average = Production volume = Production volume trend • Cut 8 waste of ~700Mt in total
Higher • ~500Mt of waste was mined before first ore, which was
extracted and processed in June 2017
South
• Cut 8 will become the main source of ore from 2018
North Centre • Average Cut 8 stripping ratio from 2018 of 2.5
Price
Tailings Average • From 2017, ~20Mt of waste remaining at Cut 7 with an
$198/ct(1) average stripping ratio of ~1 to end of life in 2024
150 cpht
Lower
Lower Grade Higher Evolution of ore mining by Cut
Portfolio • Grade trending downwards ~20% as 100% 100% 100%
(dependent on
trading conditions) ore source changes Cut 8 20%
40%
60%
Main treatment • Incremental capacity available to offset
plant grade impact
Cut 7 80%
60%
Modular tailings • Capacity of 2Mt or ~900kct, utilisation 40%
treatment plant subject to trading conditions
2017 2018 2019
(1) Price based on 100% selling value post aggregation at 2016 mix and price index
26
The De Beers Group of CompaniesJWANENG MINE – EBITDA MARGIN & OTHER KPIS
Price, cost and EBITDA margin Key performance indicators
$/ct
2015 2016
Price(1) 242
Waste mined Mt 109.8 109.4
Ore mined Mt 7.7 9.5
198
Tonnes treated Mt 7.6 8.0
Carats recovered Mct 9.8 12.0
Proxy Average grade cpht 128 150
215
EBITDA
(89%) Price(1) $/ct 242 198
margin(1) 177
(89%) Total cash cost(3) $/ct 49 38
Mining cash cost(4) $/t 2.8 2.6
P&L cash
costs(2) 27 21
2015 2016
(1) Price is based on 100% selling value post aggregation of goods. EBITDA margin is a proxy measure as it includes both mining and trading margin and is calculated using a unit cost of production as defined
(2) P&L cash costs = mining, treatment, support services, other costs, excludes depreciation and royalties ÷carats recovered
(3) Total cash costs = P&L cash costs plus the cost of waste which is capitalised, excludes SIB capex ÷carats recovered
(4) Mining cash costs = production costs related to mining activities (before any waste costs are capitalised) ÷ tonnes mined (waste + ore tonnes)
27
The De Beers Group of CompaniesJWANENG MINE – LINKING MINING AND PRODUCTION TO CASH COSTS
2016
Truck and haul Mining cash Total mining Mining cash
Loading cycle (mins) cost(1) $/t (Mt) costs ($m)
Shovels (t/hr) Average tyre life (hours)
+10% +17%
-17% 2.6 ~120 ~300
1,672 5,787 4.2
1,514 4,940 3.5 Treatment /
support
costs /
other
Main treatment
plant
2015 2016 2015 2016 2015 2016 ~160
Modular tailings
Plant treatment plant
Histogram Dec15 – Sep16
Mean
Target
100
80
Days 38.2 12 ~460
60
40
20
Total cash Total production Total cash
costs(2) $/ct (Mct) costs ($m)
0
Source: De Beers Group internal analysis
(1) Mining cash costs = production costs related to mining activities (before any waste costs are capitalised) ÷ tonnes mined (waste + ore tonnes)
(2) Total cash costs = mining, treatment, support services, other costs, also includes the cost of waste which is capitalised, excludes depreciation and SIB capex ÷carats recovered
28
The De Beers Group of CompaniesORAPA REGIME - OVERVIEW
Plan view of Orapa mine pit & plant Key mine information
• Life of mine (LOM): 2030
• Probable Diamond Reserve Estimates
(Open Pit): 145Mct; 92cpht(2); 157Mt
Orapa Mine • Mining licence: 2029
Reserves & • Exclusive Diamond Resource Estimates
Resources(1) (Open Pit)(3)
• Indicated: 299Mct; 101cpht; 295Mt
• Inferred (ex-LOM plan)(4): 59Mct;
86cpht; 68Mt
• Current source of ore mining
Orapa Mine – • Plant 1 placed on partial care and
Cut 2 maintenance 1 Jan 2016; ramped up in H1
2017
• Transitions to processing tailings in 2017,
Letlhakane plant commissioning Q2-Q3 2017
Tailings • Life of tailings mineral resource to 2041
• Capacity of 3.6Mt per annum at 900kct
• Placed on care and maintenance 1 Jan
Damtshaa 2016
Mine • Re-commissioning anticipated in Q4 2017
South pipe North pipe for full year’s production in 2018
Projects • Orapa Mine – Cut 3 in pre-feasibility stage
(1-4) Refer to footnotes on slide 25
29
The De Beers Group of CompaniesORAPA REGIME – PRODUCTION CHARACTERISTICS
Production has fallen since 2014 due to trading conditions Average price and grade levels aligned to Orapa mine
2016 = Orapa Regime = Production size = Future source of production
Orapa Plant 1 on partial C&M; ramped up in H1 2017
Damtshaa to be recommissioned in Q4 2017 following period of C&M Higher
Mct
Letlhakane
12.9 Capacity (primary ore)
Damtshaa Average
0.3 $97/ct(1)
Letlhakane 0.5
Damtshaa 81cpht
Price
10.6
0.2
0.5 Orapa
8.5
Letlhakane
0.6 (tailings)
Lower
Orapa 12.1
Lower Grade Higher
9.9
7.9
Price Orapa Regime mix decline ~5%
Orapa Regime trending ~20% down
Grade
2014 2015 2016 subject to extent of ramp up
(1) Price based 100% selling value post aggregation at 2016 mix and price index
30
The De Beers Group of CompaniesVENETIA MINE - OVERVIEW
Plan view of Venetia pits Key mine information
North
• Life of mine (LOM): 2046
K03 • Probable Diamond Reserve Estimates (OP &
UG): 96Mct; 85cpht(2); 113Mt
Reserves &
• Mining licence: 2038
Resources
• Exclusive Diamond Resource Estimates (OP &
(OP & UG)(1)
UG)(3):
• Inferred (ex & in-LOM plan)(4): 63Mct;
K02 68cpht; 93Mt
South K01 • Cut 4 is the last operational open pit cut
• Smooth transit to underground key focus area
Waste stripping weighted to the near term Open Pit • Additional Deposits (Stockpile - Mixed
Mt Mine Contact/Ore; Stockpile - Satellite Kimberlite
109 pipes; Red Area Tailings) provide some short
48
6 42 21 term flexibility
Ore
4
29
• $2bn underground extension - $0.2bn p.a. to
4
Waste 42 2019 and $0.2bn to $0.3bn p.a. to 2022
37 87
• Principle source of ore from 2023; full
25
Underground production 2025
• Life of mine to 2046; 94Mct at 71cpht
Remaining 2017 – (132Mt)(5)
2014 2015 2016 January 2017
end of life (2023)
• ~2,000 jobs
(1-4) Refer to footnotes on slide 25
(5) Scheduled Inferred Resource (39.8Mt) constitute 24% (22.5Mct) of the estimated carats. These estimates are scheduled tonnes and carats as per the Life of Mine Plan approved in 2016
31
The De Beers Group of CompaniesDEBMARINE NAMIBIA - OVERVIEW
Crawler schematic Key performance indicators
Mafuta • Probable Diamond Reserve Estimates: 4.3Mct;
Reserves & 0.09cpm2(2); 46 million m2
Resources(1) • Exclusive Diamond Resource Estimates(3):
(Marine • Indicated: 9.1Mct; 0.07cpm2; 131 million m2
Placers) • Inferred (ex & in-LOM plan)(4): 86Mct;
100-140m 0.08cpm2; 1,100 million m2
Water depth
• Mafuta accounts for ~40-50% of total carats
recovered
Key
• Costs substantially fixed in nature
features
• Key variable is inports (dock based maintenance);
Drill ship schematic timed to maintain annual production
Debmar Pacific • Fleet capacity increasing to 1.4Mct with
Debmar Atlantic
transition of Coral Sea to production; as
!Gariep Trends
Grand Banks additional capacity from drill ship, cash cost
Coral Sea(5)(6) returns to 2015 levels
• SS Nujoma (new sampling vessel) became
100-140m operational in H1 2017; total cost of $140m
Water depth
(within budget and ahead of schedule)
Projects
• Medium term project:
− Addition of another crawler-based vessel
(1-4) Refer to footnotes on slide 25 − Attractive project economics
(5) Also used as a sampling vessel; dedicated to mining from 2017
(6) Chartered vessel
32
The De Beers Group of CompaniesGAHCHO KUÉ MINE - OVERVIEW
Gahcho Kué pit and process plant Key information
• Life of mine (LOM): 2028(1)
• Probable Diamond Reserve Estimates (Open Pit): 51Mct;
Reserves & 153cpht(2); 33Mt
• Exclusive Diamond Resource Estimates (Open Pit)(3):
Resources(1) • Indicated: 3.2Mct; 136cpht; 2.3Mt
• Inferred (ex. & in-LOM Plan)(4): 17.9Mct; 139cpht; 12.9Mt
• Average production – ~4.5Mct p/a
• 51/49 JV De Beers / Mountain Province
• Total project spend of C$1bn (100%)
Project • Commercial production achieved on 2 March 2017
details • Production weighted to 1st 7 years (short payback)
• Tuzo Deeps, long term development option (underground,
Gahcho Kué pit and process plant brownfield exploration)
Near term production by pipe Realised price, cost and margin Lobe characteristics vary
$/ct
100% 100% 100% 100% 100% 100% Price(5) ~70-100 Higher
On a fully
5034 ramped up
Proxy EBITDA 5034
~40-65 basis; price
Hearne margin(5)
range
P&L cash depends on Price
Tuzo Tuzo
cost(6) ~30-35 section of Hearne
5034 ~$70-100/ct;
2017 2018 2019 2020 2021 2022 5034 160-200cpht
Lower
Source: De Beers Group internal analysis
(1-4) Refer to footnotes on slide 25 Lower Grade Higher
(5) Price is based on 100% selling value post aggregation of goods. EBITDA margin is a proxy measure as it includes both mining and trading margin and is calculated using a unit cost of production as defined
(6) P&L cash costs = mining, treatment, support services, other costs, excludes depreciation and royalties ÷carats recovered
33
The De Beers Group of CompaniesCAPEX PROFILES
Total capex profile
$m
~700 ~700
Projects
Projects subject to
~525 trading
conditions
295
~0.3bn ~0.2-0.3bn
Stay In Business
~0.1bn VUG
120 ~0.2bn
~0.2bn
Capitalised Waste
110 ~0.1bn ~0.1bn
2014 2015 2016 2017F 2018+ Forecast
34
The De Beers Group of CompaniesDOWNSTREAM
DOWNSTREAM & OTHER

                                                                  EBITDA $m                                                                  2015              2016
                                                                  Industrial synthetic diamonds and                                            57                 50
                                                                  super materials

                                                                  Marketing                                                                 (120)              (120)

                                                                  Other:                                                                      (16)                 6
                                                                  • Forevermark
                                                                  • De Beers Diamond Jewellers
                                                                  • DebTech (technology; sorting and
                                                                     synthetic detection)
                                                                  • International Institute of Diamond
                                                                     Grading & Research
                                                                  • Corporate
                                                                  • Anglo acquisition adjustments(1)

                                                                  Total                                                                       (79)               (74)

(1) Anglo acquisition adjustments principally impact EBIT and relate to depreciation of the purchase price allocation (PPA) of the fair value of assets on the incremental 40% interest acquired by Anglo
American during the 2012 acquisition. Amounts to ~$120m per annum and fluctuates principally due to change in production levels and exchange rates

                                                                                                                                                                                                            36
                                                                                            The De Beers Group of Companies
ELEMENT SIX – SYNTHETIC INDUSTRIAL DIAMONDS
2013-16 Revenue by industry, EBITDA and key products
Revenue ($m)
482
439
• Carbide picks supplied into soft
rock mining and road planing
Other 365 • Carbide wear parts for heavy
industrial applications
314
Mining, Road
& Wear
• Superhard tool tips and grits for
Automotive & machining applications
Aerospace • Supplied to original equipment
manufacturers
Oil & Gas
2013 2014 2015 2016 • PCD cutters supplied to drill bit
2016 manufacturers
EBITDA ($m) 67 92 56 50
Margin (%) 15% 19% 15% 16%
Capex ($m) 33 30 28 13
37
The De Beers Group of CompaniesSUMMARY & QUESTIONS
APPENDIX
OVERVIEW OF GROUP FINANCIAL STRUCTURE

                             Upstream                                                  Trading               Element Six           Downstream
                                                                                                                                       MKT, CORP,
                BOTS         NAM         SA            CAN                             GSS & DBAS                    E6
                                                                                                                                         OTH.

                19.2%                              100%                                                                                  100%
 % Interest                  50%        100%                                                   100%                 100%
                Pre-tax                            / 51%

                                                                Demand driven forecast – industry gem
                                                                              revenue

 Consol.                                                     Impact of cutting centre inventory, 3rd party
 Revenue                                                                                                      Revenue forecast
                                                                  supply – De Beers gem revenue

 Average       Average price impacted by source within
  Price                                                        Impact of production mix / index change
                           each operation

 Consol.      Source of carats determined by production      Impact of GSS and De Beers mine inventory
 Volumes                 capacity / flexibility                                levels

  Global
                      Grossed up for 3rd party sales
 Volumes

                  Upstream volume x average price –                                                            EBITDA margin             Ongoing
 EBITDA                                                                EBITDA margin (6-8% average)
                          production costs                                                                   (15-20% over cycle)       investment

              Investment in new cuts, production capacity                                                    SIB and new product
  CAPEX
                         expansions and SIB                                                                      development

Inventories     Normal pipeline and excess inventories          Normal pipeline and excess inventories         Working capital

                             Section 3                                         Section 1 & 2                               Section 4
                                                                                                                                                40
                                                             The De Beers Group of Companies
JWANENG MINE – EBITDA MARGIN & OTHER KPIS
Price, cost and EBITDA margin Key performance indicators
$/ct
2015 2016
Price(1) 242
Waste mined Mt 109.8 109.4
Ore mined Mt 7.7 9.5
198
Tonnes treated Mt 7.6 8.0
Carats recovered Mct 9.8 12.0
Proxy Average grade cpht 128 150
215
EBITDA
(89%) Price(1) $/ct 242 198
margin(1) 177
(89%) Total cash cost(3) $/ct 49 38
Mining cash cost(4) $/t 2.8 2.6
P&L cash
costs(2) 27 21
2015 2016
(1) Price is based on 100% selling value post aggregation of goods. EBITDA margin is a proxy measure as it includes both mining and trading margin and is calculated using a unit cost of production as defined
(2) P&L cash costs = mining, treatment, support services, other costs, excludes depreciation and royalties ÷carats recovered
(3) Total cash costs = P&L cash costs plus the cost of waste which is capitalised, excludes SIB capex ÷carats recovered
(4) Mining cash costs = production costs related to mining activities (before any waste costs are capitalised) ÷ tonnes mined (waste + ore tonnes)
41
The De Beers Group of CompaniesORAPA REGIME – EBITDA MARGIN & OTHER KPIS
Price, cost and EBITDA margin Key performance indicators
$/ct
Price(1) 113 2015 2016
Waste mined Mt 15.0 7.3
97
Ore mined(3) Mt 16.9 14.4
Tonnes treated Mt 12.9 10.6
Proxy 85 Carats recovered Mct 10.6 8.5
EBITDA (75%) 64
(66%) Average grade cpht 82 80
margin(1)
Price(1) $/ct 113 97
Total cash cost(4) $/ct 30 33
Mining cash cost(5) $/t 3.9 4.5
P&L cash 28 33
costs(2)
2015 2016
(1) Price is based on 100% selling value post aggregation of goods. EBITDA margin is a proxy measure as it includes both mining and trading margin and is calculated using a unit cost of production as defined
(2) P&L cash costs = mining, treatment, support services, other costs, excludes depreciation and royalties ÷carats recovered
(3) Ratio of ore mined to tonnes treated expected to fall to below 100% going forward
(4) Total cash costs = P&L cash costs plus the cost of waste which is capitalised, excludes SIB capex ÷carats recovered
(5) Mining cash costs = production costs related to mining activities (before any waste costs are capitalised) ÷ tonnes mined (waste + ore tonnes)
42
The De Beers Group of CompaniesVENETIA MINE – EBITDA MARGIN & OTHER KPIS
Price, cost and EBITDA margin Key performance indicators
$/ct
140 2015 2016
Price(1)
Waste mined Mt 37.3 25.0
126
Ore mined Mt 4.4 3.9
Proxy Tonnes treated Mt 5.3 4.7
EBITDA 85
(61%) Carats recovered Mct 3.1 3.5
margin(1) 79
(63%) Grade cpht 59 74
Price(1) $/ct 140 126
Total cash cost(3) $/ct 84 63
P&L cash
costs(2) Mining cash cost(4) $/t 3.9 4.3
55
47
2015 2016
(1) Price is based on 100% selling value post aggregation of goods. EBITDA margin is a proxy measure as it includes both mining and trading margin and is calculated using a unit cost of production as defined
(2) P&L cash costs = mining, treatment, support services, other costs, excludes depreciation and royalties ÷carats recovered
(3) Total cash costs = P&L cash costs plus the cost of waste which is capitalised, excludes SIB capex ÷carats recovered
(4) Mining cash costs = production costs related to mining activities (before any waste costs are capitalised) ÷ tonnes mined (waste + ore tonnes)
43
The De Beers Group of CompaniesDEBMARINE NAMIBIA– EBITDA MARGIN & OTHER KPIS
Price, cost and EBITDA margin Key performance indicators
$/ct
Price(1) 566 2015 2016
528
Area mined Million m2 12.0 12.0
Carats recovered Mct 1.3 1.2
Proxy Average Grade cpm2 0.1 0.1
364
EBITDA (64%) 337 Price(1) $/ct 566 528
margin(1) (64%)
Total cash cost(3) $/ct 202 191
P&L cash
costs(2)
202 191
2015 2016
(1) Price is based on 100% selling value post aggregation of goods. EBITDA margin is a proxy measure as it includes both mining and trading margin and is calculated using a unit cost of production as defined
(2) P&L cash costs = mining, treatment, support services, other costs, excludes depreciation and royalties ÷carats recovered
(3) Total cash costs = P&L cash costs plus the cost of waste which is capitalised, excludes SIB capex ÷carats recovered
44
The De Beers Group of CompaniesVICTOR, VOORSPOED AND NAMDEB (LAND)
2016 # Victor Voorspoed Namdeb (land)
Life of mine Years 3 4 Varies by operation
Production kct 596 649 403
Price(1) $/ct 443 122 529
P&L cash cost(2) $/ct 212 80 400
Proxy EBITDA margin % 52% 34% 24%
Total cash cost(3) $/ct 212 98 400
Victor Voorspoed Namdeb (land)
(1) Price is based on 100% selling value post aggregation of goods. As a result, EBITDA margin includes both mining and trading margin. This is a proxy EBITDA measure
(2) P&L cash costs = mining, treatment, support services, other costs, excludes depreciation ÷carats recovered
(3) Total cash costs = P&L cash costs plus the cost of waste which is capitalised, excludes SIB capex ÷carats recovered
45
The De Beers Group of CompaniesYou can also read