Role of Behavioral Finance in stock market price movementswith special reference to stocks of D SIBs in India - IJCRT
←
→
Page content transcription
If your browser does not render page correctly, please read the page content below
www.ijcrt.org                                      © 2021 IJCRT | Volume 9, Issue 3 March 2021 | ISSN: 2320-2882

   Role of Behavioral Finance in stock market price
   movements- with special reference to stocks of D
                    SIBs in India
                                        Dr. M. Thamizhselvi
                          Assistant Professor, NSB ACADEMY, Bangalore

ABSTRACT
Behavioral finance is the study of the influence of psychology on the behavior of investors or financial analysts.
It is a psychological effect on investment decisions (Shefrin, 2001). According to conventional financial theory,
the world and its participants are, for the most part, cogent "wealth maximizers". However, there are many
instances where emotion and psychology influence our decisions, causing us to behave in unpredictable or
irrational ways. Investors' enthusiasm that drives the assets higher than that those justify is called as irrational
exuberance. The key objective of this research is to analyze the stock price increase or decrease in a year and its
correlation with investor’s behavior. The study also focuses to find out whether irrational exuberance is another
reason for price rise of stocks. To narrow down this study, the three Domestic Systemically Important Banks (D-
SIBs) in India SBI, HDFC, and ICICI are chosen. Prior five years stock data are collected and graphed using
moving average method to analyze the relationship between investors’ behavior and stock price. The study also
focuses to learn the magnitude of behavioral finance, which is very imperative concept, should be focused by
every company, financial institutions, and trading companies.

Introduction
Behavioral Finance
The idea of behavioral finance has gone through many change and improvement. Coordinated investigation of
social money starts from crafted by Daniel Kahneman and Amos Tversky (1973) where they interestingly banter
about the different heuristics affecting speculation choices. They are the organizer of well-known Prospect
hypothesis in Tversky and Kahneman (1979). They found that people react distinctively as per the circumstances
with regards to misfortunes or gains, and they are more worried about the misfortunes than the same additions.
Statman Meir (2009), an educator from Santa Clara University put down in an article gave in the Wall Street
Journal that the dominant part financial backers were sharp individuals, neither silly nor crazy. However,
Behavioral money expresses that human minds are frequently full and the feelings which flood tends us to act
keen now and again and dumb at others. Conduct account is a nearly new field that looks to joint social and
intellectual mental hypothesis with traditionalist financial aspects and money to offer clarifications for why
individuals settle on irrational money related choices. With regards to cash, even the most pertinent individuals
can be convinced by inclination and opinion. Social account applies brain research to clarify why financial
backers settle on shocking monetary choices.

      IJCRT2103684       International Journal of Creative Research Thoughts (IJCRT) www.ijcrt.org      5803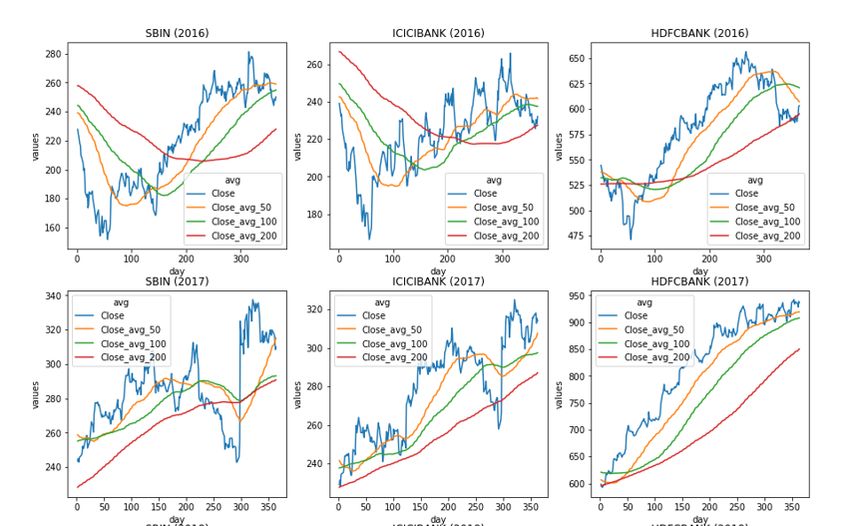
www.ijcrt.org                                     © 2021 IJCRT | Volume 9, Issue 3 March 2021 | ISSN: 2320-2882

In the middle of sensitive market instability, financial advisors will require to focus on behavioral facets of
wealth management and widen a better perceptive of how biases can blow clients’ savings decisions.
Incorporating behavioral finance into their run through is a solution to enhancing the client experience, intensify
the relationships, keep hold of clients and potentially convey better outcomes.

Review of Literature
Conduct account with its source in the mental investigation of human dynamic, it takes into examination diverse
mental predispositions that human has. These predispositions ultimately lead to silly choices. Social money
considers the speculations dependent on the brain science to explain the abnormalities in the monetary business
sectors. Conduct account is only to see what brain science means for the venture dynamic (Shefrin, 2001). The
example of venture or the social factor that influence the speculation incorporate dread, love, eagerness,
hopefulness, and crowd nature (Fischer and Gerhardt, 2007). Aside from the elements, it is additionally
influenced by the feeling, carelessness, under certainty, securities exchange bubble, and so forth an examination
explored the presence of conduct inclinations and their impact on venture execution in Amman Stock Exchange.
This examination zeroed in on presumptuousness, commonality, misfortune revulsion, attitude, accessibility,
affirmation, and crowding inclination (Alrabadi et al., 2017).
Chuang & Lee (2006) found that overconfidence makes investors overweigh their own private information at
the expense of ignoring publicly available information, and they justified their research by studying other
academic’ research and studies to prove that overconfident investors mistakenly attribute market gains to their
own ability to pick winning stocks. The view of Phung (2004) was that overconfident individuals overestimate
or exaggerate their ability to successfully perform a particular task.
The current research study is focused to bring out the buying and selling decisions of invertors. Islam (2012) was
more specific in explaining behavioral finance by emphasizing the buying and selling decisions concerning stock
market investors. According to Gachter et al. (2010) behavioral finance is the enhanced perceptive of the
investment decisions that influence market prices which relay to human and social cognitive and emotional
biases. Ritter (2003) also cleared that, behavioral factors disturbing individuals' decision-making are called as
behavioral finance. As per Appiah & McMahon (2002) research study, behavioral finance is the learning of how
financial practitioners act and interrelate on financial information and the succeeding effect on markets.
At the point when an individual, take part in the capital business sectors and he/she are helpless against the
individual and market practices that control the results of their choices. Target speculation choices include
shaping assumptions regarding what will occur, making taught surmises by social event however much data as
could be expected and utilizing it as could really be expected. Pompain (2006) contended that social account
handles the conduct factors that influence monetary choices.

Need for the study
Financial investors are human, and hence the tendency to make sentimental decisions or biased investment
decisions are always possible. A thorough understanding of psychological or sentimental aspects that influence
investor’s decisions to behavioral biases can assist the financial institutions or companies to make their moves
better.
Nature of human is overly complex, and study on financial behavior involves emotional, cognitive, and
psychological factors in decision making process. Though thousands of studies had confirmed investor’s
decision-making process is completely irrational in terms of investment, studying the behavior will help the
financial institutions or companies to differentiate expectations of a rational behavior and actual behavior.

      IJCRT2103684      International Journal of Creative Research Thoughts (IJCRT) www.ijcrt.org      5804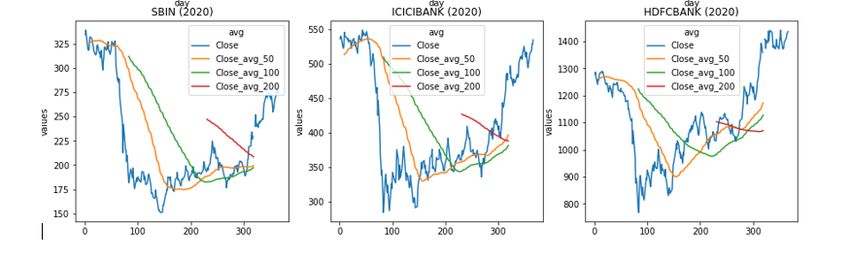
www.ijcrt.org                                       © 2021 IJCRT | Volume 9, Issue 3 March 2021 | ISSN: 2320-2882

Scope of the study
As the objective of this study revolves around investors buying and selling behavior of stocks, the research would
be beneficial if it is made on especially important companies in India. The focus and hypothesis of this study is
to find out whether investors buying and selling pattern of stock can change the stock price. For this study,
Domestic systematically important banks (D-SIBs) in India were chosen. SBI, ICICI Bank, and HDFC banks
are proceeding to be recognized as Domestic Systemically significant Banks, under the equivalent bucketing
structure as in the 2019 rundown of D-SIBs. The Reserve Bank of India has held SBI, ICICI Bank and HDFC
Bank as Domestic Systemically significant Banks that are considered as "too enormous to come up short". They
are sorted dependent on the size, Cross-jurisdictional exercises, intricacy, absence of substitutability and
interconnectedness. The discernment 'Too large to Fail (TBTF)' assumes for government support for these banks
at the hour of pain. SIBs are subjected to additional policy measures to deal with the systemic risks and moral
hazard issues created by them. Fundamental danger can be characterized as the danger related with the
breakdown or disappointment of an organization, industry, monetary establishment, or a whole economy. This
is the significant explanation for choosing the three banks with the end goal of the examination. Knowing the
importance of these banks for the Indian economy created an urge to study about the stock behavior of these
banks. While analyzing many interesting major facts could be plotted this led us to study the investor behavior
regarding purchase and selling of stocks. The confused disappointment of these banks can possibly make critical
interruption the fundamental administrations they give to Indian Banking framework, and thus, to the in general
financial movement.

Objective of the Study
As the focus of the study is to analyze the behavior of the investors with regards to purchase and sale of stocks,
the objective of this research is narrowed as under
  I.     To analyze and understand the behavioral pattern of investors while buying and selling of stocks with
        special reference to stocks of SIFIs in India.
 II.     To find out the relationship exist between behavioral finance and stock price increase and decrease.

Behavioral Finance and Investment Strategies

If we analyze the factors affecting stock market move invariably in one or the other directions, the reason
discovered may include economic data, geopolitical events, and stock market sentiments. For example, the tech
stock collides in the early 2000s was the outcome of a bubble in dotcom stocks as investors were euphoric about
the market and speculated irrationally. If investors over leverage their investments, there is a substantial risk that
there could be a descending spiral if the market budges in an objectionable direction. Investors may be enforced
to sell a stock, which impels prices down.
Majority of the people or investors know market price moves upward and downward because of buying and
selling pattern. But the clear understanding of buying and selling causing market price movement is missing.
Behavioral finance efforts to clarify and amplify the indulgent of the reckoning patterns of investors, including
the emotional processes occupied and degree to which they influence the decision-making processes.
Fundamentally, Behavioral finance attempts to explain what, why, and how of finance and investing, from a
human perspective. For example, behavioral fiancé studies financial markets as well as providing explanations
to many stock market anomalies (such as the January effect), speculative market bubbles and crashes. There
have been substantial discussions over the real meaning and soundness of behavioral finance since the field itself
is still developing and refining itself. This evolution continues to occur because several scholars have such a
varied and extensive range of intellectual and expert specialties.
       IJCRT2103684      International Journal of Creative Research Thoughts (IJCRT) www.ijcrt.org        5805
www.ijcrt.org © 2021 IJCRT | Volume 9, Issue 3 March 2021 | ISSN: 2320-2882
Methodology and Limitation of the study
This study used both quantitative and qualitative methods of analysis. The analysis was purely based on
secondary data available with respect to each bank. The data collected were analyzed using moving average
method and connected with behavioral finance to find out any possible relationship exist with the stock price
movements and investors behaviors. As the study is not focusing on stock price fluctuation, this would be
considered as the limitation of the study. And this would lead to further scope for future research.
Analysis- Results and Discussions
For investors, finding a stock which would be feasible and lucrative to purchase can be amusing as well as
rewarding activity. The purchase would be profitable provided the stock price tend to increase over a period. But
which is the right time to buy the share? When we buy share for investment purposes, then knowing appropriate
time to sell the stock would be easier. But sometimes selling the stock may be because of some other reasons
like when the buy was mistake, the price had unimaginably risen, or the current price is not favorable. Emotion
and human psychology can get in way of making a smart decision. This research paper’s focus is also the same.
Shefrin (2001) describes acceleration bias, which grounds investors to put more money into a failure that they
feel responsible for rather than into a success. This leads to the comparatively well-liked investor’s practice of
averaging down on an investment that has rejected in value since the initial buy rather than regard as selling the
stock if it was a blunder.
Analysis on Stock Price Movement on SBI, ICICI, HDFC
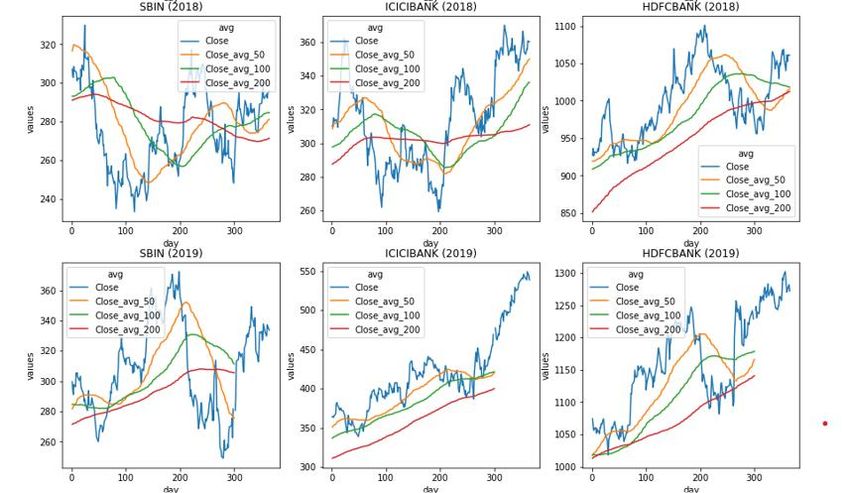
Based on the moving average method the price movement of stocks are plotted as graph. X axis represents the
number of days, while Y axis denotes the stock price. Blue line indicates the movement of closing price for each
day. Orange line indicates the moving average price for 50 days, similarly green line for 100 days average and
red for 200 days average.
IJCRT2103684 International Journal of Creative Research Thoughts (IJCRT) www.ijcrt.org 5806www.ijcrt.org © 2021 IJCRT | Volume 9, Issue 3 March 2021 | ISSN: 2320-2882
Analysis I: YEAR 2016
When we closely observe the charts for 2016, we can clearly understand that around 60th day the share price of
SBI has gone down. It went below Rs 160. And gradually it was increasing. The highest price hits on 300th day.
The chart of ICICI also depicts similar effect. The price of stock went exceptionally low, i.e., below Rs 180
around 60th day and the peak price reached after 300th day. While looking into the chart of HDFC, we can learn
the similar effect around February end, decrease in price below 475 and peak rate of the stock can be pointed out
with slight variation compared to other two banks. HDFC had reached its peak rate before 300 th day itself. 50th
day, 100th day and 200th day moving average of SBI and ICICI shows similar change regarding stock price
movements. Same variation can be spotted with HDFC, although there is huge difference in their stock price.
Analysis II: YEAR 2017
The entire three banks stock price was least at the beginning of the year and steadily it was rising. We can spot
sudden fall in stock price around 300th day for both SBI and ICICI and immediately after the downfall, it was
increasing with some fluctuation. Though there was no noticeable downfall in stock price of HDFC Bank in
2017, the 200th day moving average curve shows the similar effect as the other two banks. If we observe closely,
a noticeable downfall on 300th day of the stock price of HDFC can be seen just like other banks.
Analysis II: YEAR 2018
In the year 2018, we can note that a steep increase in stock price even before 50th day for all the three banks and
slowly it will be decreasing. A downfall in stock price while nearing 100th day also is visible seen for all the
three banks. Although the stock price was increasing from 200th day, again a downfall in stocks around 300th day
is also noticeable. After 300th day, moving average shows increase in stock price. The price of the stocks of
different banks may be different in different days but the stock price variations observed will be similar. We can
see noticeable similarity will ICICI and SBI as the price of these banks are quite same like with starting price
RS 240 and Rs 260, respectively. Whereas the price of HDFC is RS 850 and thus the moving average chart looks
slight difference but when we observe the variations closely it will also be commensurate with other two banks.
IJCRT2103684 International Journal of Creative Research Thoughts (IJCRT) www.ijcrt.org 5807www.ijcrt.org © 2021 IJCRT | Volume 9, Issue 3 March 2021 | ISSN: 2320-2882
Analysis II: YEAR 2019
In 2019, the stock price of SBI and ICICI has started above Rs 300. HDFC s price was above 1050 in the
beginning of the year. Though there are variations in the middle of the year, like any other years, in 2019 also
the stock price was less around 60th day and hits the maximum over 300th day. 50th and 100th day moving average
would give us clear picture of similarity in the movement of price among all the banks than daily variations.
Even the 200th day moving average line also shows how the price was less at the beginning of the year and
moving high towards the end.
Analysis II: YEAR 2020
In 2020 also, the stock price of all the three banks was high in the beginning and we could notice a steep fall
before 100th day. And the price was going up and down in the later part of the year. The price of the stocks was
also not so high as the other years prices that have been analyzed. This the year in which, the entire world
economy was down because of the massive hit of COVID 19 and consecutive lockdowns. Hence, we can
evidently interpret the downfall in stock prices. According to our previous inference and interpretations after
300th day the stock prices will start rising. In the same way, if we investigate the charts after 300th the stock
prices were lifting. The 50th and 100th day moving average also will show the similar effect in all the three banks.
Discussions
Does Emotions and human psychology play a vital role in investor’s decision-making process? Prospect theory
believes that investment judgment must be based on the likely gain not merely on the efficiency of decision. It
also states that numerous psychological factors have influence on the investor’s decisions.
While analyzing the five years stock data of all the domestic- systemically important banks, we could observe
the similar pattern of stock price fluctuations. Especially, when it decreases before 100th day and increases while
hitting 300th day. Is this because of behavioral finance? When the move of the investors is likely to be same in
one year, it may be because of market reasons. But this research could observe continuously same behavior in
stock prices. We all know the increase and decrease in stock price is influenced by the buying and selling pattern
of the stocks. Obviously, investors tend to buy more when stock price is low and sells when stock price is high.
If we infer the same results in the other way, When the stock reaches highest value around 300th day, immediately
the selling pattern of investors gradually reduces the value of stock and thus we could notice steep down price
in the next 100th day, that is the next year.
Stock Prices change every day because of market forces. Share prices can change because of supply and demand.
If more people want to purchase more stock, then demand will increase and while selling, supply will increase
which causes price moves. If selling is more than the demand for it, the price would fall and vice versa.
Understanding supply and demand is easy. But comprehending which factor reasons for people to like and dislike
another stock is difficult. Then we analyze the recent positive and negative news about the company.
IJCRT2103684 International Journal of Creative Research Thoughts (IJCRT) www.ijcrt.org 5808www.ijcrt.org © 2021 IJCRT | Volume 9, Issue 3 March 2021 | ISSN: 2320-2882
Understanding supply and demand is easy. What is difficult to comprehend is what makes people like a particular
stock and dislike another stock. This comes down to figuring out what news is positive for a company and what
news is negative. There are many answers to this problem and about any investor you ask has their own ideas
and strategies.
Conclusion
Behavioral finance views investors as “normal” but being subject to decision making biases and errors. Decision
making biases can be categorized into four buckets. Self-trickery happens when the investors believe he knows
more than do. In such case they tend to miss in sequence significant for decision making. Heuristic simplification
is another bucket which refers to information processing errors. Many people seek for short cut method of
calculating the risk and income which leads to information processing errors.
Many investors have difficulty selling a stock and sometimes the reason is rooted in the instinctive human
tendency toward voracity. There are many strategies that can identify right time to sell the stock. The most
significant fact is that these strategies attempt to take human emotions out of the decision-making process. The
ability to make money on stocks involves two key decisions: Buying stock at right time and selling at right time.
The objective is to make profit (return on investment) which is determined by the purchase price.
REFERENCE
1. Sadeghnia, M., Hooshmand, A. H., & Habibniko. (2013, April). Behavioural Finance and Neuro
Finance and Research Conducted in this Area. Interdisciplinary Journal of Contemporary Research in
Business, 4(12).
2. Statman, M. (1995). Behavioural Finance Versus Standard Finance. Retrieved January 25, 2014, from
aiinfinance.com: http://www.aiinfinance.com/Statman.pdf
3. Ahmed, N., Ahmad, Z., & Khan, S. K. (2011, February). Behavioural Finance: Shaping the Decisions
of Small Investors of Lahore Stock Exchange. Interdisciplinary Jouranl of Research in Business, 1(2),
38-43.
4. Uzar, C., & Akkaya, G. C. (2013). The Mental and Behavioural Mistakes Investors Make.
International Journal of Business and Management Studies, 5(1), 120-128.
5. Tversky A and Kahneman D (1982), “The Psychology of Preferences”, Scientific American, Vol. 246,
pp.160-173.
6. DeBondt W., Forbes, W., Hamalainen, P. and Muradoglu (2010), “What can behavioral finance teach us
about finance?”, Qualitative research in Financial Markets, Vol. 2 No. 1, pp- 29- 36 Shefrin H (2002),
Beyond Greed and Fear: Understanding Behavioural Finance and the Psychology of Investing, Oxford
University Press,Oxford.
7. Islam, S. (2012). Behavioral finance of an inefficient market. Global Journals of Management and
Business Research, 12(14), 12-34.
8. Gachter, S., Johnson, E.J., & Herrmann, A. (2010). Individual‐level loss aversion in riskless and risky
choices. CeDEx, Discussion Paper Series ISSN 1749‐3293.
9. Ritter, J. (2003). Behavioral finance. Pacific-Basin Finance Journal, 11(4), 429-437
10. Pompain, M.M. (2006). Behavioral finance and wealth management: How to build optimal portfolios
that account for investor biases. John Wiley and Sons, Inc
11. Appiah, E.N., & McMahon, W.W. (2002). The social outcomes of education and feedbacks on growth
in Africa. Journal of Development Studies, 38(4), 27-68.
12. Chuang, W., & Lee, B. (2006). Empirical evaluation of the overconfidence hypothesis. Journal of
Banking & Finance, 30(9), 2489-515
IJCRT2103684 International Journal of Creative Research Thoughts (IJCRT) www.ijcrt.org 5809www.ijcrt.org © 2021 IJCRT | Volume 9, Issue 3 March 2021 | ISSN: 2320-2882
13. Phung, A. (2008). Behavioral finance, key concepts. Retrieved from
http://www.investopedia.com/university/behavioral_finance
14. https://www.investopedia.com/financial-edge/0412/5-tips-on-when-to-buy-your-stock.aspx
15. 3. Schleifer A (2002), Inefficient Markets: An Introduction to Behavioural Finance, Oxford University
Press, Oxford.
16. SeldenG(1912),PsychologyofStockMarket:HumanImpulsesLea dtoSpeculative Disasters, Ticker
Publishing Company, NewYork.
17. Shefrin H (2002), Beyond Greed and Fear: Understanding Behavioural Finance and the Psychology of
Investing, Oxford University Press,Oxford.
18. Shefrin, H., &Statman, M. (2000). Behavioural portfolio theory. Journal of financial and quantitative
analysis, 35(2), 127-151.
19. SimonH(1955),“ABehaviouralModelofRationalChoice”,The QuarterlyJournalof Economics, Vol. 69,
No. 1, pp.99-118
20. www.yahoofinance.com
IJCRT2103684 International Journal of Creative Research Thoughts (IJCRT) www.ijcrt.org 5810You can also read