Determination of crop coefficient (Kc) of Sago Palm (Metroxylon sagu) on several growth stages - EM International Pune India
←
→
Page content transcription
If your browser does not render page correctly, please read the page content below
Eco. Env. & Cons. 26 (August Suppl. Issue) : 2020; pp. (S160-S168)
Copyright@ EM International
ISSN 0971–765X

Determination of crop coefficient (Kc) of Sago Palm
(Metroxylon sagu) on several growth stages
Yumna1*, Sugeng Prijono2, Zaenal Kusuma2 and Soemarno2

1
  Doctoral Program at the Agricultural Science Postgraduate Faculty of Agriculture,
Brawijaya University, Malang, Indonesia.
1
  Faculty of Forestry, Andi Djemma University, Palopo, Indonesia
2
  Faculty of Agriculture, Brawijaya University, Malang, Indonesia

(Received 23 January, 2020; accepted 13 March, 2020)

                                                      ABSTRACT
     Sago palm productivity and quality of wetland sago starch are still relatively low. Rainfed dryland is sufficient
     potential for sago palm development if plant water needs are met. Crop coefficients are important in
     predicting crop water requirements. The determination of crop coefficients was carried out on three stages
     of sago plant growth (initial-stage, mid-stage, and end-stage). The estimation of standard evapotranspiration
     is conducted using the Penman-Monteith method with the Cropwat 8.0 application. The estimation of sago
     palm evapotranspiration utilizes the lysimeter method on the initial-stage and plot observation in the mid-
     stage and end-stage. The determination of the crop evapotranspiration adheres to the water balance principle.
     Crop coefficient values are obtained by comparing standard evapotranspiration with the crop
     evapotranspiration. The results obtained are standard evapotranspiration at the study site 3.91 mm/day.
     Sago palm evapotranspiration is different in each growth phase (initial stage of about 2.44 mm/day, mid-
     stage of about 2.91 mm/day, and end-stage of about 3.82 mm/day. The crop coefficient of sago palm in the
     initial stage of growth that is 0.62, the mid-stage is 0.77 and the end-stage of growth is 0.98. The Kc value is
     used to predict the water needs of sago palm if they are to be developed in rainfed dryland areas.

Key words : Evapotranspiration, Water management, Water balance, Penman-Monteith, Sago palm.

Introduction                                                      The efforts to develop sago in various processing
                                                               technologies, especially sago starch production, are
The world is facing two major crises namely the                not as fast as technology at the cultivation level in
food crisis (Xu, 2019) and the energy crisis (Sarkodie         order to support the fulfillment of sago raw materi-
et al., 2019). The food crisis is triggered by global          als. National sago demand is currently reaching 1
warming (Dinu, 2019) and unequal distribution                  million tons per year, while sago starch production
(Yesilada, 2019). Sago is one food source that can be          is only around 400,000 tons per year (Indonesian
a solution to the world food crisis (Ehara and                 Ministry of Agriculture’s Food Security Agency,
Johnson, 2018). Sago has now shown considerable                2018). The data explains that additional 600,000 tons
sustainability potential based on its use due to its           of sago starch are needed annually. In contrast, the
variations (Syartiwidya et al., 2019), as an alternative       fact is that the general community limits its own
source of sugar (Bujang, 2018), as organic fertilizer          understanding that sago is a plant that grows on
(Talakua and Rich, 2019), and all parts of sago mor-           waterlogged lands, along river banks. Although
phology have economic benefits and values.                     there have been many research results that suggest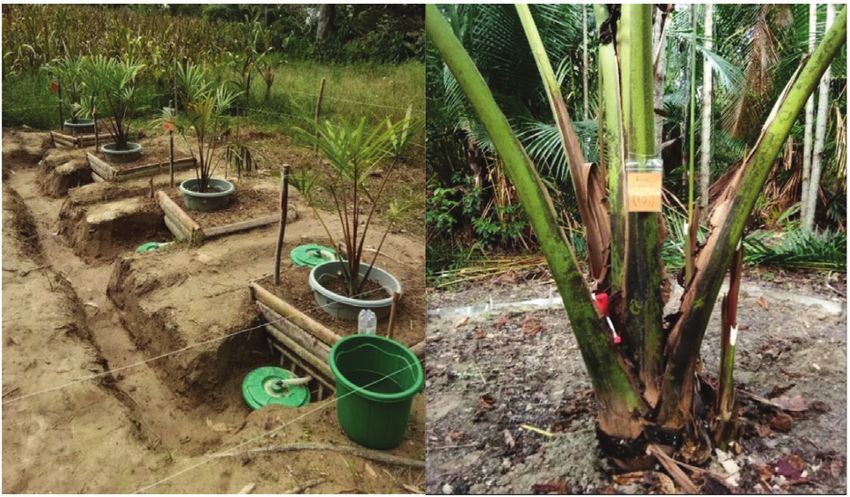
YUMNA ET AL S161
that basically sago will grow well and produce The approach taken to determine the value of the
maximum if planted on dry land or not flooded as crop coefficient of sago palm is to use the water bal-
long as water requirement is met. ance principle through direct measurement of the
Potential development of sago in rainfed dryland water balance component at each phase of plant
has been conveyed by Leuhenapessy (1996) and growth. Plants are grouped into three growth
Botanri et al., (2011). Their researches show a signifi- stages, namely the initial stage, the mid stage, and
cant difference in the production of 343 kg per stem the end stage. The purpose of this research is to de-
in sago growing in dryland, whereas in the inun- termine the crop coefficient value of sago palm in
dated land the average production is only 125 kg the initial stage of growth, the mid stage of growth,
per stem. The decline in production on stagnant and the end stage of growth to predict the water
land is rational because the land is dominated by needs of sago plants. The Kc value then becomes the
sapling and weaning phases. This condition creates basis for sago land water management strategies in
fierce competition in obtaining nutrition to support rainfed dryland.
the growth process. One of the causes of low pro-
ductivity in stagnant land is the difficulty of form- Materials and Methods
ing the main stem as a result of the dominance of
tillers. Botanri et al. (2011) suggest that 85% of sago The study area
stem-forming failure is due to the dominance of
The research was carried out in the Rongkong wa-
tillers. This is also evident in the Rongkong water-
tershed area of North Luwu Regency, South
shed with an area of 1,453.08 ha of sago land, domi-
Sulawesi, Indonesia, precisely in the sago orchard of
nantly wetlands (downstream of the watershed), the
Pimbunian Village (sago demonstration plot cover-
average productivity of 1,917.45 kg/ha/year (De-
ing 1 ha with hydrological conditions of dryland or
partment of Horticultural Food Crops and Planta-
groundwater level below the root zone). Water bal-
tion of North Luwu, 2017) which is below the stan-
ance parameter measurements were carried out for
dard of 2 tons/ha (Ahmad, 2014). This fact rein-
4 months (December 2018 to March 2019). The tim-
forces the urgent need to extend the planting of sago
ing considered the representation of rainfall condi-
9from the lowlands to the highlands, from flooded
tions at the study site (rainfall measurements have
to dryland, as long as water requirements in the
been calibrated with rainfall from the local meteo-
metabolism process are met.
rology climatology and geophysics agency).
Increasing sago productivity in rainfed dryland
is possible as long as sufficient water supply for Study method
plant growth and metabolism is present (Veres et al.,
2019), and, as stated by Tang et al. (2019), the man- Estimation of standard evapotranspiration (ETo)
agement of rainwater as the sole source of water is with the Penman-Monteith method
done properly. One of the potentials of the
This variable applied a number of data including
Rongkong watershed is the high rainfall of above
maximum and minimum temperature (C), humid-
200 mm per month (dryland, wet climate). Optimiz-
ity (%), wind speed (km/day), exposure time
ing the utilization of water production from the rain
(hours), and solar radiation (MJ/ m/day). The data
in the upstream part of the Rongkong watershed to
were obtained at the Meteorology Climatology and
increase sago crop production should be consid-
Geophysics Agency Andi Jemma, North Luwu Re-
ered. The basic policy of developing sago on rainfed
gency for the past 10 years (2008 - 2018). The
dryland is refutable due to the absence of the data of
method applied to calcuend the standard evapo-
the water supply required to cultivate the sago. Ful-
transpiration value was the Penman-Monteith
fillment of plant water needs can be conducted
method (Equation 1).
properly if the plant coefficient as an important pa-
rameter in estimating plant water needs is known. 0.408 (Rn – G) + (900/T+273) U2 (VPD)
Data on plant coefficients for several types of plants ETo =
+ (1 + 0.34U2)
are available in the FAO database, but for sago
plants there are none. The determination of crop Information:
coefficients through direct measurements in the ETo = potential Evapotranspiration (mm)
field is uncompromised regardless of the difficulty. = psychometer coefficientS162 Eco. Env. & Cons. 26 (August Suppl. Issue) : 2020
Rn = net radiation (mm/day)
G = change in saturated soil heat deposits
= changes in saturated vapor pressure associated
with changes in air temperature
T = air temperature (C)
U2 (VPD) = wind speed at an altitude of 2 m above
ground level (km/hr)
ETo analysis was conducted employing the
Cropwat version 8.0 application. This application
also analyzed the effective rainfall (P-eff), to deter-
mine the land water balance chart in a surplus or Fig. 3. Sago palm in the end stage
deficit condition if there is a change in sago-based
land use. Information:
Estimation of plant evapotranspiration (ETa) with ETa = Evapotranspiration of plants (mm)
the water balance method P= Presipitation (mm)
I= Irrigation /splash water (mm)
Evapotranspiration value of sago palm was ob- U = Capillary water up from ground water (mm)
served in three growth stages, namely initial stage, R = Run off (mm)
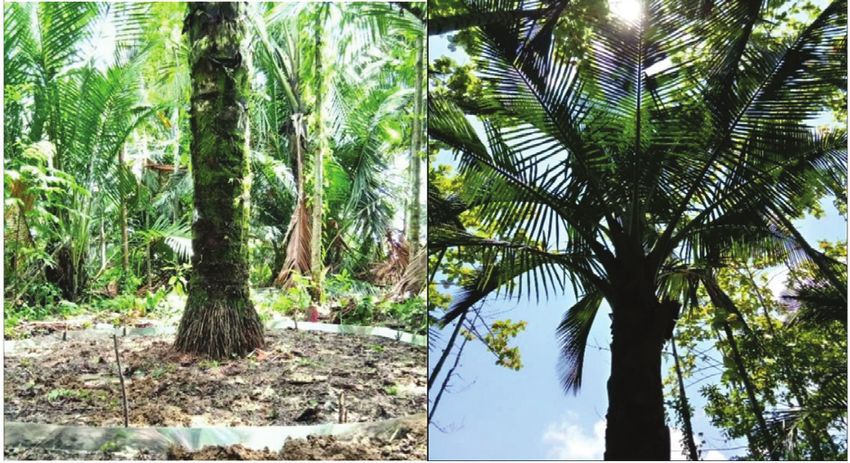
mid stage, and end stage. The selected initial stage D = Percolation (mm)
is one-year-old sago plant (sago palm seeds) (Fig. 1), S = Moisture content of the soil (mm)
the mid stage is sago palm which is around 4 years The water balance components and their mea-
old or the stages where the main stem has not yet surement methods are presented in Table 1.
formed (Fig. 2), and the end stage is the tree phase
with an age of 8 years the height of trees is around Determination of crop coefficients (Kc)
7-8 meters (Fig. 3). The measurement of water bal- Plant coefficient was the ratio of ETo to ETa. The
ance components for the initial stage of growth em- crop coefficient (Kc) of sago palm as determined
ployed 4 units of lysimeter drainage. The mid and using the equation (Allen, 1998):
end stages of growth use the observation plot in a 1
ha of dryland sago demonstration plot. The number Kc = ETc / ETo
of plots was 6 with an area of 2,828.57 cm2 per plot. Information:
Around the observation area was also equipped Kc = crop coefficient
with a simple ombrometer unit to measure actual ETa = Evapotranspiration of plants measured in
rainfall. Observations were carried out from Decem- the field (mm)
ber 2018 to March 2019. ETo = Standard evapotranspiration (mm)
The ETa estimation uses asaz water balance
(Asdak, 2007; Ayu et al., 2013): Results
ETa = (P + I + U) - (R + D + ˜ S )
Standard evapotranspiration (ETo)
The results of the analysis of several climatological
and meteorological parameters sourced from the
Bureau of Meteorology, Climatology, and Geophys-
ics Andi Jemma of North Luwu Regency using the
Penman-Monteith method produce a standard
evapotranspiration (ETo) value for the research site.
The annual average ETo value can be seen in Fig 4.
The complete analysis results are presented in Table 2.
Sago palm evapotranspiration (ETa) in initial
stage, mid stage, and end stage
Fig. 1. Sago palm in the ini- Fig. 2. Sago palm in the
tial stage mid stage Direct measurement in the field to determine theYUMNA ET AL S163
Table 1. Method of measuring water balance components used in determining crop evapotranspiration in the field.
No. Water Balance Method Formula Information Reference
Components
1. Precipitation (P) Drainage P = Pv / A Pv = measured rain volume (ml) Tjokrodiningrat
ombrometer A = Surface area of rain gauge et al., 2016
RainfallS164 Eco. Env. & Cons. 26 (August Suppl. Issue) : 2020
Fig. 4. Standard evapotranspiration (ETo) research sites. Fig. 6. Water balance components in the initial stage of
the sago palm
Fig. 5. Correlation coefficient (r) of climate factors on
standard evapotranspiration Fig 7. The sago land water balance pattern in the mid
stage.
actual evapotranspiration value follows the water
balance level. Measurements were made in three
major groups based on the growth phase, namely
the initial stage, mid stage, and end stage. The re-
sults of the analysis are shown in Tables 3, 4, and 5.
The pattern of water balance components in the
early, mid and end stages of sago palm growth can
be seen in Figures 6, 7 and 8. The evapotranspiration
pattern of sago palm in the three growth phases can
Fig. 8. The sago land water balance pattern in the end
be seen in Figure 10.
stage.
Table 3. Crop Evapotranspiration (ETa) values for initial stage
Period Rainfall + S Runoff Percolation Ro + P + ETa
Irrigation (mm/day) (mm/day) (mm/day) S (mm/day) (mm/day)
(mm/day)
31-Dec-18 16.62 1.66 1.30 11.52 14.47 2.15
5-Jan-19 14.20 -0.25 1.18 10.82 11.74 2.46
10-Jan-19 20.94 1.16 2.33 14.93 18.42 2.52
15-Jan-19 18.58 -0.04 2.25 13.80 16.01 2.56
20-Jan-19 14.47 -0.94 2.27 10.61 11.94 2.52
25-Jan-19 15.96 -0.16 2.43 11.36 13.63 2.33
30-Jan-19 4.53 -0.80 0.05 2.79 2.05 2.49
4-Feb-19 15.04 -1.19 2.77 11.11 12.69 2.35
9-Feb-19 4.66 -1.78 0.51 3.28 2.01 2.65
14-Feb-19 7.59 -0.68 1.12 4.74 5.17 2.42
19-Feb-19 16.87 1.04 2.65 10.76 14.45 2.42
Average (mm/day) 2.44
Source: Results of primary data analysis.YUMNA ET AL S165
Table 4. Crop evapotranspiration (ETa) values for mid stage
Days Period Rainfall S Runof Percolation Ro + P + ETa ETa
to- (mm) (mm) (mm) (mm) S (mm) (mm) (mm/day)
2 27-Dec-18 15.56 13.21 0.04 0.00 13.25 2.31 2.31
5 30-Dec-18 12.45 0.81 1.77 0.00 2.58 9.87 3.29
11 5-Jan-19 15.90 -0.62 0.07 0.00 -0.55 16.45 2.74
20 14-Jan-19 14.31 -4.56 0.04 0.00 -4.53 18.84 2.09
24 18-Jan-19 18.67 4.31 3.67 0.00 7.98 10.69 2.67
27 21-Jan-19 13.69 0.20 3.46 0.00 3.66 10.03 3.34
34 28-Jan-19 0.62 -19.72 0.00 0.00 -19.72 20.35 2.91
41 4-Feb-19 31.12 12.57 3.78 0.00 16.35 14.77 2.11
50 13-Feb-19 39.21 7.17 6.33 0.00 13.49 25.72 2.86
54 17-Feb-19 31.43 1.57 14.51 0.00 16.08 15.35 3.84
58 21-Feb-19 55.77 -1.23 42.19 0.00 40.96 14.81 3.70
62 25-Feb-19 63.38 0.11 51.86 0.00 51.97 11.41 2.85
67 2-Mar-19 32.05 -0.16 21.04 0.00 20.87 11.18 2.24
71 6-Mar-19 45.43 0.13 30.44 0.00 30.56 14.87 3.72
Average (mm/day) 2.91
Source: Results of primary data analysis.
Table 5. Crop Evapotranspiration (ETa) values for end stage
Days to- Period Rainfall S Runoff Percolation Ro + P + ETa ETa
(mm) (mm) (mm) (mm) S (mm) (mm) (mm/day)
2 27-Dec-18 15.56 11.71 0.09 0.03 11.84 3.72 3.72
5 30-Dec-18 12.45 0.55 0.06 0.10 0.71 11.74 3.91
11 5-Jan-19 15.90 -6.43 0.16 0.18 -6.08 21.98 3.66
20 14-Jan-19 14.31 -17.16 0.00 0.07 -17.08 31.40 3.49
24 18-Jan-19 18.67 3.14 0.00 0.08 3.22 15.45 3.86
27 21-Jan-19 13.69 2.54 0.00 0.17 2.70 10.99 3.66
34 28-Jan-19 0.62 -22.04 0.00 0.08 -21.97 22.59 3.23
41 4-Feb-19 31.12 4.97 0.00 0.07 5.03 26.08 3.73
50 13-Feb-19 39.21 7.35 0.00 0.05 7.40 31.81 3.53
54 17-Feb-19 31.43 12.69 0.00 0.14 12.83 18.60 4.65
58 21-Feb-19 55.77 16.18 23.90 0.15 40.23 15.53 3.88
62 25-Feb-19 63.38 -0.65 47.74 0.15 47.24 16.15 4.04
67 2-Mar-19 32.05 -0.28 13.06 0.19 12.97 19.08 3.82
71 6-Mar-19 45.43 0.57 27.74 0.15 28.45 16.99 4.25
Average (mm/day) 3.82
Source: Results of primary data analysis.
Crop Coefficient Value of Sago Palm (Kc)
The comparison of the evapotranspiration value
and the value of the crop coefficient (Kc) in the ini-
tial-season of growth, the mid-season and the end-
season can be seen in Figure 10.
Discussion
Figure 4 shows that the highest ETo value occurred
in October (4.68 mm / day) and the lowest in June
Fig. 9. Evapotranspiration pattern of sago palm in three (2.95 mm / day). Table 1 shows that the high ETo
growth stages value in October was caused by two factors, namelyS166 Eco. Env. & Cons. 26 (August Suppl. Issue) : 2020
cess of water absorption and plant water use (Wu et
al., 2019). The amount of evapotranspiration is very
dependent on the energy supply from the sun,
steam pressure, and wind. In addition to factors in
the atmosphere, soil factors, and their contents, also
affect the rate of evapotranspiration, including
standing water (Yu et al., 2019), salinity (Marino et
al., 2019), organic matter, texture, and density soil.
Figure 9 shows the evapotranspiration pattern of
sago palm in three growth stages. The initial phase
Fig. 10. Crop coefficient values (Kc), standard evapo-
has a lower evapotranspiration value and the pat-
transpiration (ETo), and crop evapotranspiration tern tends to be stable from the beginning to the end
(ETa) in the three stages of sago palm growth. of the observation. The mid stage and the end stage
show a rather wavy pattern. That is, that there is a
the soaring solar radiation (21.1 MJ / m / day) and period of stable water absorption and there are pe-
the exposure time reaching 7.5 hours per day. The riods that increase or decrease dramatically from
effect of solar radiation and irradiation time on ETo other periods. The pattern is inseparable from the
values has also been proven by Li et al. (2017) in his distribution of various factors driving evapotranspi-
research in China on evapotranspiration responses ration such as sunlight, wind, temperature, includ-
to climate factors. Solar radiation and long irradia- ing plant internal factors such as stomata, in re-
tion cause high ETo because both climate param- sponse to external factors (Buckley, 2019).
eters are energy suppliers to the process of plant Crop coefficients (Kc) (Fig 10) in the three growth
metabolism (Didari and Ahmadi, 2019). Vice versa, phase sampling show a tendency to increase with
low and brief irradiation causes low ETo values as increasing plant age. The initial stage with the value
shown in June ETo values (Table 2). The low level of of Kc 0.62, the mid stage 0.77, and the end stage 0.98.
solar radiation reaching the surface of the earth or These results indicate that the water needs of sago
plants can be caused by other climatic factors such palm also increase with the increasing age of the
as the condition of the clouds in the atmosphere plant (Seidel et al., 2019). Kc value is influenced by
(Jiang et al., 2019). Table 1 shows that the low ETo two variables, namely the standard evapotranspira-
value is not only caused by the factors of solar radia- tion value (ETo) and actual crop evapotranspiration
tion and short irradiation but is also caused by the (ETa). This means that all components that affect
low wind speed which is only around 95 km/day. ETo and ETa automatically also affect the Kc value.
These parameters have been tested by Ferreira et al. The ETo value becomes reference evapotranspira-
(2019) in conjunction with standard evapotranspira- tion determined based on local climatic conditions
tion (ETo). The degree of correlation between clima- such as temperature, humidity, wind speed, expo-
tological factors and standard evapotranspiration at sure time, and solar radiation (Allen et al., 1998).
the research site is clearly seen in the correlation Whereas ETa is influenced by other than climate
coefficient (r) (Fig. 5). The humidity factor shows an factors, also soil factors such as salinity, soil mois-
inverse relationship with ETo values. Standard ture availability in the root zone, and the response
evapotranspiration values tend to decrease if hu- of plants themselves to the availability and lack of
midity is high (Jhajharia et al., 2015). water (Mawardi, 2016). Plant response to water is
Sago palm evapotranspiration shows different determined by plant morphology such as increasing
values at each growth phase. Evapotranspiration canopy size, size, and number of leaves (Wang et al.,
tends to increase as plants age. Table 3 shows the 2019).
average ETa values for the initial stage of growth
were 2.44 mm/day, the mid stage 2.91 mm / day Conclusion
(Table 4), and the end stage increased to 3.84 mm /
day (Table 5). Differences in ETa values correlate The standard evapotranspiration (ETo) value at the
with canopy changes (Alam et al., 2019) and plant study site was 3.91 mm/day. Sago palm evapo-
root conditions as important components in the pro- transpiration (ETa) is different in each growth stage,
(initial stage 2.44 mm / day, mid stage 2.91 mm /YUMNA ET AL S167
day, and end stge 3.82 mm/day). The ratio of ETo to Palm: Multiple Contributions to Food Security and Sus-
ETa produces the value of the sago palm crop coef- tainable Livelihoods. Springer.
ficient (Kc) in the initial stage of growth that is 0.62, Ferreira, L. B., Duarte, A. B., Cunha, F. F. D. and Fernandes
the mid stage of 0.77, and the end stage of 0.98. The Filho, E. I. 2019. Multivariate adaptive regression
splines (MARS) applied to daily reference evapo-
sago Kc value is the determinant variable of the
transpiration modeling with limited weather data.
sago palm water needs and is the basis for establish- Acta Scientiarum. Agronomy. 41.
ing sago land water management strategies if it is Hatiye, S. D., Kotnoor, H. P. S. R. and Ojha, C. S. P. 2017.
developed on rainfed dryland. Study of deep percolation in paddy fields using
drainage-type lysimeters under varying regimes of
Acknowledgment water application. ISH Journal of Hydraulic Engineer-
ing. 23(1): 35-48.
The author thanks the Faculty of Agriculture, Jhajharia, D., Kumar, R., Dabral, P. P., Singh, V. P.,
Choudhary, R. R. and Dinpashoh, Y. 2015. Reference
Brawijaya University as the organizer of the Agri-
evapotranspiration under changing climate over the
cultural Science Doctoral Program, where we con-
Thar Desert in India. Meteorological Applications.
tinue our studies. The Ministry of Research, Tech- 22(3): 425-435.
nology and Higher Education of the Republic of In- Jiang, Y., Tang, R., Jiang, X. and Li, Z. L. 2019. Impact of
donesia through the Domestic Postgraduate Educa- clouds on the estimation of daily evapotranspiration
tion Scholarship Program, for financial support. from MODIS-derived instantaneous evapotranspi-
Andi Djemma University, which has provided rec- ration using the constant global shortwave radiation
ommendations for continuing doctoral study pro- ratio method. International Journal of Remote Sensing.
grams. 40(5-6): 1930-1944.
Li, G., Zhang, F., Jing, Y., Liu, Y. and Sun, G. 2017. Re-
sponse of evapotranspiration to changes in land use
References and land cover and climate in China during 2001–
2013. Science of the Total Environment. 596: 256-265.
Ahmad, M. 2014. Farmer empowerment to increase pro- Lingling, L., Renzhi, Z., Zhuzhu, L., Weili, L., Junhong, X.,
ductivity of sago (Metroxylon sago spp) farming. Liqun, C. and Bellotti, B. 2014. Evolution of soil and
International Journal on Advanced Science, Engineering water conservation in rain-fed areas of China. Inter-
and Information Technology. 4(3): 129-133. national Soil and Water Conservation Research. 2(1): 78-
Alam, M. S., Lamb, D. W. and Rahman, M. M. 2019. In-situ 90.
partitioning of evaporation and transpiration com- Marino, G., Zaccaria, D., Snyder, R. L., Lagos, O.,
ponents using a portable evapotranspiration Lampinen, B. D., Ferguson, L. and Corwin, D. L.
dome—A case study in Tall Fescue (Festuca 2019. Actual Evapotranspiration and Tree Perfor-
arundinacea). Agricultural Water Management. 213: mance of Mature Micro-Irrigated Pistachio Orchards
352-357. Grown on Saline-Sodic Soils in the San Joaquin Val-
Aravind, L. 2019. Alternative food production and con- ley of California. Agriculture. 9(4): 76.
sumption: Evolving and exploring alternative pro- Sarkodie, S. A., Crentsil, A. O. and Owusu, P. A. 2019. Does
tein supplement potential through Entomoceuticals. energy consumption follow asymmetric behavior?
IJCS. 7(2) : 1393-1397. An assessment of Ghana’s energy sector dynamics.
Buckley, T. N. 2019. How do stomata respond to water Science of the Total Environment. 651 : 2886-2898.
status? New Phytologist. Seidel, S. J., Barfus, K., Gaiser, T., Nguyen, T. H. and
Bujang, K. 2018. Production, Purification, and Health Ben- Lazarovitch, N. 2019. The influence of climate vari-
efits of Sago Sugar. In: Sago Palm (pp. 299-307). ability, soil and sowing date on simulation-based
Springer, Singapore. crop coefficient curves and irrigation water demand.
Didari, S. and Ahmadi, S. H. 2019. Calibration and evalu- Agricultural Water Management. 221 : 73-83.
ation of the FAO56-Penman-Monteith, FAO 24-ra- Syartiwidya, S., Martianto, D., Sulaeman, A., Tanziha, I.,
diation, and Priestly-Taylor reference evapotranspi- and Rimbawan, R. 2019. Preference for Sago and nu-
ration models using the spatially measured solar ra- trient intake among communities consuming Sago
diation across a large arid and semi-arid area in in Kepulauan Meranti District, Riau Province, Indo-
southern Iran. Theoretical and Applied Climatology. nesia. Jurnal Gizi and Pangan. 14(2): 91-98.
136(1-2) : 441-455. Talakua, S. M. and Kaya, E. 2019. Influence of Organic Fer-
Dinu, V. 2019. Food Security. Amfiteatru Economic. 21(51): tilizer Sago Compost on Ultisols Soil Physical Prop-
281-282. erties of Telaga Kodok Sub Village in Hitu Village
Ehara, H., Toyoda, Y. and Johnson, D. V. (Eds.). 2018. Sago of Central Maluku District and the Corn (Zea maysS168 Eco. Env. & Cons. 26 (August Suppl. Issue) : 2020
Ceratina) Corps Production. Science Nature. 2(1): 042- ment. 212 : 388-398.
056. Wu, Y., Wang, L., Bian, S., Liu, Z., Wang, Y., Lv, Y. and
Tang, M., Zhao, X., Gao, X., Zhang, C. and Wu, P. 2019. Wei, W. 2019. Evolution of roots to improve water
Land Use Affects Soil Moisture Response to Dra- and nitrogen use efficiency in maize elite inbred
matic Short-term Rainfall Events in a Hillslope lines released during different decades in China. Ag-
Catchment of the Chinese Loess Plateau. Agronomy ricultural Water Management. 216 : 44-59.
Journal. 111(3) : 1506-1515. Xu, Z. 2019. Food Dependency and Global Food Crisis.
Tjokrodiningrat, S., Ashari, S., Syekhfani, S. and Aini, N. International Critical Thought. 1-13.
2016. The characteristics of nutmeg (Myristica Yater, T., Tubur, H. W., Meliala, C. and Abbas, B. 2019. A
fragrans Houtt) growth using agroforestry system in comparative study of phenotypes and starch pro-
Ternate Island, Indonesia. Russian Journal of Agricul- duction in sago palm (Metroxylon sagu) growing
tural and Socio-Economic Sciences. 58(10). naturally in temporarily inundated and non inun-
Veres, S., Zsombik, L. and Juhász, C. 2019. Regulation Ef- dated areas of South Sorong, Indonesia. Biodiversitas
fect of Different Water Supply to the Nitrogen and Journal of Biological Diversity. 20(4) : 1121-1126.
Carbon Metabolism. In Abiotic and Biotic Stress in Yesilada, B. A. (Ed.). (2019). Agrarian reform in reverse: the
Plants. Intech Open. food crisis in the Third World. Routledge.
Wang, S., Zhu, G., Xia, D., Ma, J., Han, T., Ma, T. and Yu, T., Feng, Q., Si, J., Xi, H., O’Grady, A. P. and Pinkard,
Shang, S. 2019. The characteristics of evapotranspi- E. A. 2019. Responses of riparian forests to flood ir-
ration and crop coefficients of an irrigated vineyard rigation in the hyper-arid zone of NW China. Science
in arid Northwest China. Agricultural Water Manage- of the Total Environment. 648 : 1421-1430.You can also read