International Journal of Management, Technology And Engineering
←
→
Page content transcription
If your browser does not render page correctly, please read the page content below
International Journal of Management, Technology And Engineering                                ISSN NO : 2249-7455

           Assessment of Reservoir Sedimentation using Remote Sensing and
                 Recommendation for Desilting in Bisalpur Reservoir
                   Nitin Kumar Jangir*1, Ray Singh Meena2, Arun Kumar3, Mohd. Ashraf4
               1,3,4
                       B.Tech Students, Department of Civil Engineering, Poornima Group of
                                  Institutions Jaipur-302022, Rajasthan, India
               2
                Assistant Professor, Department of Civil Engineering, Poornima Group of
                              Institutions Jaipur-302022, Rajasthan, India
                    *Corresponding author: E-mail:- 2014pgicivnitin@poornima.org

                                                    Abstract
              Deposit particles that begin with the decomposition of structures in the basin extend to
           near the conduit. Exactly when the duct flood is secured in a supply, the accumulation is
           established in the file and its capacity decreases. Dropping the limit furthest from a store
           on a long way beyond a more distant point avoids the idea for which it was created.
           Consequently, the evaluation of the sediment oath ends up being fundamental for the
           organization and strategy for these supplies. Some consistent methods, for example,
           hydrographic survey and input overflow methodologies, are being used to evaluate the
           explanation of store development, but these techniques are uncomfortable, monotonous
           and extravagant. There is a need to do fundamental procedures, which require a part of
           the time and are practical. Through this examination, an approach of remote
           identification of distinctive roads with respect to the evaluation of sedimentation in the
           Bisalpur reservoir, disposed of in the Banas River, has been investigated. The multi-hour
           remote reference data (LISS-III) gave information about the water distribution area of the
           supply, which was used to calculate the degree of sedimentation. The most remote
           changes of the store between the most extraordinary and minimum levels were calculated
           with the trapezoidal formula. It was recognized that the recoil in the restricted vault due
           to the affirmation of the accumulation over a period of twelve years (2007-2017) was 296
           mm, which gives an ordinary sedimentation rate of 26.91 mm/year. The ordinary
           sedimentation velocity using hydrographic exploration data for a comparative period was
           22.54 Mm/year. The equality of the results shows that the sedimentation rate studied
           using the strategy based on remote identification was close to the isolated results of the
           hydrographic survey.

             Keywords: Bisalpur, cumulative limit; to stock; deterioration; hydrographic review;
           remote reconnaissance; Sedimentation.

           1. Introduction
              Remote sensing is a focused issue and has an extraordinary use for its use in the region
           of water resources, particularly in the advancement of water resources and its capable
           organization. The tremendous cost of the country needs an increasing amount of advances
           such as remote reconnaissance and GIS to know and try to use water resources (Jaisawal
           et al., 2003). Examining spatial stage data can help store volume revisions. Remote multi-
           date satellite distinction data provides information about height-form districts, especially
           as water spreads through an area. Any fall in the water from the tent of an extended area
           in a rising saw preordained by the satellite is normal for the explanation of the waste
           (Shanker, 2004). In this way, by looking at the assortments of the water distribution
           regions in several intense levels of the file, one can evaluate the measurement of the pile
           of surpluses that have been established over time.

Volume 8, Issue V, MAY/2018                                                                               Page No:435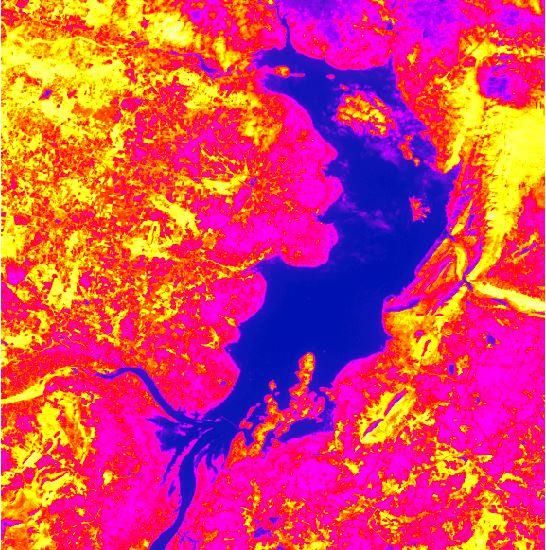
International Journal of Management, Technology And Engineering                                ISSN NO : 2249-7455

              The use of remote identification frames to review the suspended waste has been
           represented by a pair of analysts (Solomonson, 1973, Bartoluci et al., 1977, Holeyer,
           1978, Khoram, 1981).
              Johnson et al. (1980) perceived the sedimentation in the reservoir of the high dam of
           Asuán by differentiating the reflectance greetings in the green and red parts of the show.
           The surface area of the aggregate store was developed by adding up all the pixels called
           water. Test descriptions show that sedimentation in the middle of the surge time interval
           was for the most part bound to the key supply conduit channel and the powerful reservoir.
           The domains of extensive sedimentation were found and the amounts of explanation
           resolved through the soil on the web. This information was used to anticipate the
           dispersion of deposit stores in the vault.
              Rao et approach. (1985) used a remarkable examination technique on notable Landsat-
           MSS images to evaluate the water distribution district at different levels of the
           Sriramsagar reservoir. They used these water distribution assessments to study the
           capacity of the supply and touched the bottom line by arriving at the conclusion that the
           results are comparable to the insights of the hydrographic perspective.
              Mohanty and approach. (1986), who pointed out point by point that, to the extent
           possible, curves transmitted using remote recognition data were generally similar to the
           pairs eliminated from conventional systems.
              Vibulsresth et al. (1988) used powered methods in which the Landsat-MSS near-
           infrared (IR) thickness was cut off to remove the portion of the water extension from the
           Ubolratana store in Thailand. They connected the areas inscribed at water levels and
           calculated, as much as possible, the perspective of the area of the surface obtained using
           cone formulas.
              To see the use of water in a bimonthly store/month by month, Jagadeesha and Palnitkar
           (1991) used satellite data to select the water supply area at different stages of supply and
           the ordinary water requirements. Performance in different periods of progressive progress.
              The collection of information on the zones was obtained in the same way from the
           satellite data. They obtained the suggestion of Borland and Miller (B & M) to find the
           case of the dispersion of sediments deposited between several areas of the store.
              Goel and Jain (1996) obtained a feed sedimentation test using the thickness cutter
           frame to clean the dispersal zone with water. They used IRS-1A data (LISS II) to study
           the sedimentation of the vault in the Dharoi reservoir. The circumstance of the studies
           shows that the remote reconnaissance approach was not used for sedimentation in the
           Himalayan region, which has authentic places that cannot be destroyed.

           2. Study Area and Data Collection
           2.1. The Study Area
              The dam of Bisalpur arranged in Tonk, Rajasthan is selected as the examination
           area (Fig. 1). The Bisalpur dam was worked in 1990 by the government from
           Rajasthan, India; The life of the general public in the urban regions has changed,
           giving them enough water and, along these lines, benefiting in the framework and
           control of the water and thus passing the flowering towards the Northwest region.
             The wandering of Bisalpur is a multipurpose effort, that is, a water frame with a
           path of drinking water supply. A dam length limit around 574 meters and 39.5
           meters of work / stone dam height has been created cross-sectionally stream Banas
           near Bisalpur in the Tonk area to store 38.70 TMC of water CWC has adopted the
           hydrology of the Bisalpur Project in 1989 as evidenced by 75% reliability 33.15
           TMC water is available on the site of Bisalpur Dam. As a result of the accounting

Volume 8, Issue V, MAY/2018                                                                               Page No:436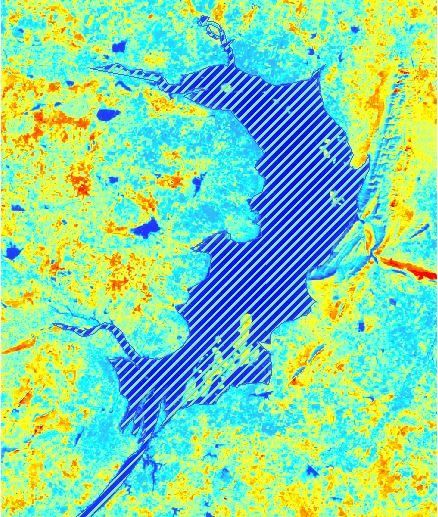
International Journal of Management, Technology And Engineering                             ISSN NO : 2249-7455

           disappearance and various incidents, the usable usable water available is 24.2 TMC,
           which has been distributed for reasons of Water and water frame.

                          Figure 1. Guide to the location of the Bisalpur reservoir

              Subsequently, the store has the ridiculous water level not long after the storm
           season. The water level of the supply by continuous, however, certainly reduces the
           prediction to a couple of types of use and touches the cut levels and the beginning of
           the tempest that accompanies it. The Banas River carries considerable levels of
           sediments, which is horrible for the life of the vault. The responsibility of the
           deposit in this well, as it was, in the light of deforestation, the excess of brushing in
           the field plots, the occasional development of treatments, the development in
           budding verandas, et cetera. The ordinary factors that, in addition, give credit to the
           high measures of transport of waste of the examination district are the abrupt
           topographical obliquity, the poor aid characteristics of the soils; stones rich in earth,
           for example, slates and shales of Spiti; and the proximity of the limestone stores in
           all cases (Sharma et, 1991).
           2.2. Data Used
             To evaluate the actual measurement of the waste stored in the reservoir of the
           Bisalpur dam and take a look at the doubts of the company, hydrographic surveys
           have been carried out in the supply every year from 2007 to 2017.
             Satellite data, The multi-spatial data of the satellite LISS-III for the hydrological
           year 2012-13 is used to evaluate the discontinuous changes in the area of water
           propagation and the adversity of the volume. The four satellite extension dates for
           which data have been used are March 2, 2012, July 20, 2012, November 24, 2012
           and January 13, 2013. In the same way, Survey of India (SOI) toposheets of scale 1:
           50,000 and 1: 2, 50,000 were used. Field data The following information was
           obtained from the masters of the Bisalpur dam (HD) for examination. - Stage area
           data, stage capacity that contrast with the pre-dam audit in 1992.

           3. Methodology
             The mosaic of all the downloaded satellite data is done by programming ERDAS /
           IMAGINE, since the photos are covered in two connection scenes. To see the full image

Volume 8, Issue V, MAY/2018                                                                            Page No:437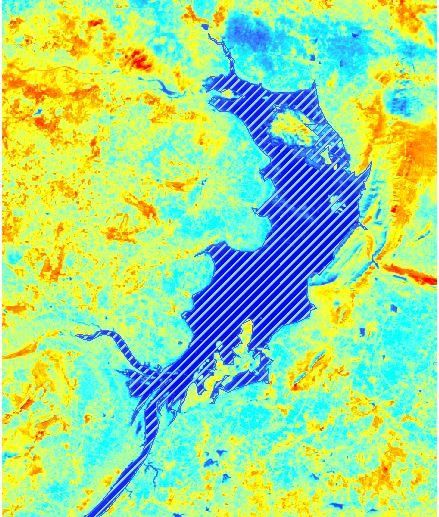
International Journal of Management, Technology And Engineering ISSN NO : 2249-7455
in one minute, mosaic of the scenes is required in a solitary scene of balanced metric
radius.
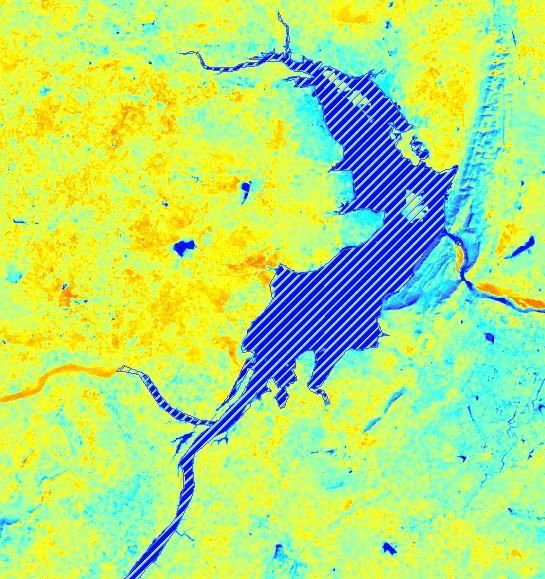
(a) March 2012 (b) July 2012
(c) November 2012 (d) January 2013
Figure 2 Satellite images obtained for different months and years
Estimation of the water distribution area Water is one of the characteristics most easily
delineated in the satellite data in light of the high separation between earth and water in
the Near Infrared Band (NIR), where the water ingests a moderate imperative of the scene
depending on the nature and state of the body of water while it arrives incorporated
absorbs less depending on the cover that compose, brutality, piece, and so on. After
inspecting the radio histogram of the image (RED / NIR), the degrees for the water arrival
/ confinement diagram should be perceived. The radio image can be restricted by turning
the cursor over the FCC image with the numerical display of the radio image activated.
These features containing all the water pixels were confirmed by directing the FCC
Volume 8, Issue V, MAY/2018 Page No:438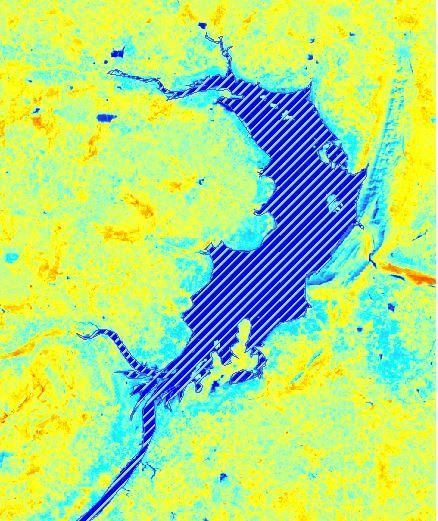
International Journal of Management, Technology And Engineering                                 ISSN NO : 2249-7455

           standard to change the break point. However, in most cases, the radio image threshold
           standard has not yielded adequate results to recognize the correct water pixels as a result
           of the shallowness of the water in a part of the zones along the periphery and the tail
           section of the store. Therefore, the authentic water pixels that were considered were
           evaluated by the radio image threshold (GREEN/NIR).

             Figure 3. Satellite decided to propagate the water from the Bisalpur store for the
                          dates of the scaffolding considered for the examination

              For the tent restriction count between two stages of progressive supply, mostly three
           formulas are used, the prismoidal formula, the Simpson condition and the trapezoidal
           formula (Patra, 2001). Of these, the trapezoidal condition has been mostly used to
           calculate the point of rupture (Jayapragasam et al., 1980, Manavalan et al., 1990, Goel and
           Jain 1996). In this system, the cross-sectional districts of the range lines are outlined and
           these data, together with the surface areas at full supply level between neighboring areas,
           are used to process the waste volumes, as is done next:

                   (           √(        ))                                                          (1)

              Where, V is the volume between two consecutive levels, A1 is the regional
           configuration of the channel in the increase 1, A2 is the area of the frame in the rise 2 and
           H is the difference between the ascents 1 and 2. The volume is treated sedimentation
           storage between two supply levels of the difference between the past confinement study
           point and the satellite information. Water, a separate area of the file was calculated from
           the satellite data and the level that contrasts with the date of the step was accumulated
           from the effort master.

                              Table 1 shows the Data Analysis for various dates

            Sl. No.     Date of     Observed      Elevation       Area       Capacity     Cumulative
                        satellite    Water        Difference     (Mm2)        (Mm2)        Capacity
                                    Level (m)                                               (Mm2)
                                                                RS 2012      RS 2012      RS 2012
              1.       02/03/2012     310.18         0.00         81.91

Volume 8, Issue V, MAY/2018                                                                                Page No:439
International Journal of Management, Technology And Engineering ISSN NO : 2249-7455
2. 20/07/2012 312.03 1.85 113.46 319.852 319.852
3. 24/11/2012 312.53 0.50 113.83 726.688 1046.54
4. 13/01/2013 313.62 1.09 154.49 571.842 1618.382
From the Table 1 of the ascension region, the primary regions in the very attractive
sizes (the offer increases in the dates of the passage of the satellite) were obtained by
direct contribution. From the known estimates of the special regions and evaluated in
different climbs, the limit of a class and redesigned were solved as indicated above. The
overall reduction in the restriction between the most insignificant and essential water
levels has been achieved by including as much as possible at all levels.
4. Results and Discussions
The regional configuration of the water distribution has been learned using remotely
distinguished data. The volume qualification between two consecutive levels was
determined using the trapezoidal formula and is given in Table 1. In this review, it was
considered that the modified containment point of the store at the most insignificant level
observed (313.62 m) was the same as the main breaking point of the aggregate (1618.382
mm) in this size. At the most negligible level observed, as much as possible between the
consecutive levels shown to reach interesting boundaries and redirect to the best level
seen. The difference between the first consolidated stress and the studied one concerned
the loss of the breaking point given the sedimentation in the living area of the feed. Table
1 shows the volume at different dates used to record the explanation of the waste in the
warehouse.
The containment point for the year 2012/13, evaluated by remote identification
techniques (1618.382 Mm), is subtracted as much as possible (1754.84 Mm) at a
comparative level. Adversity in confinement (323 Mm) was attributed to the declaration
of remains in the study area, between 313.62 m and 310.18 m from the store. In this way,
it is estimated that the typical loss rate of the confinement point is 26.91 Mm/year for the
"habitable zone" using remote recognition data. A review of the significant and revised
total cut points obtained using the distance discrimination procedure for 2012/13.
The final result of the sedimentation scheme for dead and living loads is given
autonomously (BPMB, 1997). It can be seen from this table that in the middle of a 11-
year period, adversity in storage has the light of sedimentation is about 296 Mm, however,
in the life limit, it is 268.25 Mm. Thus, as shown in this scheme, the ordinary
sedimentation rate is 22.28 and 22.54 Mm/year for dead and living areas, independently.
So to speak, the sedimentation rate in the living and dead reserves is almost the same. The
sedimentation rate in the diet (26.91 Mm/year) obtained using the remote recognition
approach is insignificantly higher than that obtained from the hydrographic survey (22.54
Mm/year). This higher sedimentation rate can be attributed to the confirmation capability
of the water dispersal zone using remote identification techniques. In addition, the
mixture of pixels that have a huge degree of ground and a smaller water level, such as
those on the edges of the store, can have a similar impact on the results.
5. Conclusions
The use of remote distinctive frameworks to evaluate the sedimentation rate in
the Bisalpur Reservoir (located in the Banas River) shows that the long -term
sedimentation rate over a long period (2007-2017) is 26.91 Mm / year, while
discernments of the earth by hydrographic pattern sedimentation velocity of 22.54
mm for a comparable period. The highest sedimentation rate obtained using remote
identification data can be clarified in light of the accuracy in confirming water, an
extended area and the mixing of water pixels with the soil around the water limits of
Volume 8, Issue V, MAY/2018 Page No:440International Journal of Management, Technology And Engineering ISSN NO : 2249-7455
the diet. In any case, the use of safer satellite data (spatial and community) may be
an answer to these problems to a certain extent.
The use of a remote discrimination procedure involves a rapid and reasonably
accurate assessment of the live mixing volume disaster due to sedimentation.
Recognizing the time and cost associated with hydrographic surveys, it is
recommended that hydrographic surveys be conducted at longer intervals and that
sedimentation plans based on remote reconnaissance be performed over shorter
periods, so that two surveys are conducted complete. In any case, there are some
incarcerations in the process of aggregating remote credentials. For example, remote
identification strategies provide volume information just in the water level deviation
area, which is located around the active supply area. Below this zone, i.e. in the
permanent load zone, the volume information could be taken from the most active
late start with a hydrographic survey.
Confirmations Manufacturers express their sincerity on behalf of the Bisalpur
Project Board (BPMB), Tonk, Rajasthan, India, for giving details of stores and
water sizes on different dates and other appropriate information for examination.
The assistance provided by Mr. K. Goel (National Institute of Hydrology, Roorkee)
to this review is fortunately perceived.
Acknowledgments
The authors would like to express the sincere thanks to Poornima Group of Institutions
and Department of Science and Technology, Jaipur for providing all types of facilities and
funding for conducting this study.
References
[1] Goel, M. K. & Jain, S. K. (1996) Evaluation of reservoir sedimentation using multi-temporal IRS-1A
LISS II data. Asian Pacific Remote Sens. & GISJ. 8(2), 39^13.
[2] Goel, M. K. &Jain, S. K. (1998) Reservoir sedimentation study for Ukai dam using satellite data. Report
no. UM-1/97-98, National Institute of Hydrology, Roorkee, India.
[3] Holeyer, R. J. (1978) Suspended sediment algorithms. Remote Sens. Environ. 10(4), 323-338.
[4] Jagadeesha, C. J. & Palnitkar. V. G. (1991) Satellite data aids in monitoring reservoir water and irrigated
agriculture,Water Int. 16, 27-37.
[5] Jayapragasam, R. & Muthuswamy, K. (1980) Sedimentation studies in Vaigai Reservoir using grid
system. Irrig. Power,CBIP 37(1), 337-350. Central Board of Irrigation and Power, New Delhi, India.
[6] Khoram, S. (1981) Use of Ocean colour scanner data in water quality mapping Photogrumm. Engwg
Remote Sens. 47(5), 667-676.
[7] Manavalan, P., Sathyanath, P., Sathyanarayn, M. & Raje Gowda, G. L. (1990) Capacity evaluation of
the Malaprabha reservoir using digital analysis of satellite data. Tech. Report no. RC: BO: WR: 001:90,
Regional Remote Sensing Service Centre, Bangalore and Karnataka Engineering Research Station,
Krishnaraj Sagar. India.
[8] Ackers P, and White W. K. (I973) “Sediment transport: new approach and analysis,” Journal of
hydraulics Division, American Society of Civil Engineers. Vol. 99. No. HY1 I. pp. 2040- 2060.
[9] Amir Hamzeh Haghiabi and Ehsan Zaredehdasht (2012) "Evaluation of HEC-RAS Ability in Erosion
and Sediment Transport Forecasting", World Applied Sciences Journal 17(11): 1490-1497, 2012 t)
IDOSf Publications.
[10] Barodiya Virendra Kumar, Uday C Roman (2009) “Assessment of sedimentation In Panshet Reservoir
using satellite imageries-A case study”, HYDRO conference 2009. CWPRS. Pune-India.
[11] Batuca G. Dan, Jordaan M. Jan (2000) "Silting And Desilting of Reservoirs". A.A. Balkema Publishers,
Netherlands.
[12] Bowonder. B.. Ramana, K. & Rao. T., (198$) "Sedimentation of reservoirs in India". Land UsuPolicy.
2(2), pp. 148- 154.
Volume 8, Issue V, MAY/2018 Page No:441International Journal of Management, Technology And Engineering ISSN NO : 2249-7455
[13] Green, W.B. (Ed.) (1987).Digital Image Processing, A Systems Approach, Van Nostrand Reinhold
Company, New York.
[14] Jaisawal, R.K., Krishnamurthy, J and Mukherjee, S (2003). Role of Remote sensing and GIS techniques
for generation of groundwater prospect zones towards rural development- an approach. International
Journal of Remote Sensing, 2003 Vol.24, No.5, 993-1008 ISSN 0143-1161 print/ISSN 1366-5901
online Taylor & Francis Ltd.
[15] 15. Karnataka Engineering Research Station, 1978, „Report on Tungabhadra Reservoir Sedimentation
Studies‟, Govt. of Karnataka, Mysore.
[16] Lillisand, T.M. & R.W. Kiefer (Eds.) (1973), „Remote Sensing and Image Interpretation‟, John Wiley &
Sons, New York. Mather P.M. (Ed.) (1987), „Computer Processing of Remotely Sensed Images‟, John
Wiley & Sons, New York.
[17] Mehta N. K. (Map Asia 2000), “E-Governance in water resources a segment: reservoir level and storage
capacity monitoring”.
Volume 8, Issue V, MAY/2018 Page No:442You can also read