Acute toxicity test under optimal conditions of two commercial reactive dyes using the Fenton-like process: Assessment of process factors by Box...
←
→
Page content transcription
If your browser does not render page correctly, please read the page content below
Acute toxicity test under optimal conditions of two commercial reactive dyes using the Fenton-like process: Assessment of process factors by Box– Behnken design Natwat Srikhao Khon Kaen University Arthit Neramittagapong ( artner@kku.ac.th ) Khon Kaen University https://orcid.org/0000-0002-7420-2196 Pongsert Sriprom King Mongkut's Institute of Technology Ladkrabang Sutasinee Neramittagapong Khon Kaen University Somnuk Theerakulpisut Khon Kaen University Nurak Grisdanurak Thammasat University Research Article Keywords: freshwater fairy shrimps, immobilization, iron powder, commercial reactive dye, decolorization, response surface methodology Posted Date: February 15th, 2021 DOI: https://doi.org/10.21203/rs.3.rs-164955/v1 License: This work is licensed under a Creative Commons Attribution 4.0 International License. Read Full License
1

 1 Acute toxicity test under optimal conditions of two commercial reactive dyes using the Fenton-like process:

 2 Assessment of process factors by Box–Behnken design

 3 Natwat Srikhao1, 2, Arthit Neramittagapong1, 2,*, Pongsert Sriprom3,

 4 Sutasinee Neramittagapong1, 2, Somnuk Theerakulpisut4, Nurak Grisdanurak5
 1
 5 Department of Chemical Engineering, Faculty of Engineering, Khon Kaen University,

 6 Khon Kaen 40002, Thailand
 2
 7 Research Center for Environmental and Hazardous Substance Management (EHSM),

 8 Khon Kaen University, Khon Kaen 40002, Thailand
 3
 9 Program of Food Processing Engineering, Faculty of Agro-Industry,

10 King Mongkut's Institute of Technology Ladkrabang, Ladkrabang, Bangkok 10520, Thailand
 4
11 Energy Management and Conservation Office, Faculty of Engineering, Khon Kaen University, Khon Kaen, 40002,

12 Thailand

 5
13 Department of Chemical Engineering, Faculty of Engineering, Thammasat University, Pathumthani, 12000,
14 Thailand
15
16
17
18
19
20
21
22
23
24
25
26
27
28
29
30
31
32
33
34
35
36
2

37 Abstract
38
39 Reactive dye has generally been used in woven cotton fabric dyeing industries. Some treatments of several

40 reactive dyes may produce more toxicity than the original dyes. The objectives of this study were to find the optimal

41 condition on dye degradation efficiency of commercial reactive red dye 36 (DR36) and reactive violet dye 30 (DV30)

42 using Fenton-like reaction, and to determine acute toxicity by static bioassay method under the optimal condition. The

43 experiment was designed by Box Behnken Design (BBD), in which an initial pH, catalyst dosage and initial

44 concentration of H2O2 were considered as independent variables. The results showed that only an initial pH solution

45 was the principal parameter which influenced decolorization of the reactive dyes. Other factors were much less

46 significant. The optimal conditions were found to be given by pH 3, 1 g/L of catalyst dosage, 2 7 .63 mM of

47 concentration of H2O2 for DR36, and pH 3, 1.35 g/L of catalyst dosage, 45 mM of concentration of H2O2 for DV30.

48 Ninety percent of both decolorization were achieved in 30 min. Acute toxicity tests of the treated solutions using

49 freshwater fairy shrimps (Streptocephalus sirindhornae) revealed that the shrimps survived longer than 24 h,

50 indicating that the treated solutions were not acutely toxic. The average leaked iron, ADMI value and total organic

51 carbon were found to be less than 10 ppm, 5 ADMI and 9.17 ppm respectively, in the treated samples. This research

52 demonstrated an efficient method for decolorization of the reactive dyes with low acute toxicity.

53

54 Keywords: freshwater fairy shrimps, immobilization, iron powder, commercial reactive dye, decolorization,
55 response surface methodology
56
57 *Corresponding author E-mail: artner@kku.ac.th (Arthit Neramittagapong )

58
59
60
61
62
63
64
65
66
67
68
69
3

70
71 1.Introduction
72 Global textile industries have grown unstoppably for several decades, more over 700,000 ton of about 10,000

73 types of dyes and pigments were annually produced (Lyu et al. 2016; Holkar et al. 2016). Consequently, dye, especially

74 reactive dye, has become an important feedstock used in the industry. Since dye cannot be consumed totally in the

75 dyeing process, the unreacted dye could remain in the wastewater discharge, causing the wastewater to have

76 unpleasant appearance and toxicity. In Thailand it has been regulated that wastewater discharge should contain dye

77 concentration less than 300 ppm (Nidheesh et al. 2018) and/or the color of the wastewater should be less than 300

78 ADMI unit. Some reactive dyes were also declared as high toxins promoting carcinogenesis and mutagenesis (Nasuha

79 et al. 2016; Mahmood Reza Sohrabi et al. 2016).

80 To meet all the requirements of wastewater, several techniques have been used to reduce dye concentration

81 before the wastewater can be discharged. Advanced oxidation processes (AOP) are some promising methods used for

82 the purpose. These processes have been classified as photo-catalytic (Ayyob et al. 2020), ozonation (Powar et al.

83 2020), and Fenton reaction (Ertugay & Acar 2017). Among the AOPs, the Fenton reaction can extensively be used to

84 decompose hard biodegradable organics, including different dyes (Nasuha et al. 2016; Youssef et al. 2016), and textile

85 discharge (Ghanbari et al. 2014; Punzi et al. 2015). The reaction involves a reaction of ferrous ion with H2O2 to

86 produce OH• free radicals having extremely strong oxidation capacity, especially in narrow pH range of 2.8-3.0

87 (Ghanbari et al. 2014; Glugoski et al. 2017). The narrow pH range makes the Fenton reaction difficult to implment

88 (Wang et al. 2017). The heterogeneous Fenton-like catalytic technique has therefore been used more widely, as has

89 been reported on laterite soil (Khataee et al. 2015), red mud (Dias et al. 2016), montmorillonite clay (Fida et al. 2017),

90 zeolite (Rache et al. 2014) and zero valent iron nanoparticles (Vilardi et al. 2018).

91 Reactive dye such as DR36 and DV30 possesses prominent properties for their stabilities (Malade &

92 Deshannavar 2018) and high level of washing fastness (Nallathambi & Venkateshwarapuram Rengaswami 2017).

93 Nasuha et al. (2016) have studied decolorization of reactive black 5 using Fenton-like. Initial dye concentration,

94 hydrogen peroxide concentration, initial pH of a solution and amount of initial catalyst were selected as the main

95 factors for studying this reaction. Khataee et al. (2016) have also studied the effects of operating parameters of the

96 reaction such as catalyst dosages, [pH], [H2O2] on their decolorization of Reactive Orange 29 dye. However, the
4

 97 decolorization of these reactive dyes have been studied by considering one factor at a time (OFAT). Interaction effects

 98 of the parameters were not studied during the tests.

 99 Statistical experimental design could be a better approach in multi-factor study. A systematic study using

100 response surface methodology (RSM), like central composite design (CCD) and Box Behnken Design (BBD), could

101 be used to set up and analyze the experimental data. Some of the advantages of the RMS include its ability to explain

102 both individual and interaction effects, and optimizing decolorization condition. In addition, it’s has successfully been

103 applied to various oxidation processes to optimize the experimental design condition (Fu et al. 2009; Berkani et al.

104 2020).

105 In this study, the decolorization of DR36 and DV40 dye was implemented by BBD under three factors

106 simultaneously, including pH, catalyst loading, and amount of H2O2. The study was carried out using iron powder in

107 a Fenton-like reaction. The experiment was set up in a range of pH 3-7, Catalyst 0.01-1.5 g/L, and H2O2 0.5-100 mM.

108 The optimum condition and the most influential factor(s) in decolorization of the reactive dyes were the objective of

109 this study. The water after the treatment was also tested for acute toxicity by using fairy shrimps (Streptocephalus

110 sirindhornae).

111
112 2.Materials and methods

113 2.1 Materials

114 Reactive red dye 36 (DR36) and violet dye 30 (DV30) (without heavy metal, Dylon, England) used in this

115 study were purchased in Thailand. The Fenton-like experiment were carried out using commercial iron-powder grade

116 (99.64% Gammaco, Thailand). H2O2 30% (QRëC, New Zealand). NaOH (98%wt Ajax Finechem Pty Ltd, Auckland,

117 New Zealand) and H2SO4 (96%wt RCI Labscan Limited, Thailand) were used to adjust the solution pH to the desired

118 levels. Ethanol (99.8% Analar NORMAPUR ® ACS, Reag.Ph.Eur. , France) was used to wash the catalyst. Nylon

119 filter membrane (Syring filter 0.45 Micron CNW, China) was used to filter the sample solution before determining

120 the color values using UV-Vis spectrophotometer (SPECORD,Analytik Jena, Germany). All solutions were prepared

121 with deionized water (DI water).

122

123 2.2 Experimental
5

124 Iron-powder was sieved to the size range of 1 0 0 - 5 0 0 mesh. It was washed by Deionized water and ethanol,

125 and then dried at 80oC for 1 hour. The obtained material was immediately used right after the preparation. Box–

126 Behnken design (Software Minitab 16) was used to randomize the experimental values of the three factors at three

127 levels as shown in Table 1. The studied factors included initial pH, catalyst dosage, and initial concentration of H2O2.

128 The experiments were performed in a batch-wise system of 600 mL container, under room temperature. The

129 decolorization of reactive dye (300 ppm) was carried out using different initial concentrations of H2O2 (0.5-100 mM),

130 the catalyst dosage (0.01-1.5 g/L) and pH (3-7). One molar of H2SO4 or NaOH solution was used to adjust the solution

131 pH.

132 During the test, the remaining concentration of the reactive dye in the solution was withdrawn 30 minutes

133 after the beginning of the experiment, and analyzed for the percentage of decolorization efficiency (DE%) and the

134 American Dye Manufacturers Institute (ADMI) value by UV-Vis spectrophotometer. The Non-Purgeable Organic

135 Carbon (NPOC) method was used to determine the TOC value. These values were compared with those of the solution

136 withdrawn prior to the commencement of the experiment.

137 The catalyst was further characterized for its surface area and composition by N2 Adsorption-Desorption

138 (ASAP 2010, Micromeritics, USA) and X-Ray Fluorescence Spectrometry (SEA1000A, Seiko Instruments GmbH,

139 Germany), respectively. After 30 minutes of reaction, the solution was analyzed for iron leachate by Inductively

140 Coupled Plasma-Optical Emission Spectrometer (Optima 8x00 Series, PerkinElmer, United States of America).

141

142 Table 1 Box-Behnken design for varying the factors
 Levels of factors
 Factors Symbol
 -1 0 1
 Initial pH (X1) 3 5 7
 Catalyst dosage (g/L) (X2) 0.01 0.755 1.5
 Initial concentration of H2O2 (mM) (X3) 0.5 50.25 100

143
144 The Quadratic polynomial model equation (1) was obtained to analyze the data using the least square of error

145 technique as follows:

146 = 0 + 1 1 + 2 2 + 3 3 + 4 12 + 5 22 + 6 32 + 7 1 2 + 8 1 3 + 9 2 3 ± (1)

147 In which Y is dye removal efficiency (response function), βi are regression coefficient, Xi are independent
148 variables, and is value of the error.
6

149
150 2.3 Acute toxicity assays

151 Young freshwater fairy shrimps (Streptocephalus sirindhornae Sanoamuang) were obtained from a stock

152 maintained at the Department of Fisheries, Khon Kaen University. The acute toxicity and immobilization tests were

153 performed according to 202 of OECD Guidelines for Testing of Chemicals (OCDE, 1984) with modifications. For the

154 tests, 20 of neonates were divided into five groups of four animals each. The first and second groups were exposed to

155 both (DR36 andDV30) of the original dye diffusion (300 mg/L), the third and fourth groups in the treated water from

156 the optimal condition in Fenton-like process (DR36 and DV30), and the final group in the water obtained from the

157 source of fairy shrimps (control water).

158 The water obtained from the source of fairy shrimp culture was used as the control water. The acute toxicity

159 assays can be assessed by counting the number of dead and surviving neonates at 0.5, 1, 6, 12, 24, 36, 48, 60 hours

160 and compared with the control water. Prior to the test, the solution of every experimental batch was adjusted to the

161 pH value of 7.66 before adding the neonates except the control water. This experiment did not have any light control.

162 Therefore, the daytime was assumed to be approximately 12h, and 12h nighttime.

163
164 3.Results and discussion

165 3.1 Characteristics of catalysts

166 The specific surface area was determined to be 3.932 m2/g by the Brunauer–Emmett–Teller (BET) method

167 using the N2 Adsorption-Desorption Semisorb, (ASAP 2010, Micromeritics, USA). The purity of the iron-powder was

168 found to be 99.64%wt using X-Ray Fluorescence Spectrometry.

169

170 3.2 Dye degradation

171 The values of dependent and independent factors, and the condition for every experimental data set which was

172 obtained from Box–Behnken design (Table 1) are presented in Table 2. The decolorization efficiency (DE%) of DR36

173 and DV30 were calculated by Equation 2 and shown in Table 2.
 0 −
174 % = × 100 (2)
 0

175 where DE% is the decolorization efficiency, C0 is the initial concentration of the dye, and Ct is concentration of the
176 dye at 30 min.
177
7

178 Table 2 Results of the Box–Behnken experimental design for dye decolorization efficiency
179 (DE%) of DR36 and DV30.
180
 %DE of %/DE of DV30
 Run Initial pH Catalyst dosage (g/L) H2O2 (mM) DR36 dye dye
 30 min 30 min
 1 5 0.01 0.5 19.523 24.945

 2 3 0.01 50.25 42.668 78.061

 3 7 0.01 50.25 7.768 10.950

 4 3 0.755 0.5 99.244 94.770

 5 5 0.01 100 19.994 22.047

 6 7 0.755 0.5 21.411 10.833

 7 5 1.5 0.5 39.764 64.757

 8 7 1.5 50.25 22.460 25.771

 9 3 1.5 50.25 94.033 77.113

 10 7 0.755 100 19.144 4.785

 11 5 1.5 100 45.714 93.609

 12 5 0.755 50.25 62.514 64.182

 13 5 0.755 50.25 62.796 81.096

 14 5 0.755 50.25 53.157 64.208

 15 3 0.755 100 92.751 62.056
181
182 The coefficients of the response functions for various independent variables were obtained by correlating the

183 experimental results with the response functions by using a Minitab 16 statistical software. The response functions for

184 DR36 and DV30 were obtained by the Least Square of Error method as Equations 3 and 4, respectively for predicting

185 the dye decolorization efficiency.

186 % ( 36) = 55.43 − 30.25 1 + 9.70 2 − 3.9 3 − 1.62 12 − 20.06 22 − 7.01 32 − 8.21 1 2 + 3.34 1 3 +
187 1.76 2 3 (3)
188
189 % ( 36) = 69.83 − 32.46 1 + 15.66 2 − 1.6 3 − 15.04 12 − 6.81 22 − 11.68 32 + 3.94 1 2 + 6.67 1 3 +
190 7.94 2 3 (4)
191
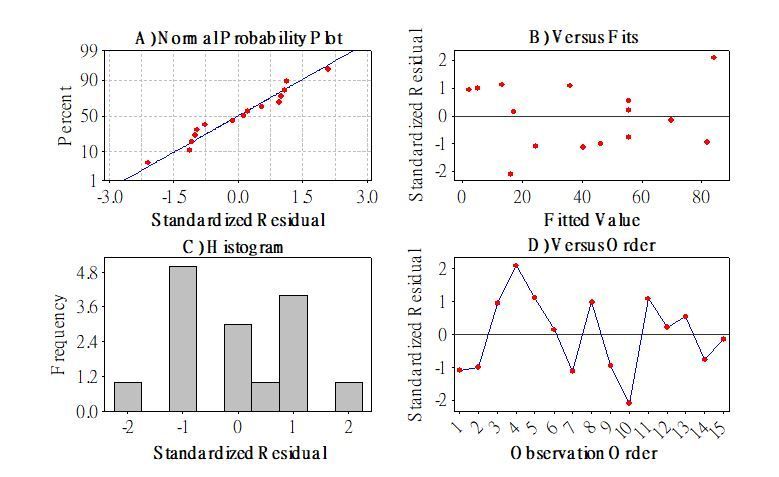
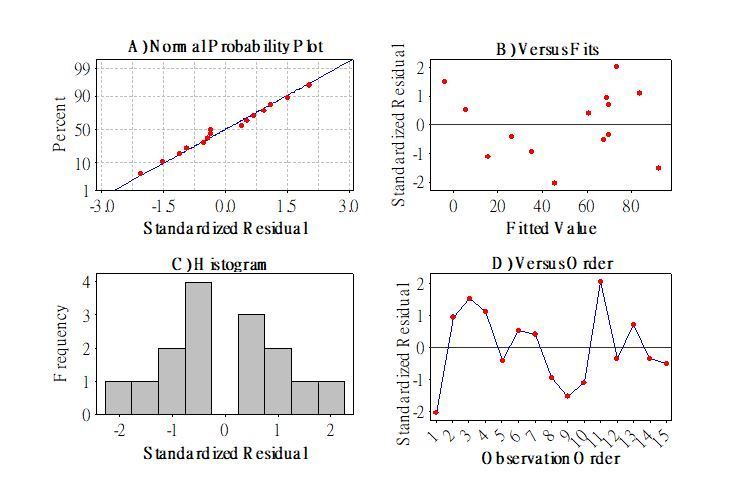
8

192 Figure 1 and 2 can be used to verify the accuracy of Equations 3 and 4, respectively. Figures 1a and 2a indicate

193 that the data were distributed on straight lines independently. Figure 1B and 2B show the stability of variance to be

194 dispersed around the zero. The histogram of the Figure 1C and 2C demonstrate that the standard deviation of the data

195 was well distributed (bell-shape) and tend to the center. Lastly, Figure 1D and 2D show the standardized residual of

196 the data with respect to the observation order. These two figures reveal that the order of the experiment was well

197 distributed, indicating that the experimental design was well randomized.

198
 A) Normal Probability Plot B) Versus Fits

 Standardized Residual
199 99
 2
 90 1
 Percent

200 50 0
201 10 -1
202 -2
 1
203 -3.0 -1.5 0.0 1.5 3.0 0 20 40 60 80
 Standardized Residual Fitted Value
204
 C) Histogram D) Versus Order
 Standardized Residual

205 4.8 2
206 1
 Frequency

 3.6
207 0
 2.4
208
 -1
209 1.2
 -2
210 0.0
 -2 -1 0 1 2 1 2 3 4 5 6 7 8 9 10 11 12 13 14 15
211 Standardized Residual Observation Order
212
213 Fig. 1 Standard error compared to a) standardized residual b) versus fits c) Histogram d)Versus order.
214
215
216
217
218
219
220
221
222
223
224
225
226
227
228
9

229
230
 A) Normal Probability Plot B) Versus Fits

 Standardized Residual
231 99 2
232 Percent 90 1
233 50 0
234 10
 -1
235 1
 -2
 -3.0 -1.5 0.0 1.5 3.0 0 20 40 60 80
236
 Standardized Residual Fitted Value
237
 C) Histogram D) Versus Order
238 4 2

 Standardized Residual
239
 Frequency

 3 1
240
 2 0
241
 1 -1
242
 0 -2
243 -2 -1 0 1 2 1 2 3 4 5 6 7 8 9 10 11 12 13 14 15
244 Standardized Residual Observation Order
245
246 Fig. 2 Standard error compared to A) standardized residual B) versus fits C) Histogram D) Versus Order.
247 For DV30.
248

249 Based on the statistical data of Figures 1 and 2 , it can be seen that the data obtained were well distributed and

250 independent. In other words, no abnormal statistical data were observed. Therefore, Equations 3 and 4 can be used

251 with some degree of confidence. Equations 3 and 4 were also analysed for variance by ANOVA test with 95 %

252 confidence interval. The Fvalue and Pvalue were considered for each variable presented in Table 3.

253 From Table 3, it should be noted that only terms of linear source, which have statistically significant effects on

254 the DE% of DR36 and DV30. For DR36, the significant factors were found to be initial pH (X1), the catalyst dosage

255 (X2) and the term of X22. Even though the initial concentration of hydrogen peroxide (X3) was not significant, it is

256 necessary for a Fenton-like reaction as the reducing agent. For DV30, it was found that only the initial pH was the

257 significant factor, while other factors were insignificant, but they were needed for the reaction.

258 However, the applicability of Equations 3 and 4 must be judged by the term of Lace of fit which is used to

259 indicate to the error of these equations. Table 3 shows that the Lace of fit values for DR36 and DV30 were not

260 significant. Therefore, the equations are statistically reliable without a need to remove any factors from the equations

261 (Ay et al. 2009), indicating the model can be used to forecast the DE%.

262
10

263 Table 3 ANOVA test for response function Y (DE%)
 DR36 DV30
 Source DF
 F-value P-value Result F-value P-value Result
 Regression 9 10.71 0.009 Significant 3.46 0.093 Insignificant
 Linear 3 26.03 0.002 Significant 8.82 0.019 Significant
 X1 1 69.76 0.000 Significant 21.42 0.006 Significant
 X2 1 7.18 0.044 Significant 4.98 0.076 Insignificant
 X3 1 1.16 0.331 Insignificant 0.05 0.828 Insignificant
 Square 3 5.07 0.056 Insignificant 1.13 0.420 Insignificant
 2
 X1 1 0.09 0.774 Insignificant 2.12 0.205 Insignificant
 2
 X2 1 14.15 0.013 Significant 0.44 0.538 Insignificant
 X 32 1 1.73 0.246 Insignificant 1.28 0.309 Insignificant
 Interaction 3 1.03 0.453 Insignificant 0.42 0.749 Insignificant
 X1 × X2 1 2.57 0.170 Insignificant 0.16 0.707 Insignificant
 X1 × X3 1 0.42 0.543 Insignificant 0.45 0.531 Insignificant
 X2 × X3 1 0.11 0.751 Insignificant 0.64 0.460 Insignificant
 Residual 5
 Error
 Lace-of-fit 3 4.71 0.180 Insignificant 6.22 0.142 Insignificant
 Pure-Error 2
 Total 14
264 F-test 95% confidence (α=0.05)
 Source DF 1 DF 2 F critical
 F(0.05,DF1,DF2) 9 5 4.77
 F(0.05,DF1,DF2) 3 5 5.41
 F(0.05,DF1,DF2) 1 5 6.61
 F(0.05,DF1,DF2) 3 2 19.16
265
266 Comparison between the predicted and experimental values can be made by plotting the predicted values

267 against the experimental values as shown in Fig.3A and 3B for DR36 and DV30, respectively. As shown in Fig. 3A,

268 the equation obtained fits approximately well with experimental results (less than 10% error). Similarly, Fig 3B reveals

269 similar results but with less accuracy (less than 15% error). It should be noted, however, for the range of 70- 80% of

270 decolorization the model for DV30 can be used to predict decolorization with improved accuracy (less than 10%

271 error). Consequently, it can be concluded that both of the models were in reasonably good agreement with the

272 experiment.

273
274
275
11

276
277
278
279
280
281
282
283
284
285
286
287
288
289 Fig. 3. Experimental and predicted equation results for decolorization A) DR36 B) DV30
290
291
292 3.3 Effects of parameters on decolorization efficiency

293 The initial pH (X1) was found to be the most influential factor on the decolorization efficiency. The F-value

294 can confirm this in Table 3 where the Fvalue values were found to be 69.76 and 21.42 for DR36 and DV30, respectively.

295 On the contrary, the catalyst dosage (X2) and the initial concentration of H2O2 (X3) were much less influential on

296 decolorization.

297 More interestingly, based on statistical results in Table 3, it should be noted that the interaction effects between

298 the insignificant variables and significant variables were not significant. However, the interaction effects of the

299 variables were shown to influence decolorization by response surface methodology (Fig.4).

300 The interaction effects of between (X1) and (X2) were depicted in Fig. 4A and Fig.4D, whereas Fig. 4B and

301 Fig. 4E show the interaction effects between (X1) and (X3). It is seen that %DE increases with the catalyst dosage and

302 H2O2 at a constant pH of 3. At other pH values, the %DE is slightly affected by the catalyst dosage and initial

303 concentration of H2O2. At the initial pH of 3, the decolorization efficiency is the highest. This finding was also

304 observed by Khataee et al. (2015), who used the iron-rich laterite soil as the catalyst. This can be explained by the

305 instability of H2O2 and depressed oxidation potential of hydroxyl radicals at higher pH (Fida et al., 2017). In addition,

306 the alkaline solution causes the Ferrous ion (Fe2+) to transform to be Iron (II) hydroxide (Fe(OH)2) according to

307 Equation 5. Fe in this form is inactive (Ertugay & Acar 2017; Chu et al. 2012).

308
12

309 2+ + − → ( )2 (5)
310
311 Fig. 4C and Fig. 4F show the DE% tends to the maximum value as X2 and X3 increase until some limits. The

312 limits of X2 were found to be 1.3g/l for DR36 and 1.5g/l for DV30. The limits were due to excessive active sites of

313 the catalyst, resulting in excessive ferrous ions (Khataee et al., 2015; Fida et al., 2017). In theory, the ferrous ion can

314 react with H2O2 to produce more hydroxyl radicals (Khataee et al. 2015; Ma et al. 2015), but excessive ferrous ions

315 will result in some of the ions becoming the scavengers of the hydroxyl radicals (Li et al. 2017; Bouzayani et al. 2017)

316 as illustrated in Equations 6-8.

317 _ 2+ + 2 2 → _ 3+ + 2 + ° (6)

318 _ 2+ + ° → _ 3+ + − (7)

319 _ 3+ + 2 2 → _ 2+ + + + ° (8)

320 where X is the solid catalyst support.

321 In a similar manner to the catalyst dosage, the DE% increases with H2O2 concentration until some limits. The

322 H2O2 concentration over 60 mM tends to decrease the DE%. Excessive H2O2 will result in hydroxyl radical scavenging

323 (Mahmood R. Sohrabi et al., 2017; Quadrado & Fajardo, 2017; Grisales et al., 2019) according to Equations 9 and 10.

324 2 2 + ° → 2 + ° (9)
325 + → 2 + 2
 ° °
 (10)
326

327 In conclusion, the study of the effects of the parameters on decolorization efficiency, as presented in Figure 4,

328 reveals that the most influential parameter is the initial pH, which should be controlled at pH 3 for the best dye

329 decolorization efficiency. The other factors, namely catalyst dosage and concentration of H2O2, should respectively

330 be kept in the ranges of 0.9-1.2 g/L, and 20-35 mM of [H2O2] for DR36, and 1.3-1.5 g/L, and 40-50 mM of [H2O2]

331 for DV30.

332

333

334

335

336

337
13

338

339

340

341

342

343

344

345

346

347

348

349

350

351

352 Fig. 4 Contour plot illustrations, the interaction effect of variables on dye decolorization efficiency in
353 the Fenton -like process in white (A-C) For DR36 and (D-F) for DV30.

354

355 3.4 Optimal condition and asseveration of the findings

356 The optimal conditions of dyes were predicted by using Equations 3 and 4 for DR36 and DV30, respectively.

357 These equations were obtained by the Least Square method based on the numerical values generated from the

358 experimental data by Minitab 16 software. The optimal conditions were found to be pH 3, 1 g/L of catalyst dosage,

359 27.63 mM of H2O2 For DR36, and pH 3, 1.35 g/L of catalyst dosage, 45 mM of H2O2 for DV30. Under these predicted

360 conditions, the best of DE% were found to be 89.38% and 92.33% for DR36 and DV30, respectively.

361 In order to verify the accuracy of the optimal conditions, three decolorization tests were repeated for DR36 and

362 three tests for DV30. The average experimental results of DE% were 91.86% with a standard deviation of 7.24%

363 and 92.97% with a standard deviation of 8.88% for DR36 and DV30, respectively. The experimental results were,

364 therefore, comparable with the predicted values with the standard deviations as described.
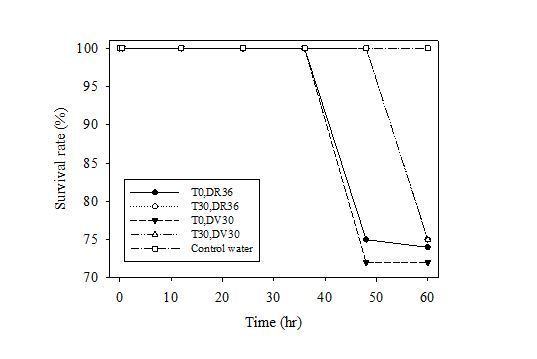
14

365 Furthermore, under these optimal conditions, the average values of leached iron, TOC, and ADMI unit were

366 also determined. These results were less than 10 ppm, 9.17 ppm, 5 ADMI, respectively. The treated water was

367 therefore in compliance with American Dye Manufacturing Institute, and Thailand’s Industrial Discharge Water

368 standards.

369

370 3.5 Acute toxicity

371 Fig. 5 shows the results of acute toxicity test of the treated water with the optimal condition. The test was

372 performed by counting fatalities of the fairy shrimps exposed to the treated water and the original untreated water.

373 The result showed, after 24 hours, that no deaths were observed in all of the batches. This leads to the conclusion that

374 there was no difference in acute toxicity of the treated and untreated water.

375 However, when the toxicity test reached 48 h, only 25% of the neonates in the original, untreated water with

376 DR36 died, whereas the fatalities in the case of DV30 were 27%. In the case of treated waters and cultured water were

377 found not any death. At 60 h, the treated water showed a slightly better survival rate than the original, untreated water.

378 The survival rate was found to be 76% for treated waters (both DR36 and DV30), while the original, untreated water

379 showed 74% and 72% for DR36 and DV30, respectively. No fatality was observed in the control water.

380 In conclusion, only a slight difference in toxicity between the treated and untreated water. Fernandesa et al.

381 (2018). also observed a similar result in their acute toxicity test (24 h). Therefore, the Fenton-like reaction under the

382 optimal condition could be well applied to treat wastewater from the dyeing industry.

383
 100
384
 95
385
 Survival rate (%)

 90
386 85
 T0,DR36
387 80 T30,DR36
 T0,DV30
 T30,DV30
388 75
 Control water

 70
389 0 10 20 30 40 50 60
 Time (hr)
390

391 Fig. 5 Effects of different treated water and untreated water with survival rate (%) of fairy shrimp (T0 is
392 original dye at 300 ppm, T30 is treated water, and control water is water from a freshwater fairy shrimp
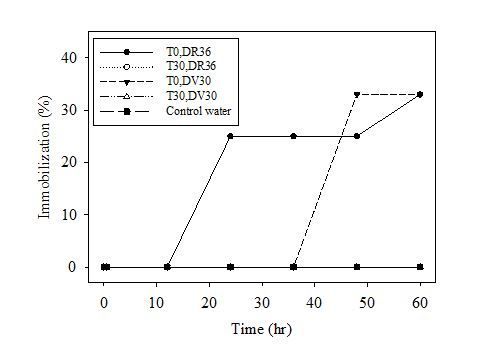
15

393 culture.
394

395

396 T0,DR36
 40 T30,DR36
 T0,DV30
397 T30,DV30

 Immobilization (%)
 30 Control water
398
 20
399
 10
400

401 0

 0 10 20 30 40 50 60
402
 Time (hr)

403 Fig. 6. Effects of different treated water and untreated water with immobilization (%) of fairy shrimp, T0 is
404 original dye at 300 ppm, T30 is treated water, and control water is water from a freshwater fairy
405 shrimp culture
406

407 The immobilization test of the fairy shrimps was also carried out and presented in Fig.6. The test mainly

408 involved observing the movement of the laboratory animals. The experiment result revealed no abnormal movement

409 of the fairy shrimps in the control water and all the treated water. However, only in the untreated water (DR36), 25%

410 of immobilization was observed at 24 h, while in the untreated water (DV30), 33% of immobilization was observed

411 at 48 h. This result indicated the treated water was less harmful to the fairy shrimps than the untreated water.

412

413 4.Conclusion

414 A Box–Behnken design was used to find the optimal condition for dye decolorizing efficiency by considering

415 the three variables, including initial pH, catalyst dosage and initial concentration of hydrogen peroxide. The initial pH

416 was found to be the most influential parameter on dye decolorization efficiency. The Least Square of Error method

417 was used to create the models for predicting the dye decolorizing efficiency for DR36 and DV30, respectively. The

418 model can be used to predict the optimal decolorization conditions for DR36 and DV30. The optimal conditions were

419 experimentally verified, and it was found that the predicted DE% was in good agreement with the experimental values.

420 More importantly, the treated water was in compliance with the American Dye Manufacturing Institute and Thailand’s
16

421 Industrial Wastewater Discharge standards. The toxicity test revealed no acute toxicity. Therefore, the Fenton-like

422 reaction using iron-powder as the catalyst is suitable for removing DR36 and DV30.

423
424 Acknowledgements

425 This research was granted by Research Fund of the Faculty of Engineering, Khon Kaen University, Thailand,

426 contract No. 4-1/2559.

427 -Ethical Approval: Compliance with Ethical Standards
428
429 -Consent to Participate: All applicable international, national, and/or institutional guidelines for the care and use of
430 animals were followed.
431
432 -Consent to Publish: Not applicable
433
434 -Authors' Contributions: Natwat Srikhao planed, designed the experiments, collected data, interpreted, analyzed, and
435 wrote a manuscript. Arthit Neramittagapong, Pongsert Sriprom, and Sutasinee Neramittagapong designed the
436 experiments, provided chemicals and instruments, interpreted, analyzed, discussed, and wrote a manuscript. Somnuk
437 Theerakulpisut and Nurak Grisdanurak interpreted, analyzed, discussed, and wrote a manuscript
438
439 -Funding: This study was funded by the Research Fund of the Faculty of Engineering, Khon Kaen University,
440 Thailand, contract No. 4-1/2559.
441
442 -Competing Interests: The authors declare that they have no competing interests.
443
444 -Availability of data and materials: Not applicable
445
446
447 Reference
448
449 Ay F, Catalkaya EC, Kargi F (2009) A statistical experiment design approach for advanced oxidation of Direct Red
450 azo-dye by photo-Fenton treatment. J Hazard Mater 162:230–236.
451 https://doi.org/10.1016/j.jhazmat.2008.05.027
452 Ayyob M, Ahmad I, Hussain F, Kashif Bangash M, Awan JA, Jaubert JN (2020) A new technique for the synthesis
453 of lanthanum substituted nickel cobaltite nanocomposites for the photo catalytic degradation of organic dyes
454 in wastewater. Arab J Chem 12:6341-6347. https://doi.org/10.1016/j.arabjc.2020.05.036
455 Berkani M, Kadmi Y, Bouchareb MK, Bouhelassa M, Bouzaza A (2020) Combinatıon of a Box-Behnken design
456 technique with response surface methodology for optimization of the photocatalytic mineralization of C.I.
457 Basic Red 46 dye from aqueous solution. Arab J Chem https://doi.org/10.1016/j.arabjc.2020.05.013
17

458 Bouzayani B, Meijide J, Pazos M, Elaoud SC, Sanroman MA (2017) Removal of polyvinylamine sulfonate
459 anthrapyridone dye by application of heterogeneous electro-Fenton process. Environ Sci Pollut Res 24:18309–
460 18319. https://doi.org/10.1007/s11356-017-9468-5
461 Chu L, Wang J, Dong J, Liu H, Sun X (2012) Treatment of coking wastewater by an advanced Fenton oxidation
462 process using iron powder and hydrogen peroxide. Chemosphere 86:409–414.
463 https://doi.org/10.1016/j.chemosphere.2011.09.007
464 Dias FF, Oliveira AAS, Arcanjo AP, Moura FCC, Pacheco JGA (2016) Residue-based iron catalyst for the
465 degradation of textile dye via heterogeneous photo-Fenton. Appl Catal B Environ 186:136–142.
466 https://doi.org/10.1016/j.apcatb.2015.12.049
467 Ertugay N, Acar FN (2017) Removal of COD and color from Direct Blue 71 azo dye wastewater by Fenton’s
468 oxidation: Kinetic study. Arab J Chem 10:S1158–S1163. https://doi.org/10.1016/j.arabjc.2013.02.009
469 Fernandes NC, Brito LB, Costa GG, Taveira SF, Cunha-Filho MSS, Oliveira GAR, Marreto RN (2018) Removal of
470 azo dye using Fenton and Fenton-like processes: Evaluation of process factors by Box–Behnken design and
471 ecotoxicity tests. Chem Biol Interact 291:47–54. https://doi.org/10.1016/j.cbi.2018.06.003
472 Fida H, Zhang G, Guo, Naeem A (2017) Heterogeneous Fenton degradation of organic dyes in batch and fixed bed
473 using La-Fe montmorillonite as catalyst. J Colloid Interface Sci 490:859–868.
474 https://doi.org/10.1016/j.jcis.2016.11.085
475 Fu JF, Zhao YQ, Xue XD, Li WC, Babatunde AO (2009) Multivariate-parameter optimization of acid blue-7
476 wastewater treatment by Ti/TiO2 photoelectrocatalysis via the Box-Behnken design. Desalination 243:42–51.
477 https://doi.org/10.1016/j.desal.2008.03.038
478 Ghanbari F, Moradi M, Manshouri M (2014) Textile wastewater decolorization by zero valent iron activated
479 peroxymonosulfate: Compared with zero valent copper. J Environ Chem Eng 2:1846–1851.
480 https://doi.org/10.1016/j.jece.2014.08.003
481 Glugoski LP, Cubas PDJ, Fujiwara ST (2017) Reactive Black 5 dye degradation using filters of smuggled cigarette
482 modified with Fe3+. Environ Sci Pollut Res 24:6143–6150.
483 https://doi.org/10.1007/s11356-016-6820-0
484 Grisales CM, Salazar LM, Garcia DP (2019) Treatment of synthetic dye baths by Fenton processes: evaluation of
485 their environmental footprint through life cycle assessment. Environ Sci Pollut Res 26:4300–4311.
486 https://doi.org/10.1007/s11356-018-2757-9
487 Holkar CR, Jadhav AJ, Pinjari DV, Mahamuni NM, Pandit AB (2016) A critical review on textile wastewater
488 treatments: Possible approaches. J Environ Manage 182:351–366.
489 https://doi.org/10.1016/j.jenvman.2016.07.090
490 Khataee A, Gholami P, Sheydaei M (2016) Heterogeneous Fenton process by natural pyrite for removal of a textile
491 dye from water: Effect of parameters and intermediate identification. J Taiwan Inst Chem Eng 58:366–373.
492 https://doi.org/10.1016/j.jtice.2015.06.015
493 Khataee A, Salahpour F, Fathinia M, Seyyedi B, Vahid B (2015) Iron rich laterite soil with mesoporous structure for
494 heterogeneous Fenton-like degradation of an azo dye under visible light. J Ind Eng Chem 26:129–135.
18

495 https://doi.org/10.1016/j.jiec.2014.11.024
496 Li K, Zhao Y, Janik MJ, Song C, Guo X (2017) Facile preparation of magnetic mesoporous Fe3O4/C/Cu composites
497 as high performance Fenton-like catalysts. Appl Surf Sci 396:1383–1392.
498 https://doi.org/10.1016/j.apsusc.2016.11.170
499 Lyu C, Zhou D, Wang J (2016) Removal of multi-dye wastewater by the novel integrated adsorption and Fenton
500 oxidation process in a fluidized bed reactor. Environ Sci Pollut Res 23:20893–20903.
501 https://doi.org/10.1007/s11356-016-7272-2
502 Ma J, Zhou L, Dan W, Zhang H, Shao Y, Bao C, Jing L (2015) Novel magnetic porous carbon spheres derived from
503 chelating resin as a heterogeneous Fenton catalyst for the removal of methylene blue from aqueous solution. J
504 Colloid Interface Sci 446:298–306. https://doi.org/10.1016/j.jcis.2015.01.036
505 Malade LV, Deshannavar UB (2018) Decolorisation of Reactive Red 120 by hydrodynamic cavitation. Mater Today
506 Proc 5:18400–18409. https://doi.org/10.1016/j.matpr.2018.06.180
507 Nallathambi A, Venkateshwarapuram Rengaswami GD (2017) Industrial scale salt-free reactive dyeing of
508 cationized cotton fabric with different reactive dye chemistry. Carbohydr Polym 174:137–145.
509 https://doi.org/10.1016/j.carbpol.2017.06.045
510 Nasuha N, Ismail S, Hameed BH (2016) Activated electric arc furnace slag as an efficient and reusable
511 heterogeneous Fenton-like catalyst for the degradation of Reactive Black 5. J Taiwan Inst Chem Eng 67:235–
512 243. https://doi.org/10.1016/j.jtice.2016.07.023
513 Nidheesh PV, Zhou M, Oturan MA (2018) An overview on the removal of synthetic dyes from water by
514 electrochemical advanced oxidation processes. Chemosphere 197:210–227.
515 https://doi.org/10.1016/j.chemosphere.2017.12.195
516 OCDE Guideline for Testing of Chemical (1984) Dapnhia sp Acute Immobilisation Test and Reproduction Test.
517 Guideline:1–16.
518 Powar AS, Perwuelz A, Behary N, Hoang L, Aussenac T (2020) Application of ozone treatment for the
519 decolorization of the reactive-dyed fabrics in a pilot-scale process-optimization through response surface
520 methodology. Sustain 12. https://doi.org/10.3390/su12020471
521 Punzi M, Anbalagan A, Aragão BR, Svensson BM, Jonstrup M, Mattiasson B (2015) Degradation of a textile azo
522 dye using biological treatment followed by photo-Fenton oxidation: Evaluation of toxicity and microbial
523 community structure. Chem Eng J 270:290–299. https://doi.org/10.1016/j.cej.2015.02.042
524 Quadrado RFN, Fajardo AR (2017) Fast decolorization of azo methyl orange via heterogeneous Fenton and Fenton-
525 like reactions using alginate-Fe2+/Fe3+ films as catalysts. Carbohydr Polym 177:443–450.
526 https://doi.org/10.1016/j.carbpol.2017.08.083
527 Rache ML, García AR, Zea HR, Silva AMT, Madeira LM, Ramírez JH (2014) Azo-dye orange II degradation by the
528 heterogeneous Fenton-like process using a zeolite Y-Fe catalyst—Kinetics with a model based on the Fermi’s
529 equation. Appl Catal B Environ 146:192–200. https://doi.org/10.1016/J.APCATB.2013.04.028
530 Sohrabi MR, Khavaran A, Shariati S, Shariati S (2017) Removal of Carmoisine edible dye by Fenton and photo
531 Fenton processes using Taguchi orthogonal array design. Arab J Chem 10:S3523–S3531.
19

532 https://doi.org/10.1016/j.arabjc.2014.02.019
533 Sohrabi MR, Moghri M, Fard Masoumi HR, Amiri S, Moosavi N (2016) Optimization of Reactive Blue 21 removal
534 by Nanoscale Zero-Valent Iron using response surface methodology. Arab J Chem 9:518–525.
535 https://doi.org/10.1016/j.arabjc.2014.11.060
536 Vilardi G, Di Palma L, Verdone N (2018) On the critical use of zero valent iron nanoparticles and Fenton processes
537 for the treatment of tannery wastewater. J Water Process Eng 22:109–122.
538 https://doi.org/10.1016/J.JWPE.2018.01.011
539 Wang J, Liu C, Li J, Luo R, Hu X, Sun X, Shen J, Han W, Wang L (2017) In-situ incorporation of iron-copper
540 bimetallic particles in electrospun carbon nanofibers as an efficient Fenton catalyst. Appl Catal B Environ
541 207:316–325. https://doi.org/10.1016/j.apcatb.2017.02.032
542 Youssef NA, Shaban SA, Ibrahim FA, Mahmoud AS (2016) Degradation of methyl orange using Fenton catalytic
543 reaction. Egypt J Pet 25:317–321. https://doi.org/10.1016/j.ejpe.2015.07.017
544
545
Figures

Figure 1

Standard error compared to a) standardized residual b) versus ts c) Histogram d)Versus order.
Figure 2

Standard error compared to A) standardized residual B) versus ts C) Histogram D) Versus Order. For
DV30.

Figure 3
Experimental and predicted equation results for decolorization A) DR36 B) DV30

Figure 4

Contour plot illustrations, the interaction effect of variables on dye decolorization e ciency in the Fenton
-like process in white (A-C) For DR36 and (D-F) for DV30.
Figure 5

Effects of different treated water and untreated water with survival rate (%) of fairy shrimp (T0 is original
dye at 300 ppm, T30 is treated water, and control water is water from a freshwater fairy shrimp

Figure 6

Effects of different treated water and untreated water with immobilization (%) of fairy shrimp, T0 is
original dye at 300 ppm, T30 is treated water, and control water is water from a freshwater fairy shrimp
culture
You can also read