Assessment of air quality during worst wildres in Turkey
←
→
Page content transcription
If your browser does not render page correctly, please read the page content below
Assessment of air quality during worst wildfires in
Turkey
Salman Tariq ( salmantariq_pu@yahoo.com )
University of the Punjab Quaid-i-Azam Campus: University of the Punjab https://orcid.org/0000-0002-
9935-4516
Zia ul-Haq
University of the Punjab Quaid-i-Azam Campus: University of the Punjab
Ayesha Mariam
University of the Punjab Quaid-i-Azam Campus: University of the Punjab
Usman Mehmood
University of the Punjab Quaid-i-Azam Campus: University of the Punjab
Waseem Ahmed
National Institute of Disaster Management
Research Article
Keywords: Air pollution, AOD, aerosol-type, forest fire, remote sensing, Turkey
Posted Date: September 16th, 2021
DOI: https://doi.org/10.21203/rs.3.rs-903604/v1
License: This work is licensed under a Creative Commons Attribution 4.0 International License.
Read Full License
Page 1/16
Abstract
Recently, a worse and large-scale forest fire broke out across Turkey, which adversely affected the
country’s air quality level and caused a tremendous loss. Mugla and Antalya cities were the hot spot
areas of this fire that experience adverse effects. In this paper, we examined and compare the air pollution
scenario before and during the forest fire episode i.e., from 27 July to 10 August 2021 in Antalya and
Mugla. The results show that before the fire accusation, i.e., on 27 July, the daily mean aerosol optical
depth (AOD), was 0.1 indicates a clear sky. However, as the fire breakouts on 28 July, this daily mean AOD
value increased too rapidly and reached 0.52 on 6 August, indicating intense air pollution. The highest
AOD was 2.2 over northern Marmaris, Ula, southeastern Milas, Mugla Merkezon on 5 August 2021. The
results show that peak fire activity occurred during 4–8 August. Meanwhile, the highest NO2
concentration was 167 µmol/m2 over mid-east Merkez and Köycegiz. The peak HCHO load was 750
µmol/m2 over southern Mugla city. Moreover, Mugla and central Antalya cities experienced the highest O3
concentrations of 0.14 µmol/m2. Similarly, at the Junction of Dalaman, Köycegiz, and Ortaca, peak CO
(0.08 mol/m2) and AI (3.5) had been observed. The high-altitude smoke was over Mugla city. Whereas,
over Antalya, mixed aerosols had dominant, followed by smoke, dust, non-smoke fine mode, and fine
dominated aerosols.

1. Introduction
For estimation of the concentration of particulate matter (PM) in the atmospheric column, AOD (aerosol
optical depth) is a surrogate index (Wei et al., 2021). AOD can utilize for human health, air quality,
navigation management, ecosystem, climatological, and meteorological assessment (Sowden et al.,
2018). Various wildfire events in the Turkey (Elvan et al., 2021), United States (US), Australia, and Brazil
have gained greater concentration due to their impacts on air quality and human health (Butt et al., 2020;
H. et al., 2020). Forest fire is a significant source of trace gases and PM in the atmosphere that degrades
the regional air quality and severely affects public health (Butt et al., 2020). Both land use and climate
change influence the fires in the tropics (Heald & Spracklen, 2015). About 90% of global fine particulate
matter (PM2.5) fire emissions cause due to the fires in sub-tropical and tropical regions (Van Der Werf et
al., 2017; Wiedinmyer et al., 2011). Fires are the primary cause of PM pollution in tropics and sub-tropical
regions (Johnston et al., 2012; Lelieveld et al., 2015). Forest degradation and deforestation (Morgan et al.,
2019) cause fragmented forest landscapes, which result in being rapidly prone to fire (Alencar et al., 2015;
Cano-Crespo et al., 2015). Additionally, deforestation raises the local temperature (Baker & Spracklen,
2019), affects regional climate and rainfall (Spracklen et al., 2012; Spracklen & Garcia-Carreras, 2015).
Interaction of smoke from fires with radiation and clouds further decreases rainfall (Cheng et al., n.d.;
Kolusu et al., 2015).

Forest vegetation and climatic condition in Turkey make it vulnerable to forest fires (Elvan et al., 2021).
During the last 20 years, about 2000 forest fires had observed every year in Turkey, among them 48%
caused by humans (Atasoy & Geçen, 2014; Elvan et al., 2021). However, when the fires rate of unknown

                                                   Page 2/16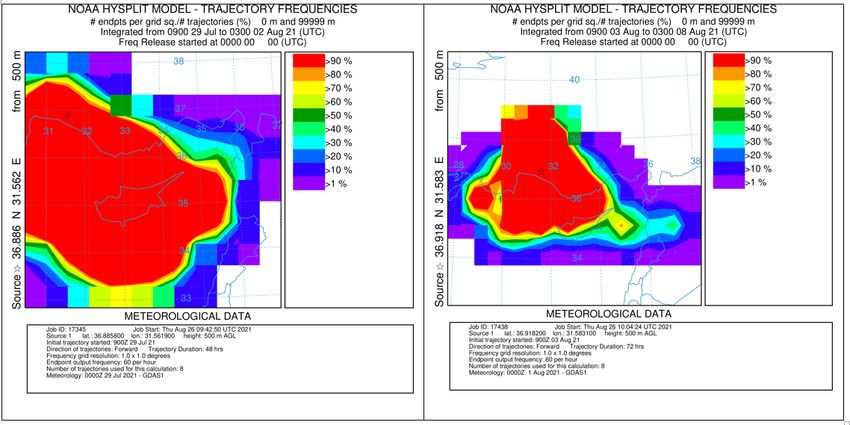
causes is incorporated, this percentage rises to 71% (Elvan et al., 2021). Open neighborhoods in Turkey
can spread the forest fire rapidly and burn the burnable materials, e.g., bushes, grasses, leaves, thick or
thin branches, and tress. Forest fires in Turkey not only affect Turkey. However, neighboring regions are
also influences (Atasoy & Geçen, 2014). There is a lack of researches that analyzes the air pollution
scenario during forest fire events using remote sensing techniques over Turkey. Therefore, in this study,
we have analyzed the role of Turkish forest fire in air pollution levels.

2. Materials And Methods
2.1. Study Area
Turkey is located partly in Europe and Asia at 36°–42° N and 26°- 45°E, with 83.15 million population and
81 cities. Turkish territory is 1660 km long from east to west and covers 780043 km2 of area. Four
different types of climate prevail in Turkey, i.e., Mediterranean, Black Sea, Continental, and Marmara
climate. Ankara, the capital of modern Turkey. Antalya and Mugla cities are the southwestern city of
Turkey having a Mediterranean climate which is warm and rainy in winters and dry and hot in summer.
Tourism and agriculture are the leading sectors of these cities. The vegetation in Antalya and Mugla cities
is composed of Anatolian black pine, Calabrian pine, stone pine, cedar, oak, Turkish sweetgum,
eucalyptus, fir, cypress, juniper, sycamore, maple tree, and rambutans. Besides these, Çukurova orchid,
sunflower, Çukurova violet are the unique plants of this region. Moreover, thyme, bayleaf, herba sideritis,
carop, mushrooms, myrtishrub, folium, and moss have economic value for this region. In the European
continent, Turkey hosts almost 75% of the total flora species. Among them, 533 endemic taxons are
within Antalya (Kaman & Yavaş, 2014). All the risk factors that cause forest fire can be found together in
these areas (Sevinc et al., 2020). In Turkey, during the last 10 years, the highest number of wildfires
occurred in this region. From 2008 to 2018, about 3231 wildfires were seen in this region with a burned
area of 4343 hectares (Sevinc et al., 2020). Antalya and Mugla cities were selected as the study area
because of the worse wildfire damages in these regions during the recent wildfire activity.
2.2. MAIAC AOD
High resolution aerosol optical depth (AOD) dataset had acquired from MAIAC (Multi-Angle
Implementation of Atmospheric Correction) algorithm of MODIS (Moderate Resolution Imaging
Spectroradiometer) (A. Lyapustin et al., 2011; Alexei Lyapustin et al., 2011). MAIAC comprised both Aqua
and Terra satellites in the afternoon and morning. MODIS has a broader swath width of 2330 km with
minimal gaps over the tropics. It collects data within 36 spectral bands starting from the visible to the
infrared spectrum, seven of these bands spanning 0.47 to 2.13 µm utilize for the aerosol retrievals. For
this study, we used MAIAC AOD having a 1km spatial resolution from 27 July to 10 August 2021.

2.3. TROPOMI Sentinel-5P
On October 13, 2017, the ESA (European Space Agency) launched a Sentinel-5 Precursor satellite that
carrying TROPOMI (TROPOspheric Monitoring Instrument) sensor to monitor air pollution (Veefkind et al.,

                                                  Page 3/16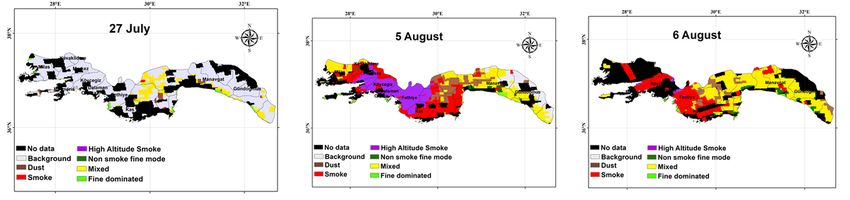
2012). In this study, air quality datasets had acquired from TROPOMI. The datasets included offline
tropospheric NO2 column number density, tropospheric Formaldehyde (HCHO) column number density,
O3 column number density, CO column number density in the unit of mol/m2, and UV Aerosol Index (AI).

2.4. Suomi NPP/VIIRS and Active fire
The aerosol type data had obtained from Suomi National Polar-orbiting Partnership/Visible Infrared
Imaging Radiometer Suit (Suomi NPP/VIIRS). The Deep Blue and Satellite Ocean Aerosol Retrieval
algorithms are employed over land and ocean to identify atmospheric aerosol-type. A deep blue aerosol-
type layer of VIIRS gives information regarding the aerosol composition over the ocean and land. The
combined Aerosol-type over the ocean and land obtained from such pixels that pass high-quality
assurance tests. Aerosol-type classification based on the AOD, Ångström exponent (Ozdemir et al., 2020;
Tariq et al., 2016), brightness temperature, and Lambert Equivalent Reflectivity. Additionally, Additionally,
MODIS-derived active fire data had utilized to determine active fire locations over the study area.

2.5. HYSPLIT model
Air Resources Laboratory of NOAA (National Oceanic and Atmospheric Administration) developed
HYSPLIT (Hybrid Single-Particle Lagrangian Integrated Trajectory) model
(https://www.arl.noaa.gov/ready/index.php). This model frequently utilizes in atmospheric sciences to
computing the direction and path of the air masses (Bagheri et al., 2019; Qu et al., 2018; Rao et al., 2018;
Wu et al., 2015). This model provides backward (Tariq et al., 2016; Zielinski et al., 2016) and forward wind
trajectories (Bagheri et al., 2019). HYSPLIT model runs four types of trajectories, i.e., normal, matrix,
ensemble, and frequency. Frequency trajectory initiates a trajectory from a single height and location
after every six hours. Afterward, add the frequency that the trajectories pass across a grid cell. Then,
normalize them either by using the total number of endpoint or trajectories. In this study, we utilized a
frequency-forward trajectory at the height of 500m to determine the particles' distribution direction and
path.

3. Results And Discussion
3.1. Active fire activity
Figure 1 shows MODIS-derived active fire regions of Turkey from 28 July to 10 August 2021. Most of the
forest fire activities have occurred over southwestern regions included Antalya and Mugla cities.
Therefore, in this research, we selected these two cities as our study area. Within these cities, intense fire
activities were observed in Gündogmus, Manavgat, Köycegiz, Kavaklidere, Marmaris, Mugla Merkez,
Bodrumand, and Milas districs.

3.2. Spatial-temporal variations in AOD
Forest fire activity may also cause to enhance the aerosol burden (AOD value) over the affected region.
The spatial-temporal distribution of AOD over the Antalya and Mugla cities of Turkey on 27 July (before
                                                   Page 4/16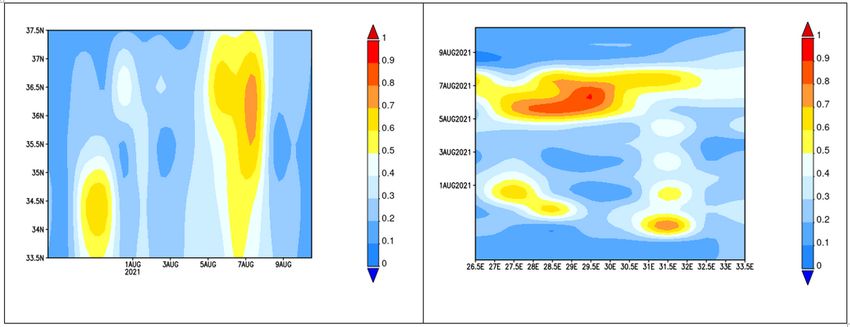
the fire event) and from 28 July to 10 August 2021 (during the fire activity) has shown in Fig. 2. The daily
average AOD value before the fire accusation, i.e., on 27 July, was 0.1 shows a clear sky with no aerosol
load. However, as the fire breakouts on 28 July, this daily average AOD value increased too rapidly and
reached 0.52 on 6 August, indicating intense air pollution. Initially, on 29 July, only southern Manavgat
and southwestern Alanya had perceived the highest aerosol load. Afterward, it spread over the whole
study region till 6 August. During the study period, the highest spatial distribution of AOD was on 6
August with a peak of 2.0 over mid-north Mugla Merkez. However, the highest AOD was found to be 2.2
over northern Marmaris, Ula, southeastern Milas, Mugla Merkezon on 5 August 2021 The peak fire activity
were from 4–8 August due to the highest AOD values these days, demonstrating the intense air pollution.
However, after 6 August, AOD values declined gradually shows a decreasing trend.

From 30 July to 3 August, the maximum AOD, i.e., greater than 2.1 was over the southern Manavgat,
southwestern Gündogmus, and Alanya district. However, later on, from 4 August, this maximum value
appearing over central Mugla city. Mid-east Köycegiz, mid-north Mugla Merkez, southern junction of Milas
and Mugla Merkez, Ola and Marmaris, Ortaca and Köycegiz, southern Manavgat, Gündogmus, and
Alanya were the highly affected areas.

3.3. Air quality indicators
TROPOMI-derived spatial distribution of air quality parameters, i.e., (NO2, O3, HCHO, CO, and aerosol
index) on 7 August have shown in Fig. 3. From Fig. 3. the consistency found among the AOD, AI (El-Nadry
et al., 2019), NO2, and CO, suggesting these air quality parameters can be the AOD indicators or vice
versa. Descriptive statistics of AOD, NO2, O3, HCHO, CO, and AI provide in Table 1. The results show mid-
east Mugla Merkez and Köycegiz had experienced the highest 167 µmol/m2 concentration of NO2.

This followed by Yatagan, Milas, Marmaris, Fethiye, and Dalaman districts of Mugla and Merkez of
Antalya city. The highest HCHO concentration of 750 µmol/m2 was observed over southern Mugla city.
Moreover, the peak O3 concentration, such as 0.14 µmol/m2, was mainly distributed over the Mugla and
central Antalya cities. At the Junction of Dalaman, Köycegiz, and Ortaca, peak CO (0.08 mol/m2) and AI
(3.5) had observed.

                                                  Page 5/16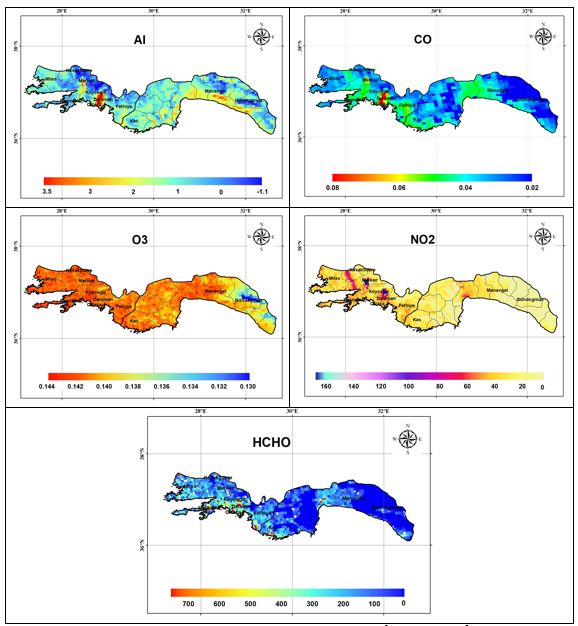
Table 1
                               Descriptive statistics of air quality parameters.
                    Air pollutant          Min       Max        Mean    Standard deviation

                    AOD                    0.01      1.3        0.34    0.2

                    CO (mol/m2)            0.02      0.08       0.04    0.01

                    O3 (µmol/m2)           0.130     0.144      0.139   0.002

                    NO2 (µmol/m2)          1.4       167        30.1    13.6

                    HCHO (µmol/m2)         0.004     752        181     116

                    AI                     -1.16     3.4        -0.09   0.57

3.4. Aerosol classification
Satellite Ocean Aerosol Retrieval and Deep Blue algorithms had utilized for atmospheric aerosol-type
classification. Based on the AOD, Ångström exponent, brightness temperature, and Lambert Equivalent
Reflectivity, aerosols had classified into different classes, i.e., fine dominated, mixed, non-smoke fine
dominated, high altitude smoke, dust, smoke, background, and No data. Figure 4 demonstrates the
spatiotemporal distribution of aerosol-type. On 27 July (before the fire breakouts), background aerosols
had frequently distributed over the study area. However, during the fire activity, i.e., on 5 August, high
altitude smoke has become dominant over the Mugla city, but its northwestern regions had covered with
mixed aerosol. On this day, over western Antalya, the smoke dominated. However, mixed aerosols had
observed over eastern Antalya with a combination of dust, background particles, non-smoke fine mode,
and fine dominated aerosols. By 6 August, the smoke had seen over Mugla city. Whereas, over Antalya,
mixed aerosols had dominant, followed by smoke, dust, non-smoke fine mode, and fine dominated
aerosols, indicating intense air pollution in this region during this fire event.

3.5. Latitudinal and longitudinal transport of aerosols
The Hovemollar diagram also plays a significant role in understanding the spatial-temporal distribution
of AOD (Tariq et al., 2016). The longitude and latitude-average Hovemollar diagram in Fig. 5
demonstrated the AOD spatial distribution at 550nm for 26.5o-33.5oE and 33.5o-37.5oN area from 27 July
to 10 August 2021. It shows daily AOD variations regarding longitude and latitude. The longitude-average
Hovemollar diagram presents low AODs, i.e., less than 0.1, on 27 July 2021 (before fire breakouts).
Afterward, a rising trend was found in AOD values, with the highest AOD values between 35.5o N to
36.7oN around 7 August 2021, indicating high air pollution. In the longitude-average Hovemollar diagram
two hotspots (having an AOD value above 0.5) had found, 1st between 33.5 o-35o N from 29–30 July
2021and Second, from 6–8 August. However, in the latitude-average Hovemollar diagram, the AOD value
has been found below 0.7 before 5 August except for around 31.5oE on 29 July 2021. Afterward, a higher

                                                    Page 6/16
aerosol load, i.e., greater than 0.7 AOD values found on 5–7 August 2021 between 27.5o-30oE. The
increase in AOD had caused by the transport of particulate matter from the burning area. Latitude-
average diagram presents two hotspots, first around 31.5oE on 29 July indicates intense air pollution over
Manavgat.
Second, between 27.5o-30oE, during 5–7 August demonstrating high aerosol load that caused worse air
quality over eastern Mugla and western Antalya cities.. Figure 6 demonstrated the HYSPLIT model
(Bagheri et al., 2019; Bera et al., 2021; Draxler et al., 1998; Tariq et al., 2016) forward trajectories at the
height of 500m from the ground. The results demonstrate that the forward trajectories follow the south
and southeastern direction from their source at the height of 500 m from the ground.
4. Conclusions
In this paper, we examined the air pollution scenario in the Antalya and Mugla cities of Turkey before and
during the forest fire episode, i.e., for the period 27 July to 10 August 2021. The highest MAOD was found
to be 2.2 over northern Marmaris, Ula, southeastern Milas, Mugla Merkezon on 5 August 2021, indicating
worse air pollution over these regions. The daily average AOD value before the fire accusation, i.e., on 27
July, was 0.1 shows a clear sky with no aerosol load. However, as the fire breakouts on 28 July, this daily
average AOD value increased too rapidly and reached 0.52 on 6 August, indicating intense air pollution.
MODIS active fire data suggests that the intense fire activities have occurred in Gündogmus, Manavgat,
Köycegiz, Kavaklidere, Marmaris, Mugla Merkez, Bodrumand, and Milas districts. Mid-east Merkez and
Köycegiz had experienced the highest 167 µmol/m2 NO2 concentration. This followed by Yatagan, Milas,
Marmaris, Fethiye, and Dalaman districts of Mugla and Merkez of Antalya city. The highest HCHO
concentration was to be 750 µmol/m2 over southern Mugla city. Moreover, the peak 0.14 µmol/m2 O3
concentration was observed over the Mugla and central Antalya cities. At the Junction of Dalaman,
Köycegiz, and Ortaca, peak CO (0.08 mol/m2) and AI (3.5) had observed. The high-altitude smoke had
seen over Mugla city. Whereas, over Antalya, mixed aerosols had dominant, followed by smoke, dust, non-
smoke fine mode, and fine dominated aerosols. Mid-east Köycegiz, mid-north Mugla Merkez, southern
junction of Milas and Mugla Merkez, Ola and Marmaris, Ortaca and Köycegiz, southern Manavgat,
Gündogmus, and Alanya were the highly affected areas. HYSPLIT model forward trajectories suggest the
south and southeastern wind direction from their source at the height of 500 m from the ground.
Declarations
Data Availability
Data used in this study can be downloaded from the Giovanni website (http://giovanni.gsfc.nasa.gov).
Ethical Approval
Not required
Page 7/16Consent to Publish
Not Applicable
Consent to Participate
All authors participate in this research.
Authors Contributions
Salman Tariq conceptualizes the work and wrote the manuscript. Fazzal Qayyum make maps and wrote
the description. Usman Mehmood conducted analysis. Zia ul-Haq wrote the manuscript.
Funding
This work does not get any funding from any organization.
Competing Interests
Not Required
Availability of data and materials
Not required
Acknowledgments
We are also thankful to NOAA Air Resources Laboratory (ARL), MODIS, and Suomi NPP/VIIRS mission
scientists for the production of the data used in this research effort. We are also grateful to European
Space Agency (ESA) for providing Copernicus Sentinel data and products.
References
Alencar, A. A., Brando, P. M., Asner, G. P., & Putz, F. E. (2015). Landscape fragmentation, severe drought,
and the new Amazon forest fire regime. Ecological Applications, 25(6), 1493–1505.
https://doi.org/10.1890/14-1528.1
Atasoy, A., & Geçen, R. (2014). Forest Fires Occurred on Border Area between Turkey (Hatay) and Syria.
Procedia - Social and Behavioral Sciences, 120, 680–685.
https://doi.org/10.1016/J.SBSPRO.2014.02.149
Bagheri, R., Bagheri, F., Karami, G. H., & Jafari, H. (2019). Chemo-isotopes (18O & 2H) signatures and
HYSPLIT model application: Clues to the atmospheric moisture and air mass origins. Atmospheric
Environment, 215, 116892. https://doi.org/10.1016/J.ATMOSENV.2019.116892
Page 8/16Baker, J. C. A., & Spracklen, D. V. (2019). Climate Benefits of Intact Amazon Forests and the Biophysical
Consequences of Disturbance. Frontiers in Forests and Global Change, 0, 47.
https://doi.org/10.3389/FFGC.2019.00047
Bera, B., Bhattacharjee, S., Sengupta, N., & Saha, S. (2021). Variation and dispersal of PM10 and PM2.5
during COVID-19 lockdown over Kolkata metropolitan city, India investigated through HYSPLIT model.
Geoscience Frontiers, 101291. https://doi.org/10.1016/J.GSF.2021.101291
Butt, E. W., Conibear, L., Reddington, C. L., Darbyshire, E., Morgan, W. T., Coe, H., Artaxo, P., Brito, J., Knote,
C., & Spracklen, D. V. (2020). Large air quality and human health impacts due to Amazon forest and
vegetation fires. Environmental Research Communications, 2(9), 095001. https://doi.org/10.1088/2515-
7620/ABB0DB
Cano-Crespo, A., Oliveira, P. J. C., Boit, A., Cardoso, M., & Thonicke, K. (2015). Forest edge burning in the
Brazilian Amazon promoted by escaping fires from managed pastures. Journal of Geophysical Research:
Biogeosciences, 120(10), 2095–2107. https://doi.org/10.1002/2015JG002914
Cheng, Y., Wei, C., Pöhlker, M. L., Artaxo, P., Liu, L., Wang, S., Pöhlker, M., Pöhlker, C., Shrivastava, M.,
Andreae, M. O., Pöschl, U., & Su, H. (n.d.). Impact of biomass burning aerosols on radiation, clouds, and
precipitation over the Amazon during the dry season: dependence of aerosol-cloud and aerosol-radiation
interactions on... Impact of biomass burning aerosols on radiation, clouds, and precipitation over the
Amazon during the dry season: dependence of aerosol-cloud and aerosol-radiation interactions on
aerosol loading. https://doi.org/10.5194/acp-2020-191
Draxler, R. R., Spring, S., Maryland, U. S. A., & Hess, G. D. (1998). An Overview of the HYSPLIT_4 Modelling
System for Trajectories, Dispersion, and Deposition. Australian Meteorological Magazine, 47, 295–308.
El-Nadry, M., Li, W., El-Askary, H., Awad, M. A., & Mostafa, A. R. (2019). Urban Health Related Air Quality
Indicators over the Middle East and North Africa Countries Using Multiple Satellites and AERONET Data.
Remote Sensing 2019, Vol. 11, Page 2096, 11(18), 2096. https://doi.org/10.3390/RS11182096
Elvan, O. D., Birben, Ü., Özkan, U. Y., Yıldırım, H. T., & Türker, Y. Ö. (2021). Forest fire and law: an analysis of
Turkish forest fire legislation based on Food and Agriculture Organization criteria. Fire Ecology 2021 17:1,
17(1), 1–15. https://doi.org/10.1186/S42408-021-00102-7
H., N. R., M., B. M., Luke, C., Víctor, R. de D., G., C. H., Meaghan, J., Belinda, K., & A., B. R. (2020). Causes
and consequences of eastern Australia’s 2019-20 season of mega-fires. Global Change Biology,
ePub(ePub), ePub-ePub. https://doi.org/10.1111/gcb.14987
Heald, C. L., & Spracklen, D. V. (2015). Land Use Change Impacts on Air Quality and Climate. Chemical
Reviews, 115(10), 4476–4496. https://doi.org/10.1021/CR500446G
Page 9/16Johnston, F. H., Henderson, S. B., Chen, Y., Randerson, J. T., Marlier, M., DeFries, R. S., Kinney, P., Bowman,
D. M. J. S., & Brauer, M. (2012). Estimated global mortality attributable to smoke from landscape fires.
Environmental Health Perspectives, 120(5), 695–701. https://doi.org/10.1289/EHP.1104422
Kolusu, S. R., Marsham, J. H., Mulcahy, J., Johnson, B., Dunning, C., Bush, M., & Spracklen, D. V. (2015).
Impacts of Amazonia biomass burning aerosols assessed from short-range weather forecasts.
Atmospheric Chemistry and Physics, 15(21), 12251–12266. https://doi.org/10.5194/ACP-15-12251-2015
Lelieveld, J., Evans, J. S., Fnais, M., Giannadaki, D., & Pozzer, A. (2015). The contribution of outdoor air
pollution sources to premature mortality on a global scale. Nature 2015 525:7569, 525(7569), 367–371.
https://doi.org/10.1038/nature15371
Lyapustin, A., Wang, Y., Laszlo, I., Kahn, R., Korkin, S., Remer, L., Levy, R., & Reid, J. S. (2011). Multiangle
implementation of atmospheric correction (MAIAC): 2. Aerosol algorithm. Journal of Geophysical
Research Atmospheres, 116(3). https://doi.org/10.1029/2010JD014986
Lyapustin, Alexei, Martonchik, J., Wang, Y., Laszlo, I., & Korkin, S. (2011). Multiangle implementation of
atmospheric correction (MAIAC): 1. Radiative transfer basis and look-up tables. Journal of Geophysical
Research: Atmospheres, 116(D3), 3210. https://doi.org/10.1029/2010JD014985
Morgan, W. T., Darbyshire, E., Spracklen, D. V., Artaxo, P., & Coe, H. (2019). Non-deforestation drivers of
fires are increasingly important sources of aerosol and carbon dioxide emissions across Amazonia.
Scientific Reports 2019 9:1, 9(1), 1–15. https://doi.org/10.1038/s41598-019-53112-6
Ozdemir, E., Tuna Tuygun, G., & Elbir, T. (2020). Application of aerosol classification methods based on
AERONET version 3 product over eastern Mediterranean and Black Sea. Atmospheric Pollution Research,
11(12), 2226–2243. https://doi.org/10.1016/J.APR.2020.06.008
Qu, S., Chen, X., Wang, Y., Shi, P., Shan, S., Gou, J., & Jiang, P. (2018). Isotopic Characteristics of
Precipitation and Origin of Moisture Sources in Hemuqiao Catchment, a Small Watershed in the Lower
Reach of Yangtze River. Water 2018, Vol. 10, Page 1170, 10(9), 1170.
https://doi.org/10.3390/W10091170
Rao, W., Zhang, W., Yong, B., Tan, H., Meredith, K. T., Jin, K., Zheng, F., & Wang, S. (2018). Identifying the
source of atmospheric moisture over arid deserts using stable isotopes (2H and 18O) in precipitation.
Hydrological Processes, 32(3), 436–449. https://doi.org/10.1002/HYP.11431
Sowden, M., Mueller, U., & Blake, D. (2018). Review of surface particulate monitoring of dust events using
geostationary satellite remote sensing. Atmospheric Environment, 183, 154–164.
https://doi.org/10.1016/J.ATMOSENV.2018.04.020
Spracklen, D. V., Arnold, S. R., & Taylor, C. M. (2012). Observations of increased tropical rainfall preceded
by air passage over forests. Nature 2012 489:7415, 489(7415), 282–285.
Page 10/16https://doi.org/10.1038/nature11390
Spracklen, D. V., & Garcia-Carreras, L. (2015). The impact of Amazonian deforestation on Amazon basin
rainfall. Geophysical Research Letters, 42(21), 9546–9552. https://doi.org/10.1002/2015GL066063
Tariq, S., Zia, ul H., & Ali, M. (2016). Satellite and ground-based remote sensing of aerosols during intense
haze event of October 2013 over lahore, Pakistan. Asia-Pacific Journal of Atmospheric Sciences, 52(1),
25–33. https://doi.org/10.1007/s13143-015-0084-3
Van Der Werf, G. R., Randerson, J. T., Giglio, L., Van Leeuwen, T. T., Chen, Y., Rogers, B. M., Mu, M., Van
Marle, M. J. E., Morton, D. C., Collatz, G. J., Yokelson, R. J., & Kasibhatla, P. S. (2017). Global fire emissions
estimates during 1997-2016. Earth System Science Data, 9(2), 697–720. https://doi.org/10.5194/ESSD-9-
697-2017
Veefkind, J. P., Aben, E. A. A., McMullan, K., Forster, H., Vries, J. de, Otter, G., Claas, J., Eskes, H. J., Haan, J.
F. de, Kleipool, Q., Weele, M. van, Hasekamp, O., Hoogeveen, R., Landgraf, J., Snel, R., Tol, P. J. J., Ingmann,
P., Voors, R., Kruizinga, B., … Visser, H. (2012). TROPOMI on the ESA Sentinel-5 Precursor: A GMES mission
for global observations of the atmospheric composition for climate, air quality and ozone layer
applications. Remote Sensing of Environment, 120(SI), 70–83.
https://doi.org/10.1016/J.RSE.2011.09.027
Wei, X., Bai, K., Chang, N.-B., & Gao, W. (2021). Multi-source hierarchical data fusion for high-resolution
AOD mapping in a forest fire event. International Journal of Applied Earth Observation and
Geoinformation, 102, 102366. https://doi.org/10.1016/J.JAG.2021.102366
Wiedinmyer, C., Akagi, S. K., Yokelson, R. J., Emmons, L. K., Al-Saadi, J. A., Orlando, J. J., & Soja, A. J.
(2011). The Fire INventory from NCAR (FINN): A high resolution global model to estimate the emissions
from open burning. Geoscientific Model Development, 4(3), 625–641. https://doi.org/10.5194/GMD-4-
625-2011
Wu, H., Zhang, X., Xiaoyan, L., Li, G., & Huang, Y. (2015). Seasonal variations of deuterium and oxygen-18
isotopes and their response to moisture source for precipitation events in the subtropical monsoon
region. Hydrological Processes, 29(1), 90–102. https://doi.org/10.1002/HYP.10132
Zielinski, T., Petelski, T., Strzalkowska, A., Pakszys, P., & Makuch, P. (2016). Impact of wild forest fires in
Eastern Europe on aerosol composition and particle optical properties. Oceanologia, 58(1), 13–24.
https://doi.org/10.1016/j.oceano.2015.07.005
Figures
Page 11/16Figure 1
MODIS-derived active fire location from 28 July to 10 August 2021.
Page 12/16Figure 2
Spatial-temporal distribution of AOD before (27 July 2021) and during (28-10 August 2021) the forest fire
episode over Mugla and Antalya city of Turkey.
Page 13/16Figure 3
Spatial distribution of TROPOMI-derived AI, CO (mol/m2), O3 µmol/m2), NO2 (µmol/m2), and HCHO
(µmol/m2).
Figure 4
Page 14/16Aerosol classification on 27 July (before) and 5-6 August 2021 (during forest fire event) over Antalya and
Mugla cities.
Figure 5
Longitude (left) and latitude-averaged (right) Hovemollar diagram from 27 July to 10 August 2021.
Figure 6
HYSPLIT model forward trajectory demonstrating particles distribution direction path.
Supplementary Files
Page 15/16This is a list of supplementary files associated with this preprint. Click to download.
ForestfireTurkeyGraphicalAbstract4.docx
Page 16/16You can also read