Barclays CEO Energy-Power Conference - September 2021 - cloudfront.net
←
→
Page content transcription
If your browser does not render page correctly, please read the page content below
Barclays CEO
Energy-Power Conference
 September 2021
Legal Disclaimer
 This presentation includes “forward-looking statements.” Such forward-looking statements are subject to a number of risks and uncertainties,
 many of which are not under AR’s control. All statements, except for statements of historical fact, made in this presentation regarding activities,
 events or developments AR expects, believes or anticipates will or may occur in the future, such as those regarding expected results, future
 commodity prices, future production targets, completion of natural gas or natural gas liquids transportation projects, future earnings, future
 capital spending plans, improved and/or increasing capital efficiency, continued utilization of existing infrastructure, gas marketability, estimated
 realized natural gas, natural gas liquids and oil prices, acreage quality, access to multiple gas markets, expected drilling and development plans
 (including the number, type, lateral length and location of wells to be drilled, the number and type of drilling rigs and the number of wells per
 pad), projected well costs and cost savings initiatives, future financial position, future technical improvements, future marketing and asset
 monetization opportunities, the amount and timing of any contingent payments, the participation level of our drilling partner and the financial and
 operational results to be achieved as a result of the drilling partnership, estimated Free Cash Flow and the key assumptions underlying its
 projection and AR’s environmental goals are forward-looking statements within the meaning of Section 27A of the Securities Act of 1933 and
 Section 21E of the Securities Exchange Act of 1934. All forward-looking statements speak only as of the date of this presentation. Although AR
 believes that the plans, intentions and expectations reflected in or suggested by the forward-looking statements are reasonable, there is no
 assurance that these plans, intentions or expectations will be achieved. Therefore, actual outcomes and results could materially differ from what
 is expressed, implied or forecast in such statements. Except as required by law, AR expressly disclaims any obligation to and does not intend to
 publicly update or revise any forward-looking statements.

 AR cautions you that these forward-looking statements are subject to all of the risks and uncertainties incident to the exploration for and the
 development, production, gathering and sale of natural gas, NGLs and oil, most of which are difficult to predict and many of which are beyond
 AR’s control. These risks include, but are not limited to, commodity price volatility, inflation, lack of availability of drilling and production
 equipment and services, environmental risks, drilling and other operating risks, regulatory changes, the uncertainty inherent in estimating
 natural gas and oil reserves and in projecting future rates of production, cash flow and access to capital, the timing of development
 expenditures, impacts of world health events, including the COVID-19 pandemic, cybersecurity risks and the other risks described under the
 heading "Item 1A. Risk Factors" in AR’s Annual Report on Form 10-K for the year ended December 31, 2020.

 Any forward looking statement speaks only as of the date on which such statement is made and AR undertakes no obligation to correct or
 update any forward looking statement whether as a result of new information, future events or otherwise, except as required by applicable law.

 This presentation also includes (i) Free Cash Flow, (ii) Adjusted EBITDAX, (iii) Net Debt and (iv) leverage which are a financial measures that
 are not calculated in accordance with U.S. generally accepted accounting principles (“GAAP”). Please see “Antero Non-GAAP Measures” for
 definitions of these measures as well as certain additional information regarding these measures.

 Antero Resources Corporation is denoted as “AR” in the presentation and Antero Midstream Corporation is denoted
 as “AM”, which are their respective New York Stock Exchange ticker symbols.

• Antero Resources | May 2019 Presentation 2
Antero Family at a Glance

 50/50 JV

Exploration & Gathering & Natural Gas C3+ NGL
 Production Compression Processing Fractionation

 Water Delivery
 & Blending

 3
Antero Resources Snapshot
 Denver, CO Antero Resources Acreage Map
 HEADQUARTERS Antero Marcellus Rig
 Industry Marcellus Rig

 $7.7 B Industry Utica Rig
 Antero Acreage
 ENTERPRISE VALUE (1) SW Marcellus Core
 Ohio Utica Core
 4th Largest
 U.S. GAS PRODUCER (2)

 2nd Largest
 U.S. NGL PRODUCER (2)

 Own 38%
 OF CORE LIQUIDS-RICH UNDRILLED
 LOCATIONS IN APPALACHIA(3)

 ~950
 ADDITIONAL DRY GAS LOCATIONS
 IN DRILLING INVENTORY (3)
 Core Liquids-Rich Appalachian
 $750 MM+ Undrilled Locations(3)

 Forecast Free Cash Flow in 2021 (4)
 )

 29% Midstream
 AR Peers
 ~38% ~62%

 AM VALUE HELD BY AR $1.4 B
Note: Hedge position as of 6/30/21. Rigs on map as of 8/31/21, per Rig data. AM value
based on 9/1/21 share price.
1) Market data as of 9/1/2021.
2) Natural gas and NGL rankings based on 2Q21 reported production.
3)
4)
 AR drilling inventory as of 12/31/2020. Industry location count based on Antero technical analysis of undeveloped acreage in the core of the Marcellus and Ohio Utica Shales.
 Free Cash Flow is a Non-GAAP metric. Please see appendix for additional disclosures, definitions, and assumptions. 4
Antero Strategy Evolution
 Antero’s business strategy has evolved to match the U.S. shale industry life cycle
 AR Net Production (Right Axis) & Capital Investment (Left Axis)
 ($MMs) (1) (MMcfe/d)
 We are
 $3,500 Production (MMcfe/d) Capital Spend here 4,000
 $3,000 3,500

 $2,500 3,000
 2,500
 $2,000
 2,000
 $1,500
 1,500
 $1,000 1,000
 $500 500
 $0 -
 2011 2012 2013 2014 2015 2016 2017 2018 2019 2020 2021E 2022E
 Shale 1.0 Shale 2.0 Shale 3.0
 • Acquire acreage • Grow production • Maintain production
 • Support infrastructure • Aggressively hedge • Generate Free Cash Flow
 through long-term • Consolidate acreage • Reduce debt &
 commitments commitments
 • Innovate through drilling and
 • Delineate resource • Sustain low leverage
 completion techniques
 • Maintain commodity
 • Access low cost capital
 exposure
 • Optimize FT
 • Return capital
 • Prioritize ESG
1) Represents drilling and completion + leasehold capital expenditures. 5
Positioned for Success in Shale 3.0 World
 Antero is well positioned with a strong balance sheet and differentiated
 operating leverage to higher commodity prices

 Peer-leading
 6 ESG Performance

 Sustainable
 5 Development and
 Free Cash Flow
 Supportive
 4 Commodity
 Fundamentals

 Optimal
 3 Takeaway Capacity

 Deep Liquids-Rich
 2 Inventory

 Strong
1 Balance Sheet
 6
1 Peer Leading Debt & Leverage Reduction
 Sustainable long-term leverage reduction is achieved only through absolute debt
 reduction, not just EBITDA expansion in a commodity price upswing
 Year-over-Year Change in Total Debt (1)
 $1,000 $876 Absolute
 $581
 $500
 Debt
 $0

 ($500) ($274) ($188)

 ($1,000) EBITDA
 ($1,103)
 ($1,500)
 AR CNX RRC SWN EQT

 Y-O-Y LTM EBITDAX Change ($MM) (2) Net Debt to LTM EBITDAX (6/30/2021)
 $500 5.0x
 $427
 $400 3.9x
 $332 4.0x
 $300 3.0x
 3.0x 2.6x
 2.4x
 $200
 $86 2.0x 1.7x
 $100 $40
 $0 1.0x
 ($19)
($100) 0.0x
 AR SWN RRC EQT CNX AR CNX SWN EQT RRC
Source: Company public filings and press releases.
Note: Please see appendix for additional disclosures, definitions, and assumptions.
1)
2)
 As of 6/30/2021.
 Represents year-over-year change in LTM EBITDAX from 2Q 2020 to 2Q 2021.
 7
1 Strong and Sustainable Balance Sheet

 AR has no near-term senior note maturities and has reset debt levels to insulate
 leverage against a downside commodity price scenario

 Antero Resources Debt Term Structure (Pro Forma 6/30/2021) (1)
 AR Senior Notes
 $2,000 AR Convertible Notes
 $1,800 AR Credit Facility
 $1,600 No near-term senior
 note maturities
 $1,400
 $1,200
 $1,000
 $800 $700
 $590 $600
 $600
 $407
 $400 (1)
 $82
 $185 (1)
 $200 $325
 5.00% 8.375% 7.625% 5.375%
 $0
 2020 2021 2022 2023 2024 2025 2026 2027 2028 2029 2030

 $2.0 Billion Absolute Debt Target is Designed to Limit Leverage
 in the Event of a Commodity Cycle Downturn

 8
Note: Please see appendix for additional disclosures, definitions, and assumptions.
(1) Pro forma for the redemption of $175 MM of the 2026 Senior Notes at $108.375, plus accrued and unpaid interests.

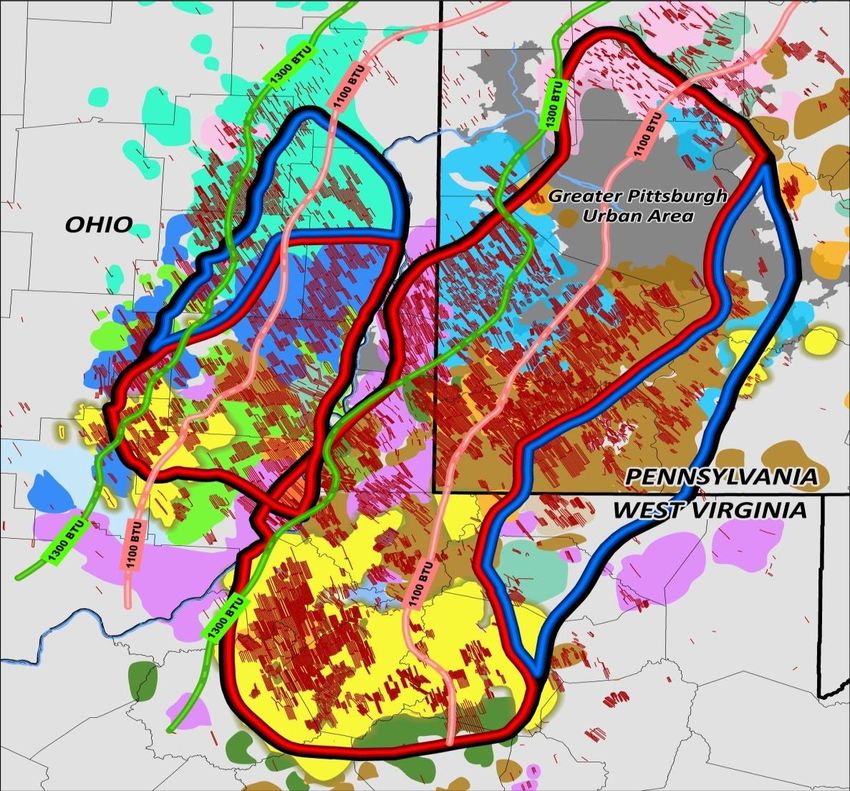
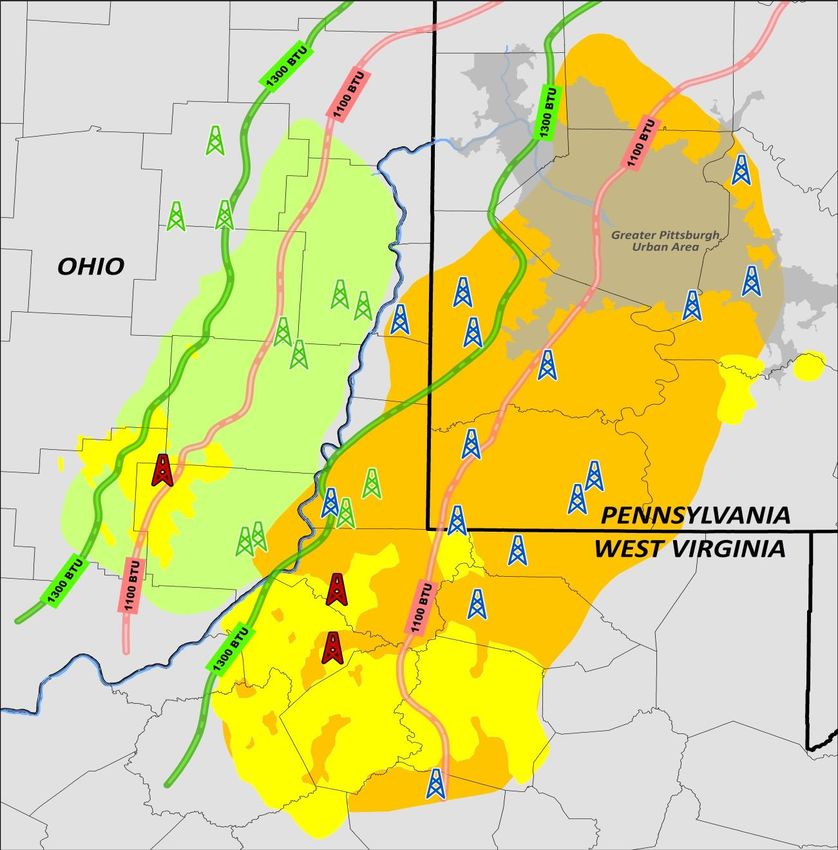
2 Peer Leading Premium Core Drilling Inventory
 Antero’s technical and management teams have performed an extensive update on acreage
 positions, undrilled locations, well performance and EURs across the basin
 – Led to division of the SW Marcellus and Ohio Utica into Premium Core and Tier 2 Core acres

 Premium Core Marcellus Inventory: SW Appalachia Core
 • ~5,200 undeveloped locations
 • AR holds ~1,865 locations, or 36% Utica Core
 Premium Core Utica Inventory:
 • ~1,100 undeveloped locations
 • AR holds ~210 locations, or 19%

 Premium Liquids-Rich
 Core Undrilled Locations

 Peers
 62%
 AR
 38%

 Tier 2 Core Marcellus Inventory:
 • ~1,600 undeveloped locations SW Marcellus
 • AR holds ~150 locations, or 9% Core

 Antero Leasehold & Minerals
 Drilled Wells
Notes: AR drilling inventory as of 12/31/2020. Industry location count based on Antero technical analysis of undeveloped acreage in the core of the Marcellus and Ohio Utica Shales. 9
3 Right-Sizing Firm Takeaway Commitments
 AR’s under-utilized firm transportation commitments are expected to decline by
over 1.0 Bcf/d by year-end 2025, resulting in a >$100+ MM reduction in annualized
 net marketing expense and an optimized takeaway position to premium demand
 markets
 Firm Transportation (Year-End)
 BBtu/d AR Gross Residue Gas Forecast - Drilling Partnership

 200 MMcf/d, or $30 MM annualized,
 4,500 of unutilized Midwest capacity
 4,147 Appalachia
 rolling off October 2021
 4,000 Regional FT
 3,757
 3,652
 3,500 3,377 3,330
 3,130
 3,000
 TCO
 2,500
 Midwest
 2,000
 Premium
 1,500
 FT
 1,000 U.S. Gulf Coast

 500
 Atlantic Seaboard
 -
 12/31/19 12/31/20 12/31/21 12/31/22 12/31/23 12/31/24 12/31/25

Note: Please see appendix for additional disclosures, definitions, and assumptions.
 10
3 Diversity of Product & Destination
 Antero’s liquids-rich strategy and diversified firm transportation portfolio allows
 it to capture commodity price upside both domestically and internationally
 Leader in Liquids Production Leader in Premium Natural Gas
 and Realized Pricing Takeaway and Realized Pricing (2)
 Liquids Production (MBbl/d) (1) Percent Sold Out of Basin
 200 120%
 171 AR leaves ~150 MBbl/d 100%
 of ethane in the gas 100%
 stream 83%
 150
 80%
 107 104
 100 60% 49% 49% 44%
 47 40%
 50
 16 20%
 - 0%
 AR RRC SWN EQT CNX AR RRC CNX EQT SWN

 C2+ NGL Price as % of WTI (1) Price Differential to NYMEX (3)
 60% $0.40 $0.28
 50%
 50% 45% 44% $0.20
 42%
 40% 37%
 $0.00
 30% ($0.20)
 20% ($0.21) ($0.25) ($0.26)
 ($0.40)
 10% ($0.60)
 0% ($0.80) ($0.74)
 AR CNX RRC EQT SWN AR CNX RRC EQT SWN
Source: Company presentation and filings.
1) Represents 1H21 results. Liquids production includes C2+ NGLs and oil.
2)
3)
 Based on company disclosure of firm transportation commitments.
 Represents 1H21 results. AR price differential excludes $0.38/Mcf positive impact from 1Q21 WGL settlement. 11
3 FT Protects Basis and Provides Flow Assurance
 AR’s firm transportation portfolio provides price stability, production flow
 assurance, and premium pricing vs. Appalachia-dependent producers
 Antero Basis vs. Appalachia Basis ($/Mcf)
 (1) (2)
 Appalachia Differentials Antero Realized Differential
 Appalchian Average Basis Antero Average Basis

 AR’s 2Q21 realized price was an $0.18/Mcf
 $2.00
 Since the beginning of 2018, AR had premium to NYMEX vs. an average
 Appalachian discount of ($0.72)/Mcf
 Antero Basis
 access to its entire FT portfolio and
 has realized an average $0.11/Mcf
 $1.50 premium to NYMEX over that time
 • Low volatility, high
 reliability
 $1.00
 • Premium to NYMEX
 AR • “Insurance policy” for
 +$0.11 2Q21: consistent production
 $0.50 +$0.18
 flow
 • Ability to hedge NYMEX
 $0.00 Henry Hub index
 Appalachia
 ($0.50) 2Q21:
 ($0.82) ($0.72) Appalachia Basis
 ($1.00)
 • High volatility, low
 reliability
 ($1.50) • Significant discount to
 NYMEX
 ($2.00) • Frequent shut-ins
 • Less liquid hedge
 markets
Note: Pricing reflects pre-hedge pricing.
1)
2)
 Reflects discount to NYMEX for Appalachia in-basin pricing at Dominion South & TETCO M2 indices.
 Represents simple average discount to NYMEX for Antero firm transportation capacity. Includes BTU adjustment for 1100 BTU gas. 12
4 Propane Market Fundamentals
 A repeat of the same weekly withdrawals as last winter would result in the U.S.
 ending withdrawal season with only about 12 million barrels in storage,
 significantly below 5-year minimum storage level

 U.S. Propane Inventories (MMBbls)
 120
 2021 injection season
 projected to end at ~75
 100 MMBbls per industry
 estimates

 80
 Million Barrels

 2020
 60
 Repeating winter
 2021E
 2020-2021 weekly

 40 2021

 20
 2022E

 ...Results in ending withdrawal
 season at only ~12 MMBbls,
 0 or just 4 to 6 days of supply
 Jan Feb Mar Apr May Jun Jul Aug Sep Oct Nov Dec

 5-Yr Range 2020 5-Yr Avg 2016-2020 2021 Actual 2021 Forecast 2022 Forecast

Source: EnVantage Inc. and Energy Information Administration (EIA) as of 9/3/21. 13
5 Natural Gas Fundamentals Are Strong
 U.S. production growth has meaningfully slowed and exports
 have increased dramatically compared to 2018
 U.S. Dry Natural Gas Production – Lower 48 (Bcf/d)
 +0.1 Bcf/d per month
100.0 +0.5 Bcf/d per month Jan-20:
 94.3 Jan-21: Aug-21:
 95.0 +1 Bcf/d per month Jan-19: 92.9
 91.6
 90.0 87.9
 +0.6 Bcf/d per month
 85.0 Jan-18:
 77.1
 80.0
 75.0 Jan-17:
 69.6
 70.0
 65.0
 60.0

 U.S. LNG Exports (Bcf/d) Mexico Exports (Bcf/d)
 12.0 7.0
 10.6 5.9
 10.0 6.0 5.4
 5.1
 5.0 4.6
 8.0 7.3 4.2
 5.7 4.0
 6.0
 3.0
 4.0 3.4
 2.2 2.0
 2.0 1.0
 - -
 2017 2018 2019 2020 2021E 2017 2018 2019 2020 2021E
Source: Point Logic for U.S. dry natural gas production and Platts for LNG exports and Mexico exports. 14
5 Strategy Transition For Commodity Price Exposure
 AR’s significant scale, strong balance sheet, commodity product diversity and
 development program flexibility allows AR to capture commodity price upside
 AR Hedges as a % of Guided Production at January 1 of Each Year
 100%
 80%
 60%
 40%
 20%
 0%
 2014 2015 2016 2017 2018 2019 2020 2021E 2022E 2023E

 Prudent Hedging Strategy Prudent Exposure Strategy
 • Single commodity product (dry gas only) • Diversity of product (NGLs & Oil)
 • Growth mode to achieve scale • Maintenance capital mode to harvest free
 • Unutilized FT and less flexible capital cash flow
 budget • Utilized FT and flexible capital budget to
 • Northeast basis exposure & shut-in risk commodity prices

 • Near-term maturities • NYMEX exposure & flow assurance

 • Contango futures prices • Pushed out maturities 4+ years
 • Backwardated futures prices
Note: Percent of production hedged assumes 2021 production guidance and maintenance mode, or flat
production thereafter. • Bullish supply / demand fundamentals 15
5 Peer Hedging Comparison
 Antero has not added any natural gas hedges in ~18 months and is unhedged on
 its 4Q21 and going forward liquids production

 % Hedged 2022 Total Production and Natural Gas Production (1)

 % Total Production Hedged % Natural Gas Production Hedged
 100% 95%
 89%
 90% 87%

 80%
 Peer average hedged natural
 69% gas production: 74%
 70% 72%
 Peer average hedged total
 60%
 production: 59%
 50%
 50%
 43% 44%
 40%
 34% 34%
 30%

 20%

 10%

 0%
 AR RRC SWN EQT CNX

 16
1) Represents percent of hedged 2022 total production and natural gas production. 2022 production based on consensus production as of 8/3/2021. Hedge positions as of 6/30/2021 for peers based on company
 filings and 9/7/2021 for AR.
5 Significant Commodity Price Leverage
 As one of the largest natural gas and NGL producers in the U.S., Antero has
 significant cash flow upside in a rising commodity price environment
 Top 5 U.S. Natural Gas Producers (MMcf/d) Top 5 U.S. NGL Producers (MBbls/d)
 5,000 250
 4,333 4th largest U.S. Natural
 4,500 2nd largest NGL
 Gas producer 200
 4,000 200 producer
 3,500 163
 2,804 147
 3,000 150 48 139
 MMcf/d

 2,407 129
 2,500 2,287 2,205 Ethane
 2,000 100 115
 1,500 C3+
 1,000 50 NGLs
 500
 - -
 EQT XOM SWN AR COG OXY AR PXD EOG DVN

 AR Leverage to Natural Gas Prices ($MM) (1) AR Leverage to C3+ NGL Prices ($MM) (2)
 $450 $417 $450 $419
 Every $0.10 per Every $2 per Bbl move
 $400 $400
 MMBtu move in natural in C3+ NGL prices results $335
 $350 $334 $350
 gas prices results in an in a $84 MM unhedged
 $300 $83 MM unhedged $300 annual revenue impact (2)
 $250 $251
 $250
 annual revenue impact (1) $250
 $200 $167 $200 $167
 $150 $150
 $100 $83 $100 $84

 $50 $50
 $0 $0
 +$0.10 / +$0.20 / +$0.30 / +$0.40 / +$0.50 / +$2.00 / +$4.00 / +$6.00 / +$8.00 / +$10.00 /
 MMBtu MMBtu MMBtu MMBtu MMBtu Bbl Bbl Bbl Bbl Bbl
Note: Natural gas and NGL producer rankings reflect company 2Q21 reports and public filings.
1) Assumes 2Q 2021 natural gas production of 2.3 Bcf/d. 2.2 Bcf/d of AR natural gas volumes are hedged through 2021 at a weighted average of $2.77/MMBtu and 1.2 Bcf/d hedged in 2022 at a weighted average

 17
 price of $2.50/MMBtu.
2) Assumes 2Q 2021 C3+ NGL production of 115 MBbl/d.
5 Enhanced Free Cash Flow Profile
 Antero expects to generate over $3.5 B of Free Cash Flow through 2025

 Free Cash Flow (Before Changes in Working Capital) ($MM)

 2021E – 2025E Free Cash Flow:
 Free Cash Flow Outspend 07/22/2021 Strip Pricing (1)
 $4,000
 $3,500+
 $3,500

 $3,000

 $2,500

 $2,000

 $1,500
 5-Year Avg. Strip
 Through YE 2025
 $1,000 $750+ NYMEX: $3.03/MMBtu
 WTI: $61/Bbl
 $500
 C3+ NGLs: $37/Bbl
 $0

 ($500)

 ($1,000)
 2018A 2019A 2020A 2021E 2022E 2021E - 2025E
 Cumulative FCF
 (5-year strip)
Note: Free Cash Flow, which is shown before changes in working capital, is a Non-GAAP metric. Excludes $51 MM contingent payment expected to be received in 2Q 2021 contingent on volume thresholds. Please
see appendix for additional disclosures, definitions, and assumptions.

 18
1) Assumes strip pricing as of 7/22/2021. 2021 strip pricing reflects NYMEX natural gas average price of $3.36/MMBtu, WTI oil price of $66/Bbl and Mont Belvieu C3+ NGL pricing of ~$46/Bbl . 2022 – 2025 strip
 pricing reflects NYMEX natural gas average price of $2.94/MMBtu, WTI oil price of $60/Bbl and Mont Belvieu C3+ NGL pricing of ~$36/Bbl.
6 ESG Momentum Continues
 Antero’s peer-leading ESG ranking reflects the internal efforts
 to prioritize ESG performance and disclosures

 2025 Goals Progress

 World Bank Zero Routine
 Flaring Initiative (1):
 COMMITMENT TO NO ROUTINE
 FLARING IN 2021
 Project Canary (July 2021):
 ANNOUNCED PILOT TO PURSUE
 RESPONSIBLY SOURCED GAS
 CERTIFICATION

 2020 ESG Report
 (October 2021):
 MSCI UPGRADE PUBLISH DATE IS EXPECTED
 (August 2021): TO DRIVE FURTHER RATINGS
 UPSIDE
 BBB ESG RATING
1) Antero has not flared produced natural gas since the infancy of the Marcellus and Utica shale projects in West Virginia and Ohio. 19
The Antero Investment Opportunity
 Antero is positioned to deliver sustainable Free Cash Flow,
 with a peer-leading leverage profile

 Strong • Leverage at 1.7x and targeting below 1.5x at YE 2021 (1)
 Balance • Absolute debt reduction of $800 MM in 2020 and over $900 MM
 Sheet expected in 2021

 Scale and • 2nd Largest NGL Producer in the U.S.
 Operating • 4th Largest Natural Gas Producer in the U.S.
 Leverage • Differentiated operating leverage to higher commodity prices

 Sustainable • $750 MM+ of forecast Free Cash Flow in 2021 (2)
 • $3.5 B+ of forecast Free Cash Flow through 2025 (2)
 Business • Over 2,000 premium undeveloped premium core locations
 Model • ~$1.48/MMBtu natural gas breakeven price, unhedged (3)

 • One of the industry’s lowest GHG emission intensity metrics
 • No routine flaring – very low methane leak loss rate (0.046%)
 Leading
 • 83% of produced water generated was reused/recycled in 2020
 ESG Metrics • Partner with Project Canary for Responsibly Sourced Gas certification
 • Goal to reach net zero carbon emissions by 2025
1) Leverage is a non-GAAP metric, which represents approximate debt to LTM Adjusted EBITDAX level as of 6/30/2021
2) Free Cash Flow, which is shown before changes in working capital, is a non-GAAP metric. Excludes $51 MM contingent payment received in 2Q 2021 relating to the ORRI transaction. Please see appendix for
 additional disclosures, definitions, and assumptions.
3) Represents AR internal 2021-2022 weighted average breakeven price and is defined as full cycle pre-tax ROR of 15%. Assume WTI price of $70.89Bbl and $65.92/Bbl in 2021 and 2022, respectively.
 Assumes C3+ NGL price of $50.22/Bbl and $41.04/Bbl in 2021 and 2022, respectively. 20
Appendix
Antero Guidance and Long-Term Target Assumptions
 Long-term Outlook Assumptions (Consistent in
 2021 2021-2025
 both Base Plan and Drilling Partnership plans)
 NYMEX Henry Hub Natural Gas Price ($/MMBtu) (1) $3.36 $2.94
 NYMEX WTI Oil Price ($/Bbl) (1) $66.61 $59.53
 AR Weighted C3+ NGL Price ($/Bbl) (1) $46.33 $35.75
 Marcellus Well Costs ($MM / 1,000’ assuming 12,000 ft lateral) $660 / 1,000’ $635 / 1,000’
 AR ownership in AM (shares) and annual AM dividend per share (2) 139 MM shares ($0.90/share annual dividend)

 Base Plan (Maintenance Capital) Assumptions: 2021 2021-2025
 Annual Net Production (MMcfe/d) 3,300 – 3,400
 Wells Drilled 65 - 70 250 (3)
 Wells Completed 60 - 65 255 (3)
 Cash Production & Net Marketing Expense ($/Mcfe) (4) $2.30 - $2.35 $2.18 - $2.23 (5)
 G&A Expense (before equity-based compensation) ($/Mcfe) $0.08 - $0.10

 Drilling Partnership Assumptions: 2021 2021-2025
 Annual Production Net to AR (MMcfe/d) 3,300 – 3,400
 Wells Drilled (Gross) 80 - 85 310 (3)
 Wells Completed (Gross) 65 - 70 315 (3)
 Cash Production & Net Marketing Expense ($/Mcfe)(3) $2.29 - $2.36 $2.10 – $2.15 (5)
 G&A Expense (before equity-based compensation) ($/Mcfe) $0.08 - $0.10
1) Represents Mont Belvieu strip pricing as of 7/22/2021 assuming C3+ NGL component barrel consists of 56% C3 (propane), 10% isobutane (Ic4), 17% normal butane (Nc4) and 17% natural gasoline (C5+).
2) AM dividend determined quarterly by the Board of Directors of Antero Midstream.
3) Represents well counts through 2024 to align with drilling JV term.
4)
5)
 Includes lease operating expense, gathering, compression, processing, transportation, production & ad valorem taxes and net marketing expense. Excludes cash G&A.
 Represents average cash production and net marketing expense for 2022 – 2025. 22
Focus on Liquids Rich Drilling
 Antero currently recovers only 30% of the ethane in its rich gas stream while
 rejecting 70% of the ethane, sending it to pipeline sales in the natural gas stream
 Antero NGL Barrel Composition (2021 Guidance)
 Remaining 70% of ethane
 Natural Gas 1100 BTU Gas stays in natural gas stream
 Processing and enhances gas BTU Ethane (C2)
 ~128,000 Bbl/d of C2 50,000 Bbl/d

 165,000 Bbl/d C2+ NGLs
 1250 BTU Rich Gas

 AR recovers ~30% of ethane ~115,000 Bbl/d C3+ NGLs
 in its rich gas stream

 Ethane
 ~50,000 Bbl/d
 30% of Barrel

 Propane (C3) 56%
 Liquids
 Rich
 Production C3+ NGLs
 ~115,000 Bbl/d

 70% of Barrel Normal Butane (C4) 17%

 IsoButane (iC4) 10%

 Pentanes (C5+) 17%
 AR’s C2+ NGL Barrel
 Composition AR’s C3+ NGL Barrel
 Composition
 23
Note: Based on Antero 2021 production guidance. Antero C3+ NGL component barrel consists of 56% C3 (propane), 10% isobutane (Ic4),
17% normal butane (Nc4) and 17% natural gasoline (C5+).
Balance Capex with Cash Flow – Low Maintenance Capital
 Antero Average Development Well
 3,600
 Net Production Rate: 3.4 Bcfe/d Avg. Lateral Length per Well 13,000’
 3,400
 Bcfe/1,000’ 2.70
 3,200 Replacement Volume 198 Bcfe
 ~16% of 2022 Volume Wellhead Gas BTU 1265
 3,000
 Well Cost ($660/ft) $8.6 MM
 2,800
 2,600 Net F&D Cost $0.288 Mcfe

 2,400 C2 Recovery (1) 40%

 2,200 Well Spacing 830’

 2,000 First Year Recovery Volumes
 Gross (Bcfe) 6.05
 Net (Bcfe) 5.14

 Maintenance Capital Calculation Field and Operating Capital
 • The average AR rich Marcellus well • Roads
 produces 3.16 Bcfe net in the calendar • Working interest
 year when brought online mid-year optimization
 • Assume new wells average ½ year of • Pad construction costs
 production

 Production can be held flat with ~63 wells Maintenance Field
 $556 MM
 198 ÷ 3.16
 Capital: Maintenance D&C
 = 63
 Capital
 Maintenance D&C Capital ~$14 MM
 63 $8.6 =

 $542 MM
Note: Maintenance capital is net of VPP transaction. Net F&D cost assumes 85% net revenue interest. Net F&D is a non-GAAP financial measure, see the appendix for more information.
1) Reflects increased ethane volume with start up of Shell Cracker in 2022. Ethane sold at a premium to natural gas price.
 24
 24
Recent Wells Fargo ESG Ranking Antero’s peer leading ESG ranking reflects the Wells Fargo U.S. E&P internal efforts to prioritize ESG performance ESG Scorecard and disclosures Wells Fargo ESG scorecard report highlights: • AR ranked #2 for U.S. E&Ps – #1 for the “E” (50% weighting). Benefiting from zero flaring, low GHG Emissions, water management, and scope 1 reporting. – Zero routine flaring – Peer leading GHG emissions – Industry leading water management – Ambitious 2025 Net Zero Scope 1 goals – 2nd quartile ranking for “S” (20% weighting), we believe there is low hanging fruit for improvement (ie: community engagement policies). Natural gas companies have competitive advantage over oil companies in the ESG landscape Updated ESG data and disclosures aligned with the SASB Standards TCFD recommendations will be published later this year Source: Wells Fargo Securities LLC estimates from 3/29 report. 25
Antero Non-GAAP Measures
Adjusted EBITDAX: Adjusted EBITDAX as defined by the Company represents income or loss, including noncontrolling interests, before interest
expense, interest income, gains or losses from commodity derivatives and marketing derivatives, but including net cash receipts or payments on
derivative instruments included in derivative gains or losses other than proceeds from derivative monetizations, income taxes, impairment, depletion,
depreciation, amortization, and accretion, exploration expense, equity-based compensation, contract termination and rig stacking costs, simplification
transaction fees, and gain or loss on sale of assets. Adjusted EBITDAX also includes distributions received with respect to limited partner interests in
Antero Midstream Partners common units prior to the closing of the simplification transaction on March 12, 2019.
The GAAP financial measure nearest to Adjusted EBITDAX is net income or loss including noncontrolling interest that will be reported in Antero’s
condensed consolidated financial statements. While there are limitations associated with the use of Adjusted EBITDAX described below, management
believes that this measure is useful to an investor in evaluating the Company’s financial performance because it:
• is widely used by investors in the oil and natural gas industry to measure operating performance without regard to items excluded from the
 calculation of such term, which may vary substantially from company to company depending upon accounting methods and the book value of
 assets, capital structure, and the method by which assets were acquired, among other factors;
• helps investors to more meaningfully evaluate and compare the results of Antero’s operations from period to period by removing the effect of its
 capital and legal structure from its consolidated operating structure; and
• is used by management for various purposes, including as a measure of Antero’s operating performance, in presentations to the Company’s
 board of directors, and as a basis for strategic planning and forecasting. Adjusted EBITDAX is also used by the board of directors as a
 performance measure in determining executive compensation.
There are significant limitations to using Adjusted EBITDAX as a measure of performance, including the inability to analyze the effects of certain
recurring and non-recurring items that materially affect the Company’s net income or loss, the lack of comparability of results of operations of different
companies, and the different methods of calculating Adjusted EBITDAX reported by different companies. In addition, Adjusted EBITDAX provides no
information regarding a company’s capital structure, borrowings, interest costs, capital expenditures, and working capital movement or tax position.
Net Debt: Net Debt is calculated as total debt less cash and cash equivalents. Management uses Net Debt to evaluate its financial position, including
its ability to service its debt obligations.
Leverage: Leverage is calculated as LTM Adjusted EBITDAX divided by net debt.

F&D Cost: Net F&D costs is a non-GAAP metric commonly used in the exploration and production industry by companies, investors and analysts in
order to measure a company’s ability of adding and developing reserves at a reasonable cost. Net F&D costs is a statistical indicator that has
limitations, including its predictive and comparative value. This reserve metric may not be comparable to similarly titled measurements used by other
companies. There are no directly comparable financial measures presented in accordance with GAAP for Net F&D costs, and therefore a
reconciliation to GAAP is not practicable.

The calculation for Net F&D cost is based on future development costs required for the development of reserves, divided by total reserves.

 26
Antero Non-GAAP Measures
Free Cash Flow:
Free Cash Flow is a measure of financial performance not calculated under GAAP and should not be considered in isolation or as a substitute for cash
flow from operating, investing, or financing activities, as an indicator of cash flow, or as a measure of liquidity. The Company defines Free Cash Flow as
net cash provided by operating activities, less net cash used in investing activities, which includes drilling and completion capital and leasehold capital,
less proceeds from asset sales and less distributions to non-controlling interests in Martica.

The Company has not provided projected Net Cash Provided by Operating Activities or a reconciliation of Free Cash Flow to projected Net Cash
Provided by Operating Activities, the most comparable financial measure calculated in accordance with GAAP. The Company is unable to project Net
Cash Provided by Operating Activities for any future period because this metric includes the impact of changes in operating assets and liabilities related
to the timing of cash receipts and disbursements that may not relate to the period in which the operating activities occurred. The Company is unable to
project these timing differences with any reasonable degree of accuracy without unreasonable efforts. See assumptions slides for more information
regarding key assumptions.

Free Cash Flow is a useful indicator of the Company’s ability to internally fund its activities and to service or incur additional debt. There are significant
limitations to using Free Cash Flow as a measure of performance, including the inability to analyze the effect of certain recurring and non-recurring
items that materially affect the Company’s net income, the lack of comparability of results of operations of different companies and the different methods
of calculating Free Cash Flow reported by different companies. Free Cash Flow does not represent funds available for discretionary use because those
funds may be required for debt service, land acquisitions and lease renewals, other capital expenditures, working capital, income taxes, exploration
expenses, and other commitments and obligations.

 27
Antero Resources Adjusted EBITDAX Reconciliation
 LTM Adjusted EBITDAX Reconciliation

 Twelve
 Months Ended
 June 30,
 2021
 Reconciliation of net loss to Adjusted EBITDAX:
 Net income loss and comprehensive income loss attributable to Antero Resources Corporation $ (1,004,749)
 Net income and comprehensive income attributable to noncontrolling interests 661
 Unrealized commodity derivative gains 1,538,067
 Payments for derivative monetizations (4,438)
 Amortization of deferred revenue, VPP (36,936)
 Gain on sale of assets (1,909)
 Interest expense, net 187,665
 Gain on early extinguishment of debt 10,039
 Loss on convertible note equitizations 50,777
 Provision for income tax benefit (324,005)
 Depletion, depreciation, amortization, and accretion 832,839
 Impairment of oil and gas properties 140,565
 Exploration expense 6,499
 Equity-based compensation expense 21,906
 Equity in earnings of unconsolidated affiliate (81,338)
 Dividends from unconsolidated affiliates 159,551
 Contract termination and rig stacking 4,154
 Transaction expense 3,582
 1,502,930
 Martica related adjustments (1) (92,294)
 Adjusted EBITDAX $ 1,410,636
1) Adjustments reflect noncontrolling interests in Martica not otherwise adjusted in amounts above.
 28
Antero Resources Adjusted EBITDAX Reconciliation
 Three Months Ended Six Months Ended
 June 30, June 30,
 2020 2021 2020 2021
Reconciliation of net loss to Adjusted EBITDAX:
 Net loss and comprehensive loss attributable to Antero Resources
 Corporation $ (463,304) (523,467) (802,114) (538,966)
 Net income (loss) and comprehensive income (loss) attributable to
 noncontrolling interests 236 (10,984) 236 (6,589)
 Unrealized commodity derivative losses 481,927 756,998 127,020 940,076
 Payments for derivative monetizations — 4,569 — 4,569
 Amortization of deferred revenue, VPP — (11,279) — (22,429)
 Gain on sale of assets — (2,288) (31) (2,288)
 Interest expense, net 51,811 49,963 104,913 92,706
 Loss (gain) on early extinguishment of debt (39,171) 23,065 (119,732) 66,269
 Loss on convertible note equitizations — 11,731 — 50,777
 Provision for income tax benefit (142,404) (175,966) (252,389) (178,912)
 Depletion, depreciation, amortization, and accretion 215,146 188,661 415,927 383,475
 Impairment of oil and gas properties 37,350 9,303 126,570 43,365
 Impairment of equity method investment — — 610,632 —
 Exploration expense 231 5,638 441 5,857
 Equity-based compensation expense 7,973 4,249 11,302 9,891
 Equity in (earnings) loss of unconsolidated affiliate (20,228) (17,477) 107,827 (36,171)
 Dividends from unconsolidated affiliate 42,755 31,284 85,511 74,040
 Contract termination and rig stacking 11,071 844 11,071 935
 Transaction expense 6,138 185 6,138 2,476
 189,531 345,029 433,322 889,081
 Martica related adjustments (1) (3,100) (25,677) (3,100) (50,239)
 Adjusted EBITDAX $ 186,431 319,352 430,222 838,842

 1) Adjustments reflect noncontrolling interests in Martica not otherwise adjusted in amounts above. 29
Free Cash Flow Reconciliation
 Working capital adjustments in 2021
 include $60.5 million in changes in current
 assets and liabilities and $35.9 million in
 accounts payable and accrued liabilities for
 additions to property and equipment. See
 the cash flow statement in this release for
 details. Three Months Ended Six Months Ended
 June 30, June 30,
 2020 2021 2020 2021

 Net cash provided by operating activities $ 115,963 308,541 $ 316,640 872,272

 Less: Net cash used in investing activities (262,927) (179,903) (574,608) (302,878)

 Less: Proceeds from asset sales — — — (2,351)

 Less: Distributions to non-controlling interests in Martica — (21,329) — (46,028)

 Free Cash Flow $ (146,964) 107,309 $ (257,968) 521,015

 Changes in Working Capital (1) 78,382 (28,077) 59,979 (124,854)

 Free Cash Flow before Changes in Working Capital $ (68,582) 79,232 $ (197,989) 396,161

1) Working capital adjustments in 2021 include $21.4 million in changes in current assets and liabilities and $6.7 million in accounts payable and accrued liabilities for additions to property and equipment.
 See the cash flow statement in this release for details.
 30
Total Debt to Net Debt Reconciliation
Total Debt to Net Debt Reconciliation

 December 31, June 30,
 2020 2021
AR bank credit facility $ 1,017,000 —
5.125% AR senior notes due 2022 660,516 —
5.625% AR senior notes due 2023 574,182 —
5.000% AR senior notes due 2025 590,000 590,000
8.375% AR senior notes due 2026 — 500,000
7.625% AR senior notes due 2029 — 700,000
5.375% AR senior notes due 2030 — 600,000
4.250% AR convertible senior notes due 2026 287,500 81,570
Net unamortized premium (111,886) (29,782)
Net unamortized debt issuance costs (15,719) (26,625)
Consolidated total debt $ 3,001,593 2,415,163
 Less: AR cash and cash equivalents — (4,541)
Net Debt $ 3,001,593 2,410,622

 31
You can also read