Investor Presentation - April 2020 - Ovintiv Investor Relations

Page created by Salvador Hill
 
CONTINUE READING
Investor Presentation - April 2020 - Ovintiv Investor Relations
Investor Presentation

April 2020

                        1
Investor Presentation - April 2020 - Ovintiv Investor Relations
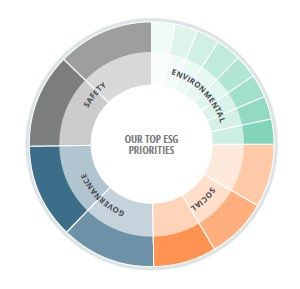
OUR CULTURE DRIVES OUR PERFORMANCE

     Business is Robust Through the Cycle
                                                                                                                                                                       Strong liquidity

                                                                                                       Financial                                          Investment grade credit rating
                                                                                                                                                               Sustainable dividend
                                                                                                       Strength                                                   1.5x leverage target at
                                                                                                                                                                     mid-cycle prices

                                                                                        Disciplined Capital                                      Plan to deliver strong returns, free cash
                                                                                            Allocation                                                    flowŦ & modest growth

                                                                                                                                                       Core assets characterized by high
                                                                                               Top Tier Assets                                          returns, scale and running room

                                                                                                Operational                                            World class execution, capital
                                                                                                                                                   efficiency; & sustainability driven by
                                                                                                Excellence                                                       innovation

                                                                                                   Market                                            Managing risk & maximizing margins
                                                                                                Fundamentals
                                                                                                                                                                                             2
Ŧ Non-GAAP measures defined in advisories. For additional information regarding non-GAAP measures see the Company’s website and disclosure in the appendix of this document
RESPONDING TO MARKET CONDITIONS

Taking Immediate & Significant Action

• Reducing Q2 capital spend by $500 million
• Full year cash costs to drop by at least $100 million
• Dropping 10 rigs immediately, dropping 6 more in May
 •   Additional information on rig and completion activity to come with Q1 results

• Prepared to further reduce capex to ensure free cash
  neutrality and balance sheet strength

Full operational flexibility to further adjust activity as market conditions evolve
                                                                                      3
2019 Highlights
● Strong 2019 performance
  ● Second consecutive year of free cash flow generation Ŧ and 9% YOY proforma growth in crude and condensate                                                                 1

  ● 2018-19 cumulative free cash flow of $616 MM 2,Ŧ
  ● Exceeded consensus expectations on earnings and cash flow
  ● Capital investment at mid-point of guidance
  ● Replaced 2.2x 2019 production reserves; YE19 proved reserves of 2.2 BBOE 3

● Exceeded all synergy targets
  ● Meet, beat and raised G&A synergies and D&C cost savings
           ● Annualized G&A savings of $200 MM
           ● STACK D&C cost savings of ~$2 million per well
           ● Divested gas weighted Arkoma and exited operations in China

● Returned $1.7 B of capital to stockholders over last 2 years, 25% increase in dividend

                                 OVV is one of the largest independent producers of crude oil
                                            & condensate and EBITDA generation
1)  Through this document, crude and condensate refers to tight oil including medium and light crude oil volumes and plant condensate
2) Non-GAAP Free Cash Flow of $140 MM in 2018, $305 MM in 2019 with $171 MM of acquisition costs and restructuring expenses excluded                                              4
3) Reserves stated on an SEC basis. 2.3 BBOE of NI51-101 Proved Reserves
Ŧ Non-GAAP measures defined in advisories. For additional information regarding non-GAAP measures see the Company’s website and disclosure in the appendix of this document
2019 Results
                                                                                                                                                                              Net Earnings
                                                                                                                                                                              ($6) MM

     4Q19
                                                                Free Cash Flow Ŧ                                        Cash Flow Ŧ                                           ($0.02) / share*
                                                                $241 MM                                                 $815 MM                                               Operating Earnings Ŧ
                                                                                                                        $3.14 / share*                                        $210 MM
                                                                                                                                                                              $0.81 / share*

                                                                                                                                                                              Net Earnings
                                                                Free Cash Flow         1,Ŧ
                                                                                                                        Cash Flow Ŧ                                           $234 MM
                                                                >$475 MM                                                $2,931 MM
                                                                                                                                                                              $0.90 / share*

                                                                2nd consecutive year of                                                                                       Operating Earnings Ŧ
                                                                                                                        $11.22 / share*
                                                                                                                                                                              $860 MM

       FY19
                                                                significant FCF & 9% PF
                                                                crude & C5+ growth                                                                                            $3.29 / share*

                                                                  Buyback                                               Dividend                                              Proved Reserves 2
                                                                  13% O/S                                               +25% 2019                                             2.2 BBOE
                                                                  shares                                                                                                      60% liquids / 10-yr RLI

* Per Share amounts reflect the share consolidation
1)   Excludes acquisition costs and restructuring expenses of $171 MM
2) Reserves stated on an SEC basis. 2.3 BBOE of NI51-101 Proved Reserves. Reserve Life Index (RLI)                                                                                                      5
Ŧ Non-GAAP measures defined in advisories. For additional information regarding non-GAAP measures see the Company’s website and disclosure in the appendix of this document
STRONG EXECUTION TRACK RECORD CONTINUES

FY19: A Beat Across the Board
                              FY19 Guidance
                           Original    Current                   Results                                                    FY19 Upstream Operating Free Cash Flow 2,Ŧ
                           Midpoint Low     High                  FY19
Pro Forma:
                                                                                                                                                             Base Assets Anadarko
Total Liquids 3
                               310         312          316         317
Mbbls/d
                                       Crude & condensate           228
Natural Gas
                              1,600       1,615     1,630          1,632
MMcf/d
                                                                                                                     ~$954 MM                                   $283 MM       $263 MM
Total Production
                              580          580       590           589
                                                                                                                   Total Company
MBOE/d
                                                                                                                                                                $199 MM       $209 MM

Capex
                              $2.8               $2.8              $2.8
$B

Reportable:                                                                                                                                                       Montney Permian
Total Costs Ŧ
                                         $12.60 $12.90            $12.59
$ / BOE

   +9% YoY proforma crude oil & condensate growth 1
Note: Upstream Free Cash Flow is before hedges. Base Assets include Bakken, Duvernay, Eagle Ford, Uinta and other legacy assets owned by OVV
1)  Excludes the impact of divestitures
2) Excluding hedge
3) Through this document, Total Liquids include crude oil (primarily tight oil) and NGLs                                                                                                6
Ŧ Non-GAAP measures defined in advisories. For additional information regarding non-GAAP measures see the Company’s website and disclosure in the appendix of this document
Asset Highlights
CORE 3

Permian                                                                                                                                Permian Liquids Production
● $209 MM FY19 upstream operating FCF before hedge Ŧ                                                                                                     (Mbbls/d)                              87
                                                                                                                                                                       78
     ● 22% of total Company FY19 upstream operating FCF Ŧ
                                                                                                                                                                                    67
                                                                                                                                                           61
                                                                                                                                             55
● 2019 crude and C5+ volumes +10% YoY to 67 Mbbls/d
                                                                                                                                 43
     ● Strong growth achieved with 4-rig load leveled program                                                                            5
                                                                                                                                                                   4                        4
● Operational efficiencies carry into 2020
     ● 2020E costs per lateral foot down 10% over last 2 years:
                                                                                                                                      2017                      2018                     2019
         ● Recent pacesetters down $550k/well due to well design
           optimization, faster drill rates and supply management savings                                                         Crude & C5+            Total Liquids           Average Rig Line

     ● Expect 12% improved 2020 production efficiency3 resulting from                                                                   2019 Permian Cycle Time 1
                                                                                                                            96                             (Days)
       lower costs and improved well performance                                                                                                  87
                                                                                                                                                                                                71
● Continued strong Howard County performance                                                                                                                                66

    ● Wells averaging 650 Bbls/d of oil over the first 180d of production 2
    ● Howard development accounted for ~30% of 2019 Permian
      program vs 10% in 2018
Note: C5+ makes up ~3.5% of the 2019 total oil and C5+ stream
1)  Cycle time represents spud to first production
2) Average lateral length of Howard county 2019 program was 8,900 ft                                                         1Q                     2Q                    3Q                4Q
3) Production efficiency is total well cost divided by 365-day oil cumulative production                                                                                                             8
Ŧ Non-GAAP measures defined in advisories. For additional information regarding non-GAAP measures see the Company’s website and disclosure in the appendix of this document
CORE 3

    Anadarko                                                                                                                         Anadarko Liquids Production
                                                                                                                                                 (Mbbls/d, Proforma)
    $263 MM FY19 upstream operating FCF before hedge Ŧ                                                                  120                                                                          12.0
                                                                                                                                                                 11
                                                                                                                                        10                                                     99
         ● 28% of total Company FY19 upstream operating FCF Ŧ                                                           100                                                                          10.0
                                                                                                                                                                     82
                                                                                                                         80                                                                          8.0
                                                                                                                                            65
    ● Significant 2019 volume growth                                                                                     60
                                                                                                                                                                                   56     6
                                                                                                                                                                                                     6.0
                                                                                                                                                         48
         ● +18% proforma crude and C5+ growth YoY                                                                        40
                                                                                                                                38
                                                                                                                                                                                                     4.0

         ● Production flat in 2H19 with 5 rigs                                                                           20                                                                          2.0

         ● 124 net wells on production in 2019 proforma                                                                   0                                                                          0.0

             ● 4Q19 net TILs of 25                                                                                                   2017                     2018                      2019
                                                                                                                                     Crude & C5+         Total Liquids         Average Rig Line

    ● Reduced STACK D&C cost 35% from legacy levels with                                                                               2019 Anadarko Cycle Time 1
                                                                                                                                                          (Days)
      recent pacesetters
CORE 3

 Montney                                                                                                                   60                 Montney Liquids Production
                                                                                                                                                                                                        52
                                                                                                                                                                                                             16
                                                                                                                                                                   (Mbbls/d)                                 14
  ● $199 MM FY19 upstream operating FCF before hedge Ŧ                                                                     50
                                                                                                                                                                                42                           12
       ● 21% of total Company FY19 upstream operating FCF                                            Ŧ
                                                                                                                           40                                                               37
                                                                                                                                                                                                             10
                                                                                                                                                  8                 29
                                                                                                                           30                                                7                               8
  ● Rapid liquids growth driven by optimized completions
                                                                                                                                                     19                                                      6
                                                                                                                           20            15                                                         4
       ● 2019 annualized C5+ production up 27% YoY                                                                                                                                                           4
       ● Average well cumulative IP180 condensate production of                                                             10
                                                                                                                                                                                                             2
         72 Mbbls in 2019 2                                                                                                  0                                                                               0
                                                                                                                                              2017                       2018                    2019
  ● Operational efficiencies generating strong returns                                                                                 Crude & C5+               Total Liquids            Average Rig Line
       ● Industry leading cycle times 3                                                                                                         2019 Montney Cycle Time 1
                                                                                                                                    82                               (Days)          82
                ● Q4 cycle times
EAGLE FORD, BAKKEN, UINTA & DUVERNAY

 Base Assets                                                                                                                        Base Assets Liquids Production
                                                                                                                                                       (Mbbls/d Proforma)
 ● $283 MM FY19 upstream operating FCF before hedge Ŧ
                                                                                                                                                     80                                       76
      ● 29% of total FY19 upstream operating FCF Ŧ                                                                                    68                                      65
      ● 2019 margin before hedge of ~$30 / BOE
                                                                                                                                                 4                                       4

 ● Oil weighted base assets provide strong returns
      ● High-margin, short cycle, projects producing significant FCF Ŧ                                                                      2018                                    2019
      ● Capital efficiency improvements driven by rapid knowledge
                                                                                                                                  Crude & C5+             Total Liquids            Average Rig Line
        transfer and centrally managed supply-chain logistics
      ● Bakken:                                                                                                                       2019 Significant Liquids Weighting
              ● >20% total well cost reduction through the course of 2019                                                                        23%
      ● Eagle Ford:
              ● Average D&C cost per lateral in 2019 down 18% from FY18
              ● Momentum continues into 2020 with an expected 14%
                                                                                                                                           11%
                reduction in cost per lateral foot driven by 40% longer laterals                                                                                                   66%

                                                                                                                                      Crude and C5+          Other NGLs (C2 - C4)            Gas
Note: C5+ accounts for 12.6% of the total 2019 oil & C5+ production volume
                                                                                                                                                                                                      11
Ŧ Non-GAAP measures defined in advisories. For additional information regarding non-GAAP measures see the Company’s website and disclosure in the appendix of this document
Business is Robust Through the Cycle
                                                                                                                                                               Strong liquidity
                                                                                              Financial                                          Investment grade credit rating
                                                                                              Strength                                                   1.5x leverage target at
                                                                                                                                                            mid-cycle prices

                                                                                                   Lower Prices                                         Sustain business scale

                                                                                 Sustain Business                                            Prioritize free cash flowŦ generation
                                                                                                                                                           over growth

                                                                                                                                           Significant free cash flow Ŧ generation
                                                                                                     Mid-Cycle

                                                                                   Today’s Outlook                                                       Modest liquids growth
                                                                                                                                                             De-levers quickly

                                                                                                   Higher Prices                                      Maintain modest growth

                                                                                        Excess                                                       Accelerate debt reduction
                                                                                    Free Cash Flow                                                   Free cash flow Ŧ expansion

                                                                                                                                                                                     12
Ŧ Non-GAAP measures defined in advisories. For additional information regarding non-GAAP measures see the Company’s website and disclosure in the appendix of this document
Appendix
Liquids-Focused, Multi-Basin Proved Reserves
● Reserves additions replaced FY19 production by >2x                                                                                           YE19 Proved Reserves by Asset
 ● Core 3 make up >85% of YE19 proved reserves
 ● Proved developed reserves ~50% of total proved
 ● >10-year total proved reserve life index                                                                                            Anadarko
                                                                                                                                       Permian             >85%
                                                                                                                                       Montney             Core 3
                                 SEC Proved Reserves (MMBOE)                                                                           Base Assets 1

                                                       797
                                                                                                            2,189
                                                                         (64)
                                                                                         (206)
                                      605
                                                                                                                                                  YE19 Proved Reserves Mix
    1,216

                     (159)

                                                                                                                                       Crude Oil & C5+
                                                                                                                                       NGLs (C2 – C4)
                                                                                                                                                            60%
    2018          Revisions       Extensions Acquisitions Divestitures Production                           2019
                                                                                                                                       Gas
                                                                                                                                                          Liquids
                                      and
                                  Discoveries

Note: All reserves are stated on SEC basis as of YE19, 2.3 BBOE of NI51-101 Proved Reserves. Reserve additions represent extensions,
price, acquisitions and revisions                                                                                                                                              14
1)   Base Assets include Bakken, Duvernay, Eagle Ford, Uinta and other legacy assets owned by OVV
Hedge Summary & Cash Flow Sensitivities
Key Oil Hedges                                 2020            Key Gas Hedges                                  2020              Oil Price Sensitivities (WTI $/bbl)
WTI Hedges (Mbbls/d)                             183           Henry Hub Hedges (MMcf/d)                        1,196            Period          $10       $20      $30     $40     $50

Fixed Price Swap                                 141           Fixed Price Swap                                 811
Swap Price                                     $45.30          Swap Price                                      $2.65             2Q 2020        602        414      227     39      (148)

3-Way Option                                     27            3-Way Option                                     330
Short Call                                     $61.68          Short Call                                      $2.72             3Q 2020        565        404      243     82      (79)
Long Put                                       $53.44          Long Put                                        $2.60
Short Put                                      $43.44          Short Put                                       $2.25
                                                                                                                                 4Q 2020        440        360      280     200      71
Costless Collar                                  15            Costless Collar                                  55
Short Call                                     $68.71          Short Call                                      $2.88
Long Put                                       $50.00          Long Put                                        $2.50             Q2-Q4
                                                                                                                                                1,607      1,178    750     321     (156)
                                                                                                                                 Total
Basis Hedges (Mbbls/d)                                         Basis Hedges (MMcf/d)

WTI / Midland Diff                                7            AECO Basis                                       305              Gas Price Sensitivities (NYMEX $/MMBtu)
Swap Price                                     ($1.20)         Swap Price                                     ($0.88)
                                                                                                                                 Period         $1.00      $1.25    $1.50   $1.75   $2.00   $2.25
                                                               WAHA Basis                                        105
Key F/X Hedges                                2020             Swap Price                                      ($0.91)           2Q 2020        143        123      103     83      63       44
Notional US$ Currency Swaps               US$644 MM
Avg Exchange Rate US$ to C$1               US$0.7451                                                                             3Q 2020        145        125      104     84      64       44

                                                                                                                                 4Q 2020         141       121      102     82      63       43

                                                                                                                                 Q2-Q4
                                                                                                                                                429        369      309     249     190      131
                                                                                                                                 Total

For more information on Ovintiv’s Financial Instruments and Risk Management please refer to Note 22 of the interim financial statements
Benchmark hedges as of April 1, 2020 for the remainder of the year.                                                                                                                                 15
Hedge Sensitivities as of April 1, 2020 for balance of 2020. Based on Benchmark hedging only (WTI & NYMEX). Does not include the impact from differential hedges.
Strategic Marketing Efforts Protect Cash Flow
                                       Canada                                                                                                Permian
● ~1 Bcf/d of protected price realizations                                                                         ● Substantial oil & gas price realization protections
     ● Basis hedges protect against market volatility                                                                   ● Oil & gas basis hedges
     ● Firm transportation provides diversified market                                                                  ● Firm oil & gas transportation provides diversified
       access                                                                                                             market access

                                                           2020                  2021                                                                  2020         2021
  Gas Hedges (MMcf/d)                                                                                                Oil & Gas Hedges
  AECO Basis                                               305                   165                                 WTI/Midland Diff (Mbbls/d)           7
                                                                                                                                                                     –
  Swap Price ($US/mcf)                                   ($0.88)                ($1.01)                              Swap Price ($US/bbl)              ($1.20)

  Firm Gas Transportation (MMcf/d)                                                                                   WAHA Basis (MMcf/d)                 105         76
                                                                                                                     Swap Price ($US/mcf)              ($0.91)     ($0.79)
  To Dawn                                                   316                   316
                                                                                                                     Other Differential Mitigation
  To Sumas / Malin                                          132                   132
                                                                                                                     Oil (Mbbls/d)                       66          78
  To Chicago                                                106                   106
                                                                                                                     Natural Gas (MMcf/d)                –           19
   Total Gas Pipe to Market                                 554                  554                                 Total
  Total (MMcf/d)                                                                                                     Oil (Mbbls/d)                       73          78
  Gas                                                       859                   719                                Gas (MMcf/d)                       105          95

                                                                                                                                                                               16
Note: Risk management positions as of April 1, 2020. Natural gas hedged volumes are converted to MCF at 1:1 ratio from MMBtu
Industry Leading ESG Performance
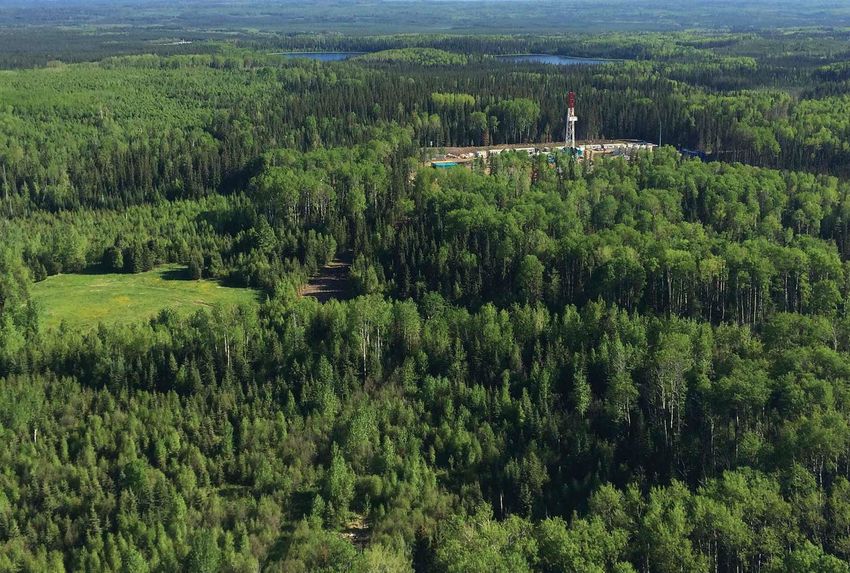
  6th Consecutive Safest Year Ever                                                 Proven Safety Results                                   Environmental Performance
     TRIF                                                                                                                                    Methane Intensity                  2018 Water Use

                                                                                       #1
         0.44
                                                                                                                                                  0.43                                               ~45%
                   0.34
                             0.30      0.30      0.28
                                                                                                                                                                 0.22
                                                            0.21 1

                                                                                                                                                                                       Fresh       Alternative
         2014      2015      2016       2017      2018      2019                                   vs. 23 AXPC peers in                           2016           2018
       Total Recordable Injury Frequency (TRIF): Number of                                                the U.S.                                Tons CH4 / MBOE                     % of Total Water
       Recordable Injuries x 200,000 divided by exposure hours
                                                                                                                                                                                   25%
                           July 2019 score               of all MSCI reviewed                                               Top quartile vs                   Score >25% above peer
                                                           O&G companies                                                   peer companies                            average

Note: All data represents FY18 standalone OVV unless otherwise noted. Sustainalytics peer group consists of APA, CHK, CLR, COG, CXO, DVN, EOG, HES, MRO, NBL, PXD. Report dated as of April 2019                 17
1) Proforma 2019 including Newfield and Ovintiv results
Proactive ESG Approach
● Task Force on Climate-Related Financial Disclosures                                ESG Impact Matrix
  ● Climate-related risks have the potential to impact our business
  ● Governance framework allows us to effectively manage these risks
  ● Applicable concerns are integrated into planning and risk
    management
  ● Established history of measuring, managing and reporting ESG
    performance
● Sustainability Reporting and Programs
  ● An annual Sustainability Report is published on the OVV website
● Focus on Climate Change and Air Quality
  ● OVV has proactive programs in place for effective Emissions
    Management
                                                                        Safety                   Environmental
  ● Electrifying production equipment and facilities                    ● Process Safety         ● Climate Change
  ● Top Tier LDAR program utilizing Optical Gas Imaging for >10-years                            ● Water

● Founding member of The Environmental Partnership                      Governance               Social
                                                                        ● Stakeholder activism   ● Community concerns
  ● Committed to reducing VOC emissions through sustainable practices

                                                                                                                    18
ESG Performance Metrics
          Category                                  Metric              Measurement                  2018        2017        2016
                                                                  metric tons CO2e/gross annual
                                               GHG Intensity                                          17.33      25.05        27.12
                Emissions                                                   production
                                                                  metric tons CH4/gross annual
                                           Methane Intensity                                          0.22        0.38        0.43
                                                                            production
                                        Indirect GHG Emissions           metric tons CO2e           199,028     242,582        –1
                                         Direct GHG Emissions            metric tons CO2e           3,312,645   3,571,514   3,612,528
                                           Methane Emissions             metric tons CH4             41,686     54,602       57,679

                                                                    Cubic meters/gross annual
               Water & Spills

                                              Water Intensity                                         75.7        99.5        67.2
                                                                           production
                                                                    Cubic meters/gross annual
                                         Fresh Water Intensity                                        43.1        74.1        47.1
                                                                           production
                                             Reportable Spills      Regulatory reportable spills       49          59          65

                                             Total Water Use                  MMbbls                   91          89          56

                                            Alternative Water                    %                    43%         26%         30%

                                                                  Number of Recordable Injuries x
                                        Total Recordable Injury
                Safety

                                                                   200,000 divided by exposure        0.28        0.30        0.30
                                           Frequency (TRIF)
                                                                              hours

                                           Recordable Injuries              Workforce                  63          64          54

Note: All data represents standalone Ovintiv Data                                                                                       19
1) Insufficient 2016 data
Non-GAAP Measures
Certain measures in this presentation do not have any standardized meaning as prescribed by U.S. GAAP and, therefore, are considered non-GAAP measures. These measures may not be comparable to similar
measures presented by other companies. These measures have been provided for meaningful comparisons between current results and other periods and should not be viewed as a substitute for measures
reported under U.S. GAAP. For additional information regarding non-GAAP measures, including reconciliations, see the Company’s website and Ovintiv’s most recent Annual Report as filed on SEDAR and EDGAR. This
presentation contains references to non-GAAP measures as follows:

●   Non-GAAP Cash Flow, Non-GAAP Free Cash Flow – Non-GAAP Cash Flow (or Cash Flow) is defined as             ●   Upstream Operating Cash Flow – Upstream Operating Cash Flow is a measure that adjusts the
    cash from (used in) operating activities excluding net change in other assets and liabilities, net            Canadian, USA and China Operations revenues for production, mineral and other taxes, transportation
    change in non-cash working capital and current tax on sale of assets. Non-GAAP Free Cash Flow (or             and processing expense, and operating expense. Management monitors Upstream Operating Cash
    Free Cash Flow) is Non-GAAP Cash Flow in excess of capital expenditures, excluding net acquisitions           Flow as it reflects operating performance and measures the amount of cash generated from the
    and divestitures. Management believes these measures are useful to the company and its investors              company’s upstream operations.
    as a measure of operating and financial performance across periods and against other companies in
                                                                                                              ●   Upstream Operating Free Cash Flow – is defined as Upstream Operating Cash Flow in excess of
    the industry, and are an indication of the company’s ability to generate cash to finance capital
                                                                                                                  capital investment, excluding net acquisitions and divestitures.
    programs, to service debt and to meet other financial obligations. These measures may be used,
    along with other measures, in the calculation of certain performance targets for the company’s
    management and employees.

●   Total Costs per BOE is defined as the summation of production, mineral and other taxes, upstream
    transportation and processing expense, upstream operating expense and administrative expense,
    excluding the impact of long-term incentive and restructuring costs, per BOE of production.
    Management believes this measure is useful to the company and its investors as a measure of
    operational efficiency across periods.

●   Non-GAAP Operating Earnings (Loss) – is defined as Net Earnings (Loss) excluding non-recurring or
    non-cash items that management believes reduces the comparability of the company’s financial
    performance between periods. These items may include, but are not limited to, unrealized
    gains/losses on risk management, impairments, restructuring charges, non-operating foreign
    exchange gains/losses, gains/losses on divestitures and gains on debt retirement. Income taxes may
    include valuation allowances and the provision related to the pre-tax items listed, as well as income
    taxes related to divestitures and U.S. tax reform, and adjustments to normalize the effect of income
    taxes calculated using the estimated annual effective income tax rate.

                                                                                                                                                                                                                   20
Non-GAAP Reconciliations Ŧ
                            Non-GAAP Cash Flow Reconciliation
 (for the period ended December 31)
 ($ millions, except per BOE amounts)                      Q4 2019          2019

Cash from (used in) operating activities                          730      2,921
Deduct (add back):
 Net change in other assets and liabilities                      (42)       (97)
 Net change in non-cash working capital                          (43)         87
Non-GAAP cash flow                                                815      2,931

                        Non-GAAP Free Cash Flow Reconciliation
Non-GAAP cash flow                                                815      2,931
Less: capital expenditures                                        574      2,626
Non-GAAP free cash flow                                           241        305

                     Non-GAAP Operating Earnings Reconciliation
Net earnings (loss)                                                (6)      234
Before-tax (addition) deduction:
 Unrealized gain (loss) on risk management                      (345)      (730)
 Restructuring Charges                                             (4)      (138)
 Non-operating foreign exchange gain (loss)                         52         94
 Gain (loss) on divestitures                                        (1)         3
                                                                (298)       (771)
Income tax                                                          82        145
After-tax (addition) deduction                                   (216)     (626)
Non-GAAP operating earnings (loss)                                 210       860

      Weighted Average Common Shares O/S : Pre & Post Reorganization
Pre-Share Consolidation, Diluted                            1,299.2       1,306.1
Post-Share Consolidation, Diluted                            259.8          261.2
Period Ending Shares O/S, Post-Share Consolidation                         259.8

                                                                                    21
Ŧ Non-GAAP measures defined in advisories
2019 Proforma Production Reconciliation
                                                                               Reportable 1                                                                Proforma 2
 (for the period ended December 31)                 2019               2018              Q4 2019           Q4 2018             2019               2018              Q4 2019     Q4 2018

 Upstream Capital Expenditures
                                                    2,614              1,964                  568            346               2,793              3,367                 568      654
 ($ millions)

 Crude Oil (Mbbls/d)                                164.4              89.9                   172.9          96.5               174               167.8                 172.9    174.0

 NGLs – Plant Condensate (Mbbls/d)                  52.9               39.0                   52.9           50.9               53.7              45.0                  52.9     57.5

 NGLs – Other (Mbbls/d)                             84.6               39.2                   96.2           45.3               89.4              76.8                  96.2     86.9

 Oil and NGLs Total (Mbbls/d)                       301.9              168.1              322.0              192.7              317.1             289.6                 322.0    318.4

 Natural gas (MMcf/d)                               1,577              1,158                  1,624          1,265             1,632              1,598                 1,624    1,735

 Total production (MBOE/d)                          564.9              361.2              592.6             403.4              589.2              555.8                 592.6    607.5

       Production Volumes Excluding
               Dispositions 3                                    Reportable Excluding Dispositions 1                                       Proforma Excluding Dispositions 2
 (for the period ended December 31)                    2019              2018                 Q4 2019       Q4 2018             2019               2018             Q4 2019     Q4 2018

 Crude Oil (Mbbls/d)                                  162.8              87.6                  172.9          93.9               171.7             161.2                172.9    168.8

 NGLs – Plant Condensate (Mbbls/d)                     52.9              38.9                   52.9          50.8               53.7              44.8                  52.9    57.4

 NGLs – Other (Mbbls/d)                                84.6              38.2                   96.2          44.3               89.3              75.5                  96.2    85.4

 Oil and NGLs Total (Mbbls/d)                         300.3              164.7                 322.0          189.0             314.7              281.5                322.0    311.6

 Natural gas (MMcf/d)                                  1537               1151                 1,624          1,256             1,583              1,509                1,625    1,648

 Total production (MBOE/d)                            556.6              356.5                 592.6          398.3             578.6              533.0                592.9    586.2

1)   Reportable includes Ovintiv and Newfield capital and combined production volumes for 4Q19. 3Q18 includes Ovintiv’s capital and production as previously reported.
2)   Proforma includes Ovintiv and Newfield Upstream capital and combined production volumes for both 4Q19 and 4Q18                                                                       22
3)   Volumes related to San Juan (2018), Arkoma (3Q19) and exit of China (3Q19) excluded for all periods
2019 Upstream Operating Free Cash Flow Summary
                        Upstream Operating Free Cash Flow, Excluding Hedge ($ millions)

                                                                     Upstream
                                                                                               Upstream                  Upstream
                                                                  Operating Cash
   Reportable, FY 2019                                                                           Capital               Operating Free                % of Total
                                                                  Flow Excluding
                                                                                              Expenditures               Cash Flow
                                                                      Hedge

   Permian                                                               $1,150                     $941                      $209                       22%

   Anadarko                                                               975                        712                       263                       28%

   Montney                                                                576                        377                       199                        21%

   All Other Base Assets                                                  867                        584                       283                       29%

   Total                                                                $3,568                     $2,614                     $954

Ŧ Non-GAAP measures defined in advisories. For additional information regarding non-GAAP measures see the Company’s website and disclosure in the appendix of this document   23
Future Oriented Information
This presentation contains forward-looking statements or information (collectively, “FLS”) within the meaning of applicable securities legislation, including Section 27A of the Securities Act of 1933, as amended, and Section 21E of the
Securities Exchange Act of 1934, as amended. FLS include:
• planned capital reductions                                                                                                times, well costs, commodity composition and performance against type curves and versus peers
• operational flexibility to maintain balance sheet strength                                                             • pacesetting metrics being indicative of future well performance and costs
• anticipated hedges, amount of hedge production and hedging sensitivities based on oil and gas prices                   • advantages of multi-basin portfolio and benefits of cube development approach
• outcomes of risk management program, including exposure to commodity prices and foreign exchange,                      • estimated reserves and resources, including product types
    market access, market diversification strategy and physical sales locations                                          • expected transportation and processing capacity, commitments, curtailments and restrictions, including
• corporate guidance, including any anticipated changes thereto                                                             flexibility of commercial arrangements
• focus of development and allocation of capital, level of capital productivity and expected return                      • management of balance sheet and credit rating, access to liquidity, target leverage, available free cash flow,
• anticipated production from core and base assets, cash flow, free cash flow, payout, net present value, rates             dividend growth, opportunistic buybacks, debt reduction, expected net debt
    of return, operating costs and G&A, EBITDA estimates and margins, including expected timeframes                      • commodity price outlook
• number of drilling locations, well performance, well spacing, number of wells per pad, rig release metrics, cycle      • ESG approach, performance and results, and sustainability thereof

FLS involve assumptions, risks and uncertainties that may cause such statements not to occur or results to differ materially. These assumptions include: future commodity prices and differentials; assumptions as specified herein; data
contained in key modeling statistics; availability of attractive hedges and enforceability of risk management program; assumed tax, royalty and regulatory regimes; and expectations and projections made in light of the Company’s
historical experience. Risks and uncertainties include: withdrawal of, changes in or updates to corporate guidance, including as a result of changes in capital program, changes in commodity prices, and associated impact to
production; ability to generate sufficient cash flow to meet obligations; commodity price volatility and impact to the Company’s stock price and cash flows; ability to secure adequate transportation and potential curtailments;
discretion to declare and pay dividends, if any; business interruption, property and casualty losses or unexpected technical difficulties; he impact of COVID-19 to the Company’s operations, including maintaining ordinary staffing levels,
securing operational inputs, and executing on portions of its business; counterparty and credit risk; impact of changes in credit rating and access to liquidity; risks in marketing operations; risks associated with technology; risks
associated with lawsuits and regulatory actions, including disputes with partners; risks associated with decommissioning activities, including timing and costs thereof; ability to acquire or find additional reserves; imprecision of
reserves estimates and estimates of recoverable quantities; and other risks and uncertainties, as described in the Company’s most recent Annual Report on Form 10-K and as described from time to time in its other periodic filings as
filed on SEDAR and EDGAR. Although the Company believes such FLS are reasonable, there can be no assurance they will prove to be correct. The above assumptions, risks and uncertainties are not exhaustive. FLS are made as of the
date hereof and, except as required by law, the Company undertakes no obligation to update or revise any FLS.

Certain future oriented financial information or financial outlook information is included in this presentation to communicate current expectations as to Ovintiv’s performance. Readers are cautioned that it may not be appropriate for
other purposes. Rates of return for a particular asset or well are on a before-tax basis and are based on specified commodity prices with local pricing offsets, capital costs associated with drilling, completing and equipping a well, field
operating expenses and certain type curve assumptions. Pacesetter well costs for a particular asset are a composite of the best drilling performance and best completions performance wells in the current quarter in such asset and
are presented for comparison purposes. Drilling and completions costs have been normalized as specified in this presentation based on certain lateral lengths for a particular asset. For convenience, references in this presentation to
“Ovintiv”, the “Company”, “we”, “us” and “our” may, where applicable, refer only to or include any relevant direct and indirect subsidiary corporations and partnerships (“Subsidiaries”) of Ovintiv Inc., and the assets, activities and initiatives
of such Subsidiaries.

                                                                                                                                                                                                                                                  24
Advisory Regarding Oil & Gas Information
All reserves estimates in this presentation are effective as of December 31, 2019, prepared by qualified reserves evaluators in accordance with procedures and standards contained in the Canadian Oil and Gas Evaluation ("COGE")
Handbook, National Instrument 51-101 (NI 51-101) and SEC regulations, as applicable. Detailed Canadian and U.S. protocol disclosure will be contained in the Form 51-101F1 and Annual Report on Form 10-K, respectively. Information on the
forecast prices and costs used in preparing the Canadian protocol estimates are contained in the Form 51-101F1. For additional information relating to risks associated with the estimates of reserves, see "Item 1A. Risk Factors" of the
Annual Report on Form 10-K.

Reserves are the estimated remaining quantities of oil and natural gas and related substances anticipated to be recoverable from known accumulations, from a given date forward, based on: analysis of drilling, geological,
geophysical and engineering data, the use of established technology, and specified economic conditions, which are generally accepted as being reasonable. Proved reserves are those reserves which can be estimated with a high
degree of certainty to be recoverable. It is likely that the actual remaining quantities recovered will exceed the estimated proved reserves.

Ovintiv uses the terms play and resource play. Play encompasses resource plays, geological formations and conventional plays. Resource play describes an accumulation of hydrocarbons known to exist over a large areal expanse
and/or thick vertical section, which when compared to a conventional play, typically has a lower geological and/or commercial development risk and lower average decline rate. Ovintiv has provided information with respect to its
assets which are “analogous information” as defined in NI 51-101, including production type curves. This analogous information is presented on a basin, sub-basin or area basis utilizing data derived from Ovintiv's internal sources, as
well as from a variety of publicly available information sources which are predominantly independent in nature. Production type curves are based on a methodology of analog, empirical and theoretical assessments and workflow
with consideration of the specific asset, and as depicted in this presentation, is representative of Ovintiv’s current program, including relative to current performance, but are not necessarily indicative of ultimate recovery. Some of
this data may not have been prepared by qualified reserves evaluators, may have been prepared based on internal estimates, and the preparation of any estimates may not be in strict accordance with COGEH. Estimates by
engineering and geo-technical practitioners may vary and the differences may be significant. Ovintiv believes that the provision of this analogous information is relevant to Ovintiv's oil and gas activities, given its acreage position
and operations (either ongoing or planned) in the areas in question, and such information has been updated as of the date hereof unless otherwise specified. Estimates of Ovintiv potential gross inventory locations, including
premium return well inventory, include proved undeveloped reserves, probable undeveloped reserves, un-risked 2C contingent resources and unbooked inventory locations. As of December 31, 2019, on a proforma basis, 2,184 proved
undeveloped locations, 2,671 probable undeveloped locations and 4,292 un-risked 2C contingent resource locations (in the development pending, development on-hold or development unclarified project maturity sub-classes) have
been categorized as either reserves or contingent resources. Unbooked locations have not been classified as either reserves or resources and are internal estimates that have been identified by management as an estimation of
Ovintiv's multi-year potential drilling activities based on evaluation of applicable geologic, seismic, engineering, production, resource and acreage information. There is no certainty that Ovintiv will drill all unbooked locations and if
drilled there is no certainty that such locations will result in additional oil and gas reserves, resources or production. The locations on which Ovintiv will actually drill wells, including the number and timing thereof is ultimately
dependent upon the availability of capital, regulatory and partner approvals, seasonal restrictions, equipment and personnel, oil and natural gas prices, costs, actual drilling results, additional reservoir information that is obtained,
production rate recovery, transportation constraints and other factors. While certain of the unbooked locations may have been de-risked by drilling existing wells in relative close proximity to such locations, many of other unbooked
locations are farther away from existing wells where management has less information about the characteristics of the reservoir and therefore there is more uncertainty whether wells will be drilled in such locations and if drilled
there is more uncertainty that such wells will result in additional proved or probable reserves, resources or production.

30-day IP and other short-term rates are not necessarily indicative of long-term performance or of ultimate recovery. The conversion of natural gas volumes to barrels of oil equivalent (“BOE”) is on the basis of six thousand cubic feet
to one barrel. BOE is based on a generic energy equivalency conversion method primarily applicable at the burner tip and does not represent economic value equivalency at the wellhead. Readers are cautioned that BOE may be
misleading, particularly if used in isolation.

                                                                                                                                                                                                                                           25
You can also read