Targa Resources Corp - Citi One-on-One Midstream / Energy Infrastructure Conference August 18, 2021

 
CONTINUE READING
Targa Resources Corp - Citi One-on-One Midstream / Energy Infrastructure Conference August 18, 2021
Targa Resources Corp.
Citi One-on-One Midstream / Energy Infrastructure Conference
August 18, 2021
Targa Resources Corp - Citi One-on-One Midstream / Energy Infrastructure Conference August 18, 2021
Forward Looking Statements and Corporate Structure
    Certain statements in this release are “forward-looking statements” within
    the meaning of Section 27A of the Securities Act of 1933, as amended,                                                         Targa Corporate Structure
    and Section 21E of the Securities Exchange Act of 1934, as amended. All
    statements, other than statements of historical facts, included in this
    release that address activities, events or developments that the Company                                                             Public Shareholders
    expects, believes or anticipates will or may occur in the future, are
    forward-looking statements.
                                                                                                                                           (~228.7 million shares)(1)

    These forward-looking statements rely on a number of assumptions                                                                   Targa Resources Corp.
    concerning future events and are subject to a number of uncertainties,                                                                 (NYSE: TRGP)                              TRC
    factors and risks, many of which are outside the Company’s control, which                                   Revolving
                                                                                                                                             (Fitch: BB+                           Preferred
                                                                                                               Credit Facility
    could cause results to differ materially from those expected by                                                                         Moody’s: Ba2                          Shareholders
    management of the Company. Such risks and uncertainties include, but                                                                     S&P: BB+)
    are not limited to, weather, political, economic and market conditions,
    including a decline in the price and market demand for natural gas, natural                                                                 100% Interest
                                                                                                               Senior Notes
    gas liquids and crude oil, the impact of pandemics such as COVID-19,
    actions by the Organization of the Petroleum Exporting Countries                                                                Targa Resources Partners LP
    (“OPEC”) and non-OPEC oil producing countries, the timing and success                                       Revolving                   (Fitch: BB+
    of business development efforts, and other uncertainties.                                                  Credit Facility             Moody’s: Ba2
                                                                                                                                            S&P: BB+)
                                                                                                         A/R Securitization
    These and other applicable uncertainties, factors and risks are described
                                                                                                              Facility
    more fully in the Company’s filings with the Securities and Exchange
    Commission, including its most recent Annual Report on Form 10-K, and
    any subsequently filed Quarterly Reports on Form 10-Q and Current
    Reports on Form 8-K. The Company does not undertake an obligation to                                             Gathering and Processing                   Logistics and Transportation
    update or revise any forward-looking statement, whether as a result of                                                   (“G&P”)                                   (“Downstream”)
    new information, future events or otherwise.

targaresources.com   NYSE TRGP                                                                                                                                                                   2
                                                         (1)   Common stock outstanding as of July 30, 2021.
Targa Resources Corp - Citi One-on-One Midstream / Energy Infrastructure Conference August 18, 2021
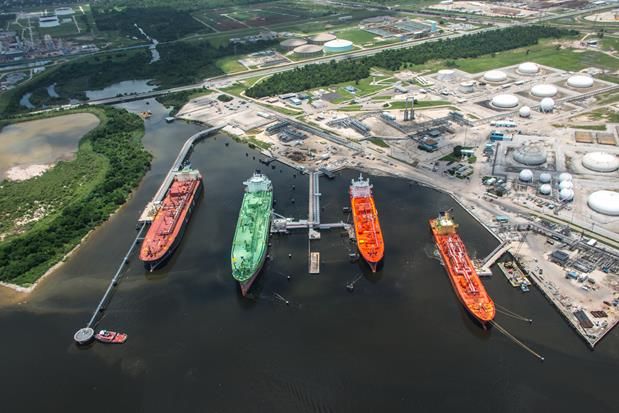
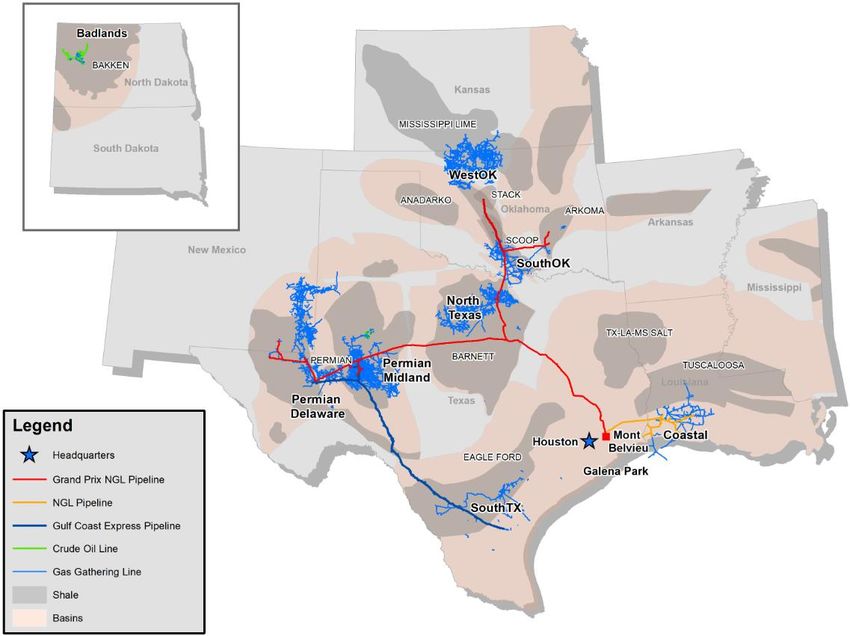
Premier Midstream Infrastructure Company
   Integrated assets that connect natural gas and NGL supply to domestic and international demand markets

             Substantial natural gas
             gathering & processing
                in multiple basins
             ~8.5 Bcf/d gross processing capacity

          Grand Prix NGL Pipeline
       connects G&P volumes to Mont
        Belvieu frac and export assets

           Premier NGL fractionation
            footprint in Mont Belvieu
           813 MBbl/d gross fractionation capacity(1)

        Superior connectivity to U.S.
       petrochemical complex and top-
           tier LPG export facility(2)
         ~12.5 MMBbl/month effective working capacity                                                    ▪ 43 natural gas processing                      ▪ ~31,300 miles of natural gas, NGL                        ▪ 5 crude terminals with 215
                                                                                                           plants owned & operated                          and crude oil pipelines                                    MBbls of storage capacity
                                                                                                         ▪ 9 fractionation trains                         ▪ New NGL and residue pipelines                            ▪ LPG export facilities(2)
                                         (1)   Includes 40 MBbl/d of back-end capacity and does not include Targa’s equity interest in GCF; GCF facility was idled in January 2021 but is available for reactivation subject to prevailing market conditions
targaresources.com    NYSE TRGP                and agreement with our partners.                                                                                                                                                                                3
                                         (2)   Connected to Mont Belvieu, the U.S. NGL hub, which handles the majority of U.S. NGLs. Export facility has an effective workin g capacity of 12.5 MMBbl/month, and this capability is dependent on the mix of
                                               propane and butane demand, vessel size and availability of supply, among other factors.
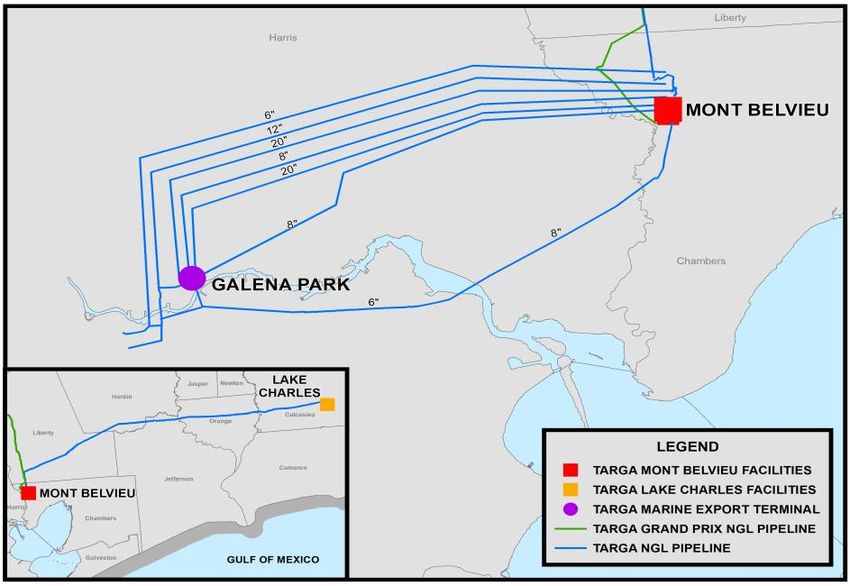
Targa Resources Corp - Citi One-on-One Midstream / Energy Infrastructure Conference August 18, 2021
Strategic Outlook
   Significant operating leverage provides for meaningful cash flow growth and improved returns

                                 ▪   Targa’s operations connect natural gas and NGLs to markets with
          Diverse                    increasing demand for cleaner fuels and feedstocks
        & Vertically             ▪   Premier G&P footprint in the Permian Basin with significant access to          Committed to safety, reliability
                                     growing NGL supply                                                             and environmental stewardship
        Integrated
       Asset Platform            ▪   Grand Prix NGL Pipeline connects Permian supply to key demand markets,
                                     including the U.S. petrochemical hub and Targa’s LPG export position
                                                                                                                        Simplify capital structure
                                 ▪   Increasing Adjusted EBITDA and free cash flow (FCF) outlook                        over time
         Prioritizing            ▪   Prioritizing FCF towards debt reduction and corporate simplification; expect
          Financial                  to exit 2021 with consolidated leverage ~3.5x
          Flexibility            ▪   Maintaining balance sheet strength and financial flexibility over the long-
                                     term and achieving investment grade ratings a focus                                Return capital to
                                                                                                                        shareholders over time

                                 ▪   Significant operating leverage from ~$6.6B of new assets since 2018
       Positioned for            ▪   Increasing fee-based earnings across the business
        Long-Term                ▪   Focused on long-term business sustainability and ESG                           Invest in high-return projects that
                                                                                                                    leverage integrated system
         Success                 ▪   Single C-Corp public security with excellent alignment with common
                                     shareholders; included in S&P 400

targaresources.com   NYSE TRGP                                                                                                                            4
Targa Resources Corp - Citi One-on-One Midstream / Energy Infrastructure Conference August 18, 2021
Updated 2021 Outlook
   Full year 2021 Adjusted EBITDA now estimated between $1.9 - $2.0 billion; year-end leverage estimated ~3.5x(1)
   ▪    Targa’s integrated NGL business continues to deliver strong financial results supported by strengthening business fundamentals
          ✓ Permian G&P inlet volumes expected to be around the high-end of the previously estimated range of 5% - 10% annual growth in 2021(2)
          ✓ Higher commodity prices
          ✓ Continued focus on capital and operating cost discipline
   ▪    Significant debt reduction in 1H21 with 2Q21 consolidated leverage of 3.8x, already within long-term target range

                              Adjusted EBITDA Outlook ($ millions)                                                                                            Year-End Consolidated Leverage

                                      2021e: $1,900 - $2,000 million                                                                        Prioritizing FCF for debt reduction and improving leverage ratios

                                                                               +19%                                                        4.7x
                                                                                                                                                                                                             Long-Term Target: 3.0 – 4.0x

                                                                                                                                                                                                                              ~3.5x
               $1,637

               2020A                2021 Estimate            2021 Estimate               2021 Estimate                                    2020A                   2021 Estimate              2021 Estimate               2021 Estimate
                                      (Feb '21)                (May '21)                   (Aug '21)                                                                (Feb '21)                  (May '21)                   (Aug '21)
       Dashed area represents guidance range

targaresources.com       NYSE TRGP             (1)   Updated FY21 Adjusted EBITDA estimate assumes average 2021 commodity prices : Wtd Avg NGL ($0.70/Gal); HH Nat Gas ($3.20/MMBtu); Waha Nat Gas ($3.10/MMBtu); WTI Crude Oil ($65/Bbl).   5
                                               (2)   Estimated annual 2021 average Permian natural gas inlet volume growth over 2020 annual average volumes.
Targa Resources Corp - Citi One-on-One Midstream / Energy Infrastructure Conference August 18, 2021
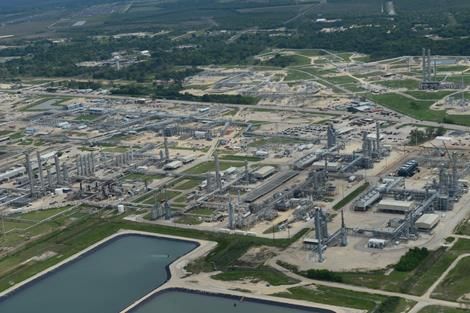
FCF Profile Drives Longer Term Financial Flexibility
   Maintaining balance sheet strength and financial flexibility over the long-term remain a key priority
    ▪   Well positioned to return incremental capital to shareholders over time
    ▪   Strong business performance and embedded operating leverage driving Adjusted EBITDA growth and robust FCF generation
    ▪   Available liquidity of ~$2.9 billion(1) with nearest senior note maturity in 2026

                      Net Growth Capex ($B)                                                   Adjusted EBITDA ($B)                                                                Consolidated Leverage

            $2.5                                                            $2.5                                                                                6.0x

            $2.0                                                            $2.0
                                                                                                                                                                5.0x

            $1.5                                                            $1.5
                                                                                                                                                                4.0x
            $1.0                                                            $1.0
                                                                                                                                                                                          Long-Term Target
                                                                                                                                                                3.0x
            $0.5                                                            $0.5

            $0.0                                                            $0.0                                                                                2.0x
                     2019        2020            2021E                                      2019                 2020                2021E                                      2019                  2020        2021E

                                                                                                                   Guidance Range

targaresources.com   NYSE TRGP                                                                                                                                                                                            6
                                        (1)   Available liquidity as of June 30, 2021 and includes aggregate borrowing capacity under the Securitization Facility and TRC and TRP revolvers, plus cash on hand.
Targa Resources Corp - Citi One-on-One Midstream / Energy Infrastructure Conference August 18, 2021
Targa Development Company Joint Ventures (“DevCo JVs”)
   Repurchasing the DevCo interests would provide additional EBITDA growth at an attractive multiple
      ▪   FY2021 Adjusted EBITDA estimate between $1.9B - $2.0B does not include any EBITDA associated with Stonepeak’s DevCo JV
          interests(1); acquisition of Stonepeak’s DevCo interests would result in a significant step-up in Adjusted EBITDA
      ▪   In February 2018, Targa executed DevCo JVs with Stonepeak Infrastructure Partners to support the development of three key fee-
          based downstream assets, with Targa retaining the option to re-acquire Stonepeak’s DevCo interests at a predetermined fixed rate
             ►   Repurchase price is based on the higher of a predetermined multiple on invested capital (MOIC) or fixed return (IRR), including distributions
                 received by Stonepeak from the DevCo JVs; repurchases can be done in a single tranche or in multiple tranches
      ▪   DevCo JV assets include a 20% interest in Grand Prix NGL Pipeline, a 25% interest in Gulf Coast Express Pipeline and a 100%
          interest in Fractionation Train 6
      ▪   Below is a representative summary of the DevCo structure assuming a single tranche repurchase in Q1 2022(2):
                                    $1,000
                                                                                                                                                                                              Targa pays Stonepeak
                                                                                                                                                                                                 ~$900-$950MM
                                     $750
                       $ Millions

                                                                                                                                                                                         Acquisition price would be
                                     $500                                                                                                                                                ~5-6x EBITDA; expected to
                                                                                                                                                                                        continue to improve over time

                                     $250                                                                                                                                                Given EBITDA of the assets,
                                                                                                                                                                                         repurchase would be close to
                                                                                                                                                                                               leverage neutral
                                       $0
                                             Stonepeak                  Distributions                 Targa Repurchase                       Annual
                                                        (3)                            (3)
                                             Investment              Paid Through YE21                      Cost                             EBITDA

                                                         (1)   Targa Adjusted EBITDA presented on a net basis; current EBITDA from DevCo JV is deducted through non-controlling interest.
targaresources.com   NYSE TRGP                           (2)   Representative summary transaction; Targa has significant flexibility in timing and structure of repurchase.                                                                7
                                                         (3)   ~$912 million of total Stonepeak capital invested as of December 31, 2020; Stonepeak has received quarterly distributions since the assets were placed in-service and the
                                                               estimated distributions through Q4 2021 are included in the representative summary.
Targa Resources Corp - Citi One-on-One Midstream / Energy Infrastructure Conference August 18, 2021
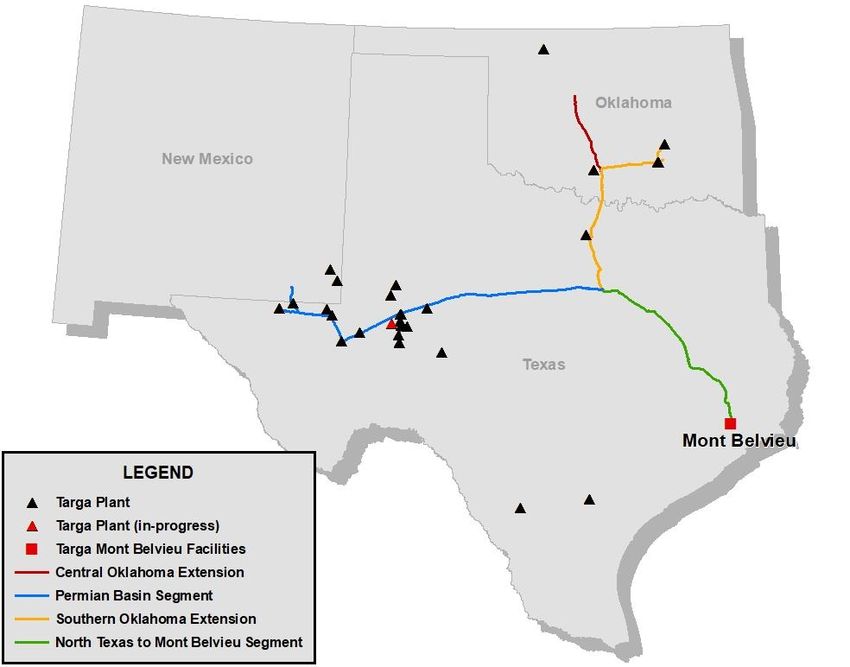
Integrated Platform Supports Fee-Based Profile
   Durable earnings power from significant fee-based margin across Targa businesses
                                Segment Business Mix 2021E(1)                                                                                                  Fee-Based Profile 2021E(1)

                                                                                                                                                                                                          Gathering & Processing(2)
              Permian Basin                                                         Grand Prix
                                                                                                                                                                                                                   Grand Prix
                 Badlands                                                          Fractionation
                                                                                                                                                                                                                  Fractionation
             SouthOK / WestOK                                                 LPG Export Services                                                                             ~85%
                                          ~45% / ~55%                                                                                                                       Fee-Based                        LPG Export Services
           North Texas / SouthTX                                                Marketing / Other

                            ▪ Gathering & Processing     ▪ Logistics & Transportation                                             Fee-Based          Commodity Sensitivity (Hedged)              Commodity Sensitivity (Unhedged)

                     Targa G&P Plant Natural Gas Inlet Volume Mix(3)                                                                                             Fee-Based Margin Trend

                                                                                                                            100%
                                                                                                                                                                                                              ▪      Permian G&P
                                                                                                                                                                                                                     ~65% fee-based
                                                                                                                              75%
                                                                                                                                                                                                                     and increasing
                                                                                                                                                                                                                     over time
                                               ~70%                                                                           50%
                                              Permian                                                                                                                                                         ▪      Use of fee-floors
                                                                                                                              25%                                                                                    preserves upside
                                                                                                                                                                                                                     margin as prices
                                                                                                                               0%
                                                                                                                                                                                                                     increase
                                                                                                                                          2018A            2019A           2020A            2021E

                Permian       WestOK & SouthOK         SouthTX         North Texas         Badlands                                       TRGP Fee Margin %              Permian Fee Margin %

                                                 (1)   Segment business mix and fee-based profile based on 2021E operating margin and gross margin, respectively.
targaresources.com   NYSE TRGP                   (2)   Fee-based margin in Gathering & Processing segment includes Badlands (fully consolidated operating margin), SouthOK, SouthTX and significant portions of Permian                  8
                                                       Delaware, Permian Midland, and WestOK.
                                                 (3)   Based on average inlet for six months ended 6/30/2021; Targa Badlands also includes significant crude infrastructure position .
Targa Resources Corp - Citi One-on-One Midstream / Energy Infrastructure Conference August 18, 2021
Risk Management
   Hedging program and credit risk management framework further strengthens cash flow stability

                            2021 Hedges                                                                           2022 Hedges                                                                  Commodity Price Sensitivity(4)
                     Volumes      Exposure           Wtd. Avg.                                          Volumes             Exposure                  Wtd. Avg.                                               Price               2021E Adj EBITDA
    Commodity        Hedged(1)   Hedged (%)(1)      Hedge Price(2)              Commodity               Hedged(1)          Hedged (%)(1)             Hedge Price(2)              Commodity                  Sensitivity                Impact
    Natural Gas      158,047        ~95%                  $1.74                 Natural Gas              100,856                 ~55%                      $1.72                 Natural Gas                 +/- $0.25             +/- $1 to $2 million
    (MMBtu/d)                                                                   (MMBtu/d)                                                                                        ($/MMBtu)

    NGLs(3)             32,103      ~80%                  $0.47                 NGLs(3)                   25,663                 ~60%                      $0.43                 NGLs                        +/- $0.05           +/- $10 to $16 million
    (Bbl/d)                                                                     (Bbl/d)                                                                                          ($/Gal)

    Condensate          5,434       ~95%                 $52.44                 Condensate                 3,853                 ~65%                     $49.89                 Condensate                  +/- $5.00             +/- $1 to $3 million
    (Bbl/d)                                                                     (Bbl/d)                                                                                          ($/Bbl)

                          Revenue from Top 25 Customers(5)                                                                                          Revenue from Top 25 Customers(5)

                                                                                                                      ▪      Gathering & Processing
                                                    ►   ~68% of revenue from top 25
                                                                                                                                 ►       Targa is predominantly in a net payable position to its G&P
                                                        customers is investment
                  32%                                                                                                                    customers
                                                        grade (“IG”) or backed by a
                                                        Letter of Credit (“LC”)                                                  ►       Diverse group, with many IG and large well capitalized producers
                                                                                                                      ▪      Logistics & Transportation
                                 68%                ►   Top 25 customers represent                                               ►       Targa is predominantly in a net payable position to customers in
                                                        ~65% of total revenue(5)                                                         its NGL transportation and fractionation businesses
                                                                                                                                 ►       Diverse group, primarily IG and large well capitalized firms
    ▪   Non-IG or Non-LC Backed        ▪   IG or LC Backed                                                                       ►       LPG export customers are either IG or required to post an LC to
                                                                                                                                         cover exposure
                                              (1)   Includes hedges executed through June 30, 2021, and based on an estimated average daily equity volumes for 2021.
                                              (2)   Weighted average hedge prices assume put prices for collars.
                                              (3)   Targa’s composite NGL barrel comprises 43% ethane, 32% propane,12% normal butane, 4% isobutane and 9% natural gasoline.                                                                               9
targaresources.com      NYSE TRGP             (4)   Overall commodity price sensitivity inclusive of a number of factors, including fee floor arrangements and any associated fee floor hedges, NGL barrel composition and recovery economics.
                                              (5)   Based on consolidated revenue for the six months ended June 30, 2021.
Targa Resources Corp - Citi One-on-One Midstream / Energy Infrastructure Conference August 18, 2021
Integrated Infrastructure Platform
Permian Basin is a World-Class Resource
   Targa’s leadership position in the Permian and integrated platform provide reliable access to NGL hub in Mont Belvieu

        Permian Oil Production Holds Largest Share of Total U.S. Shale Supply(1)                                                              Targa’s Inlet Volume Growth has Outpaced Permian Basin Production(1)

                  5.5                                                                                                65%                    180
                                                                                                                                                               Permian Production - Associated Gas
                  5.0                                                                                                60%                                       Targa Permian NG Inlet Volumes
                                                                                                                                            160
                                                                                                                     55%
                  4.5
    MMBbl/d

                                                                                                                     50%                    140
                  4.0
                                                                                                                     45%                    120
                  3.5
                                                                                                                     40%
                                                                                                                                            100
                  3.0                                                                                                35%
                                       Permian         Other Lower 48 Shale                 Permian %
                  2.5                                                                                                30%                      80
                     Jan-18        Jul-18    Jan-19     Jul-19          Jan-20    Jul-20        Jan-21                                               4Q18       1Q19       2Q19      3Q19       4Q19          1Q20   2Q20      3Q20      4Q20   1Q21    2Q21

                   More Than Half of the U.S. Rigs Are Located in the Permian Basin(2)                                                               Higher GORs Benefit Targa’s Capture of Permian NGL Supply(1)
                  600                                                                                                54%                    4.2
                                                                                                                                                      Permian GORs have increased ~20% since 2018                                                      ~3.9x
                  500                                                                                                52%                    4.0
                                                                                                                                                                                                                                 ~3.8x
                  400                                                                                                50%                    3.8
      # of Rigs

                  300                                                                                                48%                    3.6                                                       ~3.5x
                                                                                  Permian: +85%
                  200                                                                                                46%                                         ~3.3x
                                                                                                                                            3.4
                  100                                                                                                44%                    3.2

                        0                                                                                            42%                    3.0
                            2Q19     3Q19    4Q19     1Q20       2Q20      3Q20   4Q20       1Q21        2Q21                                  Jan-18            Jul-18           Jan-19              Jul-19         Jan-20        Jul-20        Jan-21
                                     Permian Basin           Total U.S.            Permian % of Total                                                                                                         Yearly Average

                                                                                      (1)   Source: EIA Drilling Productivity Report – July 2021 (data through June 2021); GOR is gas-to-oil ratio.                                                            11
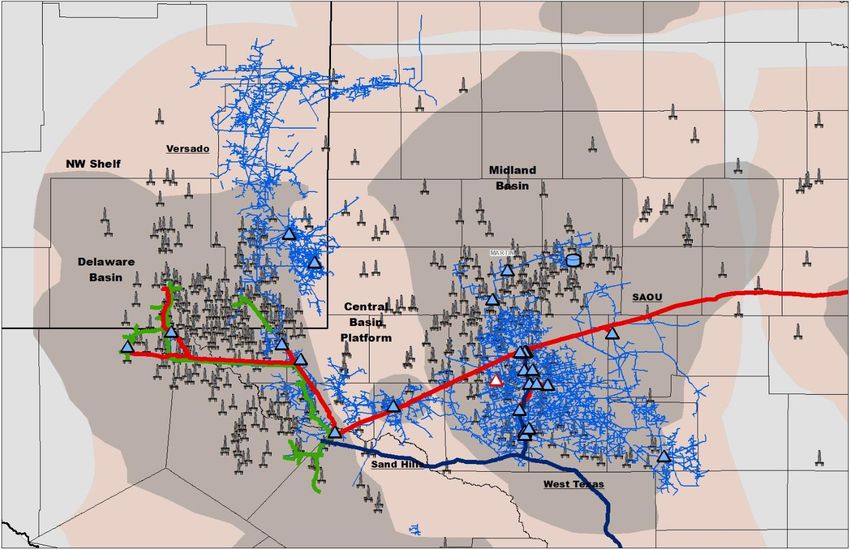
targaresources.com                   NYSE TRGP                                        (2)   Source: Baker Hughes.
Targa’s Premier Permian Asset Footprint
   Super-system across the Midland and Delaware Basins with significant access to NGL supply
       Legend
       Active Rigs
       Processing Plant

       Processing Plant In
       Progress                                                                                                                             Multi-plant, multi-system Permian
       Crude Terminal
       Existing Gathering Pipeline
                                                                                                                                           footprint, complemented by Grand
       Grand Prix NGL Pipeline
                                                                                                                                            Prix and GCX pipeline integration
       GCX Pipeline
       High Pressure Rich Gas
       Gathering

                                                                                                                                            One of the largest Permian G&P
                                                                                                                                              positions supports significant
                                                                                                                                            acreage dedications from diverse
                                                                                                                                                     producer group

                                                                                                                                           25 plants with ~4.1 Bcf/d(1) of total
                                                                                                                                             gross natural gas processing
                                                                                                                                                        capacity

                                                 Source: Enverus; rigs as of July 21, 2021.                                                                                        12
targaresources.com                   NYSE TRGP   (1) Includes Heim Plant expected to commence full operations in early September 20201 and Legacy Plant expected in Q4 2022.
NGL Production Feeds Logistics & Transportation Assets
   Grand Prix NGL Pipeline connects and directs significant NGL volumes to Targa’s fractionation complex in Mont Belvieu

                      Significant NGLs from Targa Permian Plants                                         Grand Prix NGL Pipeline

                400

                350

                300

                                                                                                          Permian Basin
                250
                                                                                                                          up to 550 MBbl/d
       MBbl/d

                200

                150
                                                                                                                                        up to 950 MBbl/d

                100

                 50

                  0
                      2018          2019             2020                2Q21

     ▪ Targa is one of the largest daily movers of NGLs in the Permian Basin    ▪   Grand Prix connects supply to the NGL market hub and to Targa
                                                                                    Downstream assets
     ▪ Targa can direct the vast majority of its NGL production to its
       fractionation facilities in Mont Belvieu                                 ▪   Grand Prix is positioned to benefit from growth in Permian supply and
                                                                                    NGL production from Targa plants and from third-parties
targaresources.com    NYSE TRGP                                                                                                                             13
NGL Market Hub With Global Reach
   Logistics assets exceedingly difficult to replicate, fee-based businesses, with significant take-or-pay

              Premier Fractionation Ownership Position in Mont Belvieu                                                               LPG Export Services Business Connects to Global Demand

       ▪   Mont Belvieu is the U.S. NGL market hub developed over decades                                                  ▪     Effective LPG export working capacity ~12.5 MMBbl/month
           of industry investment                                                                                                (nameplate loading capacity up to ~15 MMBbl/month)(2)
       ▪   813 MBbl/d(1) gross fractionation capacity in Mont Belvieu; 55                                                  ▪     Targa advantage - connected to fractionation, storage,
           MBbl/d in Lake Charles                                                                                                supply/market interconnectivity, refrigeration, and de-ethanizers
       ▪   54 MMBbls of storage capacity in Mont Belvieu                                                                   ▪     Differentiated facility due to commercial and operational flexibility on
       ▪   Superior connectivity to demand (U.S. petrochemical complex and                                                       vessel size and cargo composition
           exports)                                                                                                        ▪     LPG exports provide critical source of cleaner fuels for developing
                                                                                                                                 nations

                                                                                                                                                  LPG Exports by Destination & Product Mix(3)

                                                                                                                                                                        ~21%
                                                                                                                                                                                                               Rest of World
                                                                                                                                                                             ~20%
                                                                                                                                            Propane
                                                                                                                                                                                                               Latin America /
                                                                                                                                            Butane
                                                                                                                                                                                                               South America
                                                                                                                                                                                           ~78%                Caribbean

                                                                                                                                                                                                 ~79%

                                             (1)   Includes 40 MBbbl/d of back-end capacity and does not include Targa’s equity interest in GCF; GCF facility was idled in January 2021 but is available for
                                                   reactivation subject to prevailing market conditions and agreement with our partners.
targaresources.com   NYSE TRGP               (2)   Effective capacity based on current product mix of ~70%/30% propane/butane; nameplate operational capacity up to ~15 MMBbl/mo nth based on supply                             14
                                                   availability, product mix, vessel schedule, among other factors.
                                             (3)   Trailing twelve months ended June 30, 2021.
ESG – Environmental, Social, Governance
   Targa is part of the energy infrastructure that is delivering safe, reliable energy to global communities

         Environment & Safety                                                                                                                                          Social

        We are committed to                                                                                                                              We respect the individual
         maintaining and operating our                                                                                                                     differences of our employees,
         assets safely, efficiently, and in                                  We are committed to strong                                                    customers, stakeholders, and
         an environmentally responsible                                      corporate governance and                                                      individuals within the
         manner                                                           engagement with our shareholders                                                 communities in which we operate
        Wherever we operate, we strive                                       on key governance topics
         to conduct our business with                                                                                                                     We are devoted to treating
         attention to the environment and                                                                                                                  everyone with dignity and
                                                                                                                                                           respect
         to manage risks to enable
         sustainable business growth                                           Governance                                                                 We manage our business with
        We believe that “Zero is                                         (Includes Board Sustainability Committee)                                        integrity and honesty
         Achievable” and our goal is to
         operate and deliver our products
         without any injuries                                                  Our corporate governance
                                                                          practices and policies are reflected
                                                                             in our Corporate Governance
                                                                           Guidelines, Code of Conduct and
                                                                                     Code of Ethics

            Joined ONE Future Coalition
                    May 2021

targaresources.com   NYSE TRGP            More information around Targa’s efforts in the areas of Safety, Environment, Social and Governance can be found in our recent 2019 Sustainability   15
                                          Report, available on our website at www.targaresources.com/sustainability
We Own and Operate Critical Infrastructure
      Our operations are essential to the delivery of energy safely and reliably for everyday life

  ▪    Targa’s operations connect natural gas and NGL to markets with growing demand for cleaner
       fuel and feedstocks
                                                                                                     ✓   Safety

  ▪    We believe that natural gas, NGLs and LPG will continue to play an important role in the
       energy transition to a lower carbon future for decades to come                                    ✓   Operational excellence
          ►   Source of cheap and reliable energy with lower emissions that offset coal
          ►   Fills the gap in energy demand that renewable energy cannot meet                           ✓   Environmental stewardship

  ▪    We are focused on capturing opportunities and managing risk to continue to create long term
       value for our shareholders, our partners, and our communities                                 ✓   Community engagement

targaresources.com   NYSE TRGP                                                                                                           16
Global Demand Outlook and the Call on U.S. Supply
   Increasing global energy demand requires diverse supply source; U.S. exports expected to fuel future energy needs

                                      Global Energy Demand by Fuel(1)                                                                             U.S. Natural Gas and Natural Gas Liquids Supply Growth(2)

    6.0    Billion tons oil equivalent (Btoe)                                                                                              Quadrillion Btu
                                                                                                                                   45.0                                                              +18%
           Growth % (2019 – 2040)                                                                                                          2020 | 2030 | 2040
                                                                                           2019      2030      2040
                                                                                                                                   40.0
    5.0        +7%

                              +29%                                                                                                 35.0                                 Targa’s operations
    4.0                                         -12%             “All of the above” needed to                                                             +14%         deliver cleaner fuels
                                                                                                                                   30.0
                                                                       meet growing demand
                                                                                                                                   25.0
    3.0
                                                                                                                                   20.0

    2.0                                                 +34%
                                                                                                                                   15.0
                                                                        +345%
                                                                                                                                                                               +20%
                                                                                                                                   10.0
                                                                                          +23%
    1.0
                                                                                                           +38%
                                                                                                                                    5.0

    0.0                                                                                                                             0.0
               Oil        Natural Gas           Coal   Bioenergy       Other             Nuclear           Hydro                                        Crude Oil              NGLs               Natural Gas
                                                                     Renewables

     ▪    Total energy demand forecasted to grow ~20% between 2019 and 2040                                                         ▪     Increasing global energy demand is expected to rely on U.S. supply and
          driven by global population growth, emerging markets and developing                                                             future exports of natural gas (LNG) and NGLs (ethane and LPGs)
          economies
                                                                                                                                    ▪     The U.S. is well positioned to meet growing demand for cleaner fuels
     ▪    Natural gas mix expected to increase from 23% to 25% by 2040 –                                                                  and feedstocks, including natural gas and NGLs, which support
          affordable and reliable supply, displaces higher carbon emitting fuels,                                                         economic growth and social advancement in developing nations
          increasing industrial demand, and baseload from power generation

targaresources.com          NYSE TRGP                                                                                                                                                                              17
                                                           (1)    Source: International Energy Agency, World Energy Outlook, (Stated Policy Scenario); October 2020.
                                                           (2)    Source: U.S. Energy Information Administration Annual Energy Outlook (AEO2021); February 2021.
Targa is Well-Positioned to Support Global Energy Needs
   Targa’s facilities exported ~4.6 billion gallons of LPGs globally in 2020 and helped reduce global CO2 emissions

   ▪    LPGs are replacing biomass in many rural communities, and LPG                                                                                         Use of LPGs Provides Emission Reductions
        demand is growing in China, India, Indonesia, Bangladesh and across
        many countries in Africa                                                                                                                                  CO2 Emissions(1)

             Where electricity is not available, the use of LPGs have a positive                                                                                                                                     ~70% lower than
              impact on the health and prosperity for local people in these nations                                                                                                                                   wood
              by offering a cleaner energy cooking solution                                                                                                                                                                ~50% lower than
             LPGs are a reliable energy source that is easily transported and                                                                                                                                             coal
              stored with significantly lower emissions                                                                                                                                                               ~20% lower than
                                                                                                                                                                            LPGs                                      heating oil

   ▪    LPGs advance the United Nations’ 2030 Agenda for Sustainable
        Development, including the achievement of goals directed towards
                                                                                                                                                           Targa's 2020 LPG Exports Displaced Higher CO2
        health, poverty, women, children, environment, deforestation, energy                                                                                            Emitting Fuels (MT)(2)
        and climate                                                                                                                          50,000,000
             ~3 billion people (>35% of the global population) still rely on solid
                                                                                                                                             40,000,000
              fuels and kerosene for cooking(1)
                                                                                                                                             30,000,000
             The lack of access to clean fuels contributes to the death of >4 million
              people each year(1)                                                                                                            20,000,000

                                                                                                                                             10,000,000
   ▪    LPG use supports and enables inclusive economic growth, promotes
                                                                                                                                                          0
        gender equality, protects the environment, and saves lives                                                                                                     Kerosene                          Coal                          Wood

                                   (1)   Source: World LPG Association (WLPGA) - Based on difference in CO2 emissions from average of propane and butane versus wood, coal, and kerosene.
                                   (2)   Represents the total CO2 equivalent for each fuel source relative to the 4.6 billion gallons of LPGs, in aggregate, exported from Targa’s facilities i n 2020. Each fuel source converted to million   18
targaresources.com   NYSE TRGP           British Thermal unit (MMBtu) based on its respective heating value (Btu equivalent) and then applied its respective CO2 emiss ions as determined by EPA (40 CFR Part 98; 40 CFR Part 89), EIA,
                                         and Utah State Forestry Extension.
Reconciliations
Non-GAAP Financial Measures
   This presentation includes the Company’s non-GAAP financial measures: Adjusted EBITDA, distributable cash flow, free cash flow, gross margin and operating margin. The
   following tables provide reconciliations of these non-GAAP financial measures to their most directly comparable GAAP measures. These non-GAAP financial measures
   should not be considered as alternatives to GAAP measures such as net income, operating income, net cash flows provided by operating activities or any other GAAP
   measure of liquidity or financial performance.

   The Company utilizes non-GAAP measures to analyze the Company’s performance. Gross margin, operating margin, Adjusted EBITDA, distributable cash flow, and free
   cash flow are non-GAAP measures. The GAAP measure most directly comparable to these non-GAAP measures is net income (loss) attributable to TRC. These non-GAAP
   measures should not be considered as an alternative to GAAP net income attributable to TRC and have important limitations as analytical tools. Investors should not
   consider these measures in isolation or as a substitute for analysis of the Company’s results as reported under GAAP. Additionally, because the Company’s non-GAAP
   measures exclude some, but not all, items that affect net income, and are defined differently by different companies within the Company’s industry, the Company’s
   definitions may not be comparable with similarly titled measures of other companies, thereby diminishing their utility. Management compensates for the limitations of the
   Company’s non-GAAP measures as analytical tools by reviewing the comparable GAAP measures, understanding the differences between the measures and incorporating
   these insights into the Company’s decision-making processes.

   Adjusted EBITDA

   Adjusted EBITDA is defined as net income (loss) attributable to TRC before interest, income taxes, depreciation and amortization, and other items that the Company
   believes should be adjusted consistent with the Company’s core operating performance. The adjusting items are detailed in the Adjusted EBITDA reconciliation table and its
   footnotes. Adjusted EBITDA is used as a supplemental financial measure by the Company and by external users of the Company’s financial statements such as investors,
   commercial banks and others to measure the ability of the Company’s assets to generate cash sufficient to pay interest costs, support the Company’s indebtedness and pay
   dividends to the Company’s investors.

   Distributable Cash Flow and Free Cash Flow

   Distributable cash flow is defined as Adjusted EBITDA less distributions to TRP preferred limited partners, cash interest expense on debt obligations, cash tax (expense)
   benefit and maintenance capital expenditures (net of any reimbursements of project costs). The Preferred Units issued by the Partnership in October 2015 were redeemed
   in December 2020 and are no longer outstanding. Free cash flow is defined as distributable cash flow less growth capital expenditures, net of contributions from
   noncontrolling interest and net contributions to investments in unconsolidated affiliates. Distributable cash flow and free cash flow are performance measures used by the
   Company and by external users of the Company’s financial statements, such as investors, commercial banks and research analysts, to assess the Company’s ability to
   generate cash earnings (after servicing the Company’s debt and funding capital expenditures) to be used for corporate purposes, such as payment of dividends, retirement
   of debt or redemption of other financing arrangements.

targaresources.com   NYSE TRGP                                                                                                                                                  20
Segment Operating Margin Comparative Results

                                    G&P ($MM)                       1Q20              2Q20              3Q20              4Q20
                                    Gross Margin                   $367.8            $336.5            $363.1            $380.0

                                    Operating Expenses              112.1             99.3              102.1             116.1

                                    Operating Margin               $255.7            $237.2            $261.0            $263.9

                                    L&T ($MM)                       1Q20              2Q20              3Q20              4Q20
                                    Gross Margin                   $363.6            $297.1            $342.1            $399.2

                                    Operating Expenses               69.6             65.6              61.7              77.2

                                    Operating Margin               $294.0            $231.5            $280.4            $322.0

   ▪    Beginning in the first quarter of 2021, Targa is reporting certain fuel and power costs previously included in Operating Expenses in Product Purchases
        and Fuel to better reflect the direct relationship of these costs to Targa’s revenue-generating activities and align with Targa’s evaluation of the
        performance of the business. Prior periods as presented above have been updated to reflect this change.

targaresources.com   NYSE TRGP                                                                                                                                   21
Non-GAAP Measures Reconciliation
                                                                                                                                                     Th            Year Ended December 31,
                                                                                                                                                     ##            2020               2019
                                                                                                                                                                        (In millions)
                                 Reconciliation of Net Income (Loss) attributable to TRC to Adjusted
                                 EBITDA, Distributable Cash Flow and Free Cash Flow

                                    Net income (loss) attributable to TRC                                                                             $               (1,553.9)         $                (209.2)
                                    Income attributable to TRP preferred limited partners                                                                                 15.1                             11.3
                                    Interest (income) expense, net                                                                                                       391.3                            337.8
                                    Income tax expense (benefit)                                                                                                        (248.1)                           (87.9)
                                    Depreciation and amortization expense                                                                                                865.1                            971.6
                                    Impairment of long-lived assets                                                                                                    2,442.8                            225.3
                                    (Gain) loss on sale or disposition of business and assets                                                                             58.4                             71.1
                                    Write-down of assets                                                                                                                  55.6                             17.9
                                    (Gain) loss from sale of equity-method investment                                                                                       —                             (69.3)
                                    (Gain) loss from financing activities (1)                                                                                            (45.6)                             1.4
                                    Equity (earnings) loss                                                                                                               (72.6)                           (39.0)
                                    Distributions from unconsolidated affiliates and preferred partner interests, net                                                    108.6                             61.2
                                    Change in contingent considerations                                                                                                   (0.3)                              8.7
                                    Compensation on equity grants                                                                                                         66.2                             60.3
                                    Risk management activities                                                                                                          (228.2)                           112.8
                                    Severance and related benefits (2)                                                                                                     6.5                               —
                                    Noncontrolling interests adjustments (3)                                                                                            (224.3)                           (38.5)
                                 TRC Adjusted EBITDA                                                                                                   $               1,636.6          $               1,435.5
                                    Distributions to TRP preferred limited partners                                                                                      (15.1)                           (11.3)
                                    Interest expense on debt obligations (4)                                                                                            (388.9)                          (342.1)
                                    Cash tax refund                                                                                                                       44.4                               —
                                    Maintenance capital expenditures                                                                                                    (109.5)                          (141.7)
                                    Noncontrolling interests adjustments of maintenance capital expenditures                                                               5.3                              6.8
                                 Distributable Cash Flow                                                                                               $               1,172.8          $                 947.2
                                    Growth capital expenditures, net (5)                                                                                                (597.9)                        (2,281.7)
                                 Free Cash Flow                                                                                                        $                 574.9          $              (1,334.5)

                                        (1)   Gains or losses on debt repurchases or early debt extinguishments.
                                        (2)   Represents one-time severance and related benefit expense related to the Company’s cost reduction measures.
targaresources.com   NYSE TRGP          (3)   Noncontrolling interest portion of depreciation and amortization expense (including the effects of the impairment of long-lived assets on non-controlling interests).   22
                                        (4)   Excludes amortization of interest expense.
                                        (5)   Represents growth capital expenditures, net of contributions from noncontrolling interests and net contributions to investments in unconsolidated affiliates.
Non-GAAP Measures Reconciliation

targaresources.com   NYSE TRGP   (1)   Represents the midpoint of estimated full year 2021 Adjusted EBITDA.        23
                                 (2)   Noncontrolling interest portion of depreciation and amortization expense.
Visit us at targaresources.com

Contact Information:
Email: InvestorRelations@targaresources.com
Phone: (713) 584-1133
811 Louisiana Street
Suite 2100
Houston, TX 77002
You can also read