Prologue: Green Banking - Capacity Building on Green Energy and Climate Finance Alexander Boensch, 6th June 2016, Manila - Asia Clean Energy Forum
←
→
Page content transcription
If your browser does not render page correctly, please read the page content below
Prologue: Green Banking

Capacity Building on Green Energy
and Climate Finance

Alexander Boensch, 6th June 2016, Manila

 www.renac.de
Renewables Academy (RENAC) AG
RENAC is a Berlin-based training and capacity
building specialist for renewable energy and energy
efficiency
More than 6,000 participants from over 145 countries
Training courses, master degrees, capacity building
services and consulting
Large network of lecturers
Independent, interdisciplinary and intercultural
www.renac.de
2
Green Banking project partner and supporter
Association of Development Financing Institutions in Asia
and the Pacific (ADFIAP) based in Manila / Philippines
Focal point of all development banks and other financial
institutions engaged in the financing of development in the
Asia-Pacific region
102 member-institutions in 41 countries
The Green Banking project is funded by the German
International Climate Initiative (ICI)
with support of the German Federal Ministry for the
Environment, Nature Conservation, Building and Nuclear
www.renac.de
Safety (BMUB)
Sources: www.adfiap.org, www.international-climate-initiative.com
3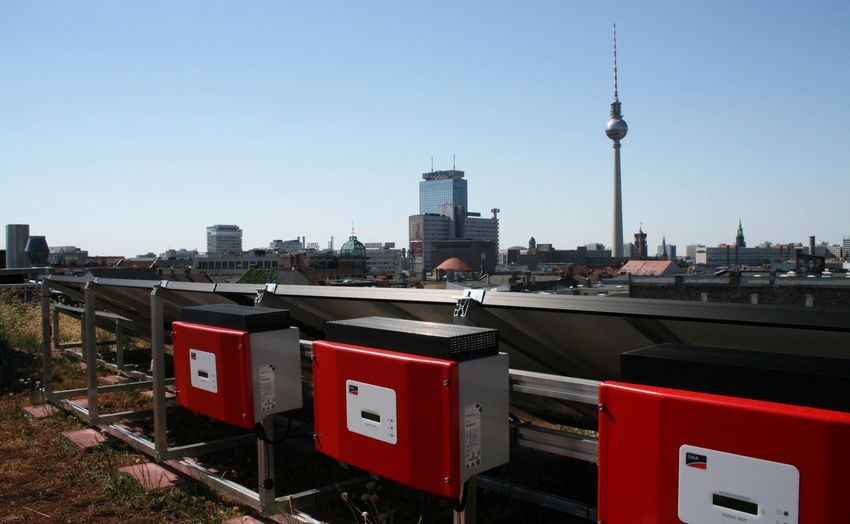
What is Green Banking?

                              • 2015 – 2018
                  CAPACITY    • Scholarship programme
                  BUILDING
                              • Seminars & e-learning

                          TOPIC:        • Renewable energy (RE)
                         FINANCING      • Energy efficiency (EE)

                                   •   India
                   PARTNER         •   Indonesia
                  COUNTRIES        •   Philippines
 www.renac.de                      •   Thailand
                                   •   Vietnam

                                                                   4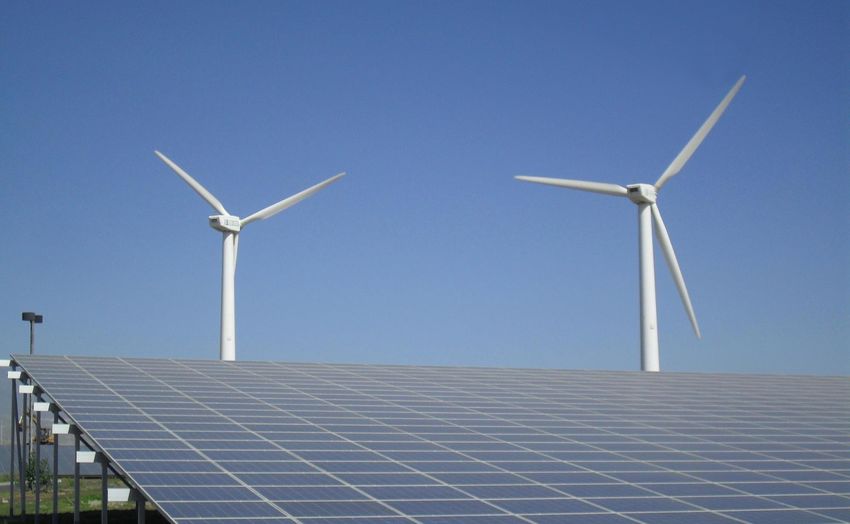
Why Green Banking?
Our objective:
Increase the availability and use of financing instruments for
RE and EE projects
Increase willingness of financial institutions to get involved in
RE and EE finance
Facilitate accessibility to global climate finance options
Your opportunity:
Benefit from new business opportunities in the growing green
markets of your country
Exchange experiences with experts from Germany
www.renac.de
Contribute to climate change mitigation
5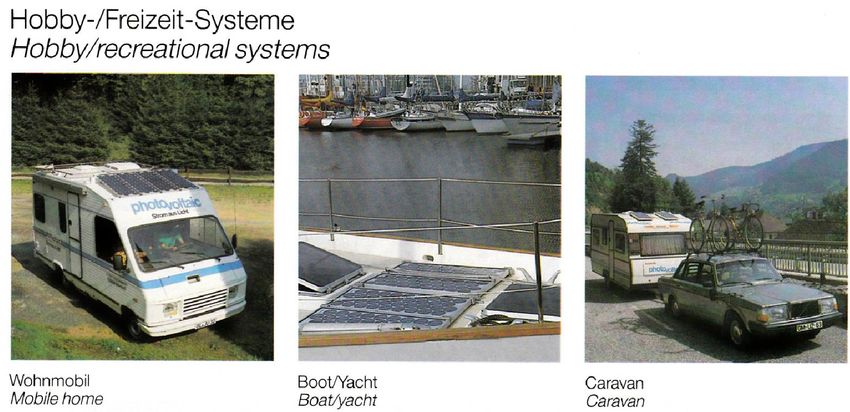
What does Green Banking offer?

                Online trainings

                Trainings in India, Indonesia,
                Philippines, Thailand and Vietnam

                Delegation tours & B2B meetings in
                Germany

                “Green Finance Specialist” degree
 www.renac.de

                Train-the-Trainer Seminars at
                RENAC‘s Training Centre in Berlin

                                                     6
Time schedule of Green Banking

                                                     2016   2017   2018

OT         Online Training
           - 2 months online -

BL         Blended Learning
           - 2 months online & 3 days attendance -

GFS Green Finance Specialist
           - 5 months online & 3 days attendance -

TtT        Train-the-Trainer Seminar
           - 5 days attendance in Berlin -

DT         Delegation Tour
           - 5 days attendance in Berlin -

FWS Final workshop
           - 1 day attendance -
     www.renac.de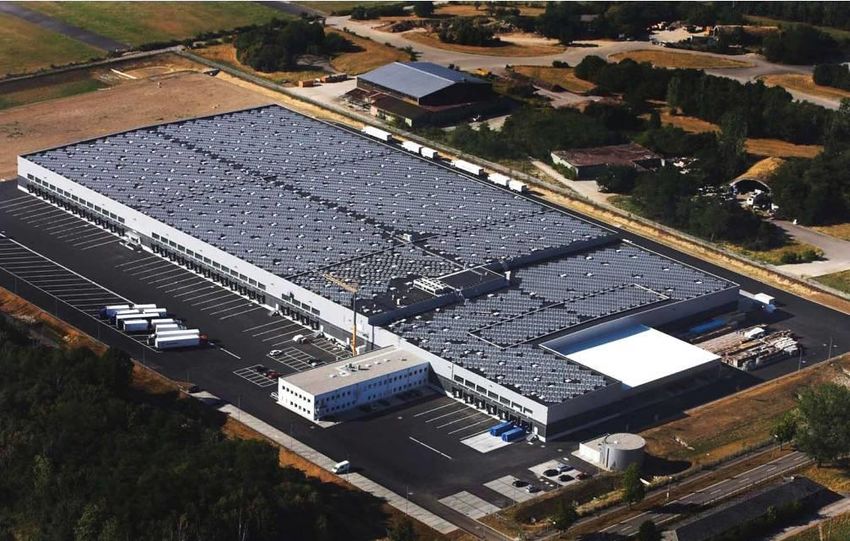
Green Banking activities for 2016
September 12th - November 4th, 2016
Online training on green finance topics
Application deadline: July 1st, 2016
November 2016
Attendance seminars (3 days each) in all five partner countries
Application deadline: July 1st, 2016 (online training as a
prerequisite)
October 10th - 14th, 2016
www.renac.de
Delegation tour to Berlin
B2B meetings with German finance specialists in RE and EE
Application deadline: July 1st, 2016
8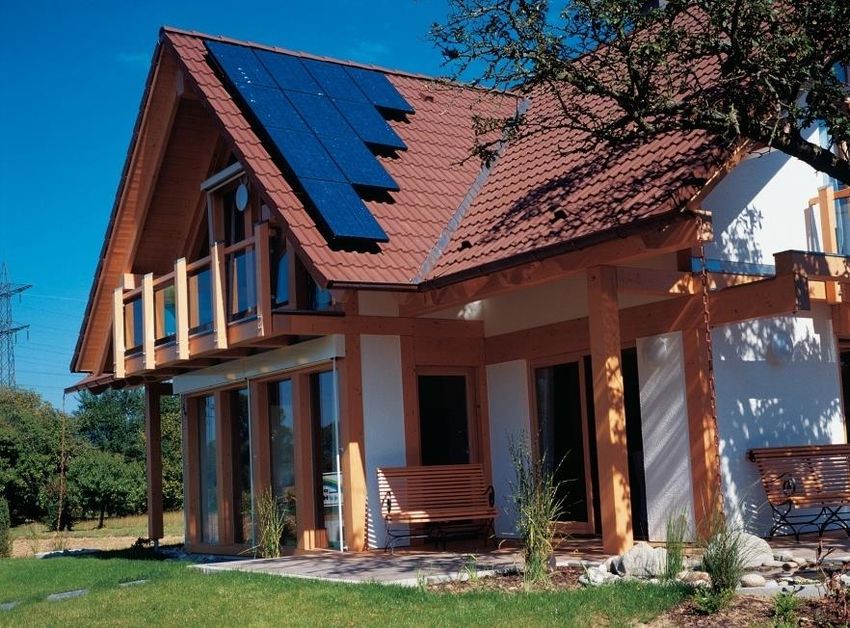
Attendance seminars in the partner countries 2016
Topics:
Bankability of RE & EE projects (Risk assessment, project appraisal etc.)
Access to international climate finance schemes (e.g. Green Climate Fund)
Country Date City Technology
focus
India Nov. 21st – 23rd, 2016 Mumbai PV + Wind
Indonesia Nov. 09th – 11th, 2016 Jakarta Energy efficiency
Philippines Nov. 23rd – 25th, 2016 Manila PV + Wind
Thailand
www.renac.de
Nov. 28th – 30th, 2016 Bangkok PV + Biogas
Vietnam Nov. 14th – 16th, 2016 Hanoi Energy efficiency
9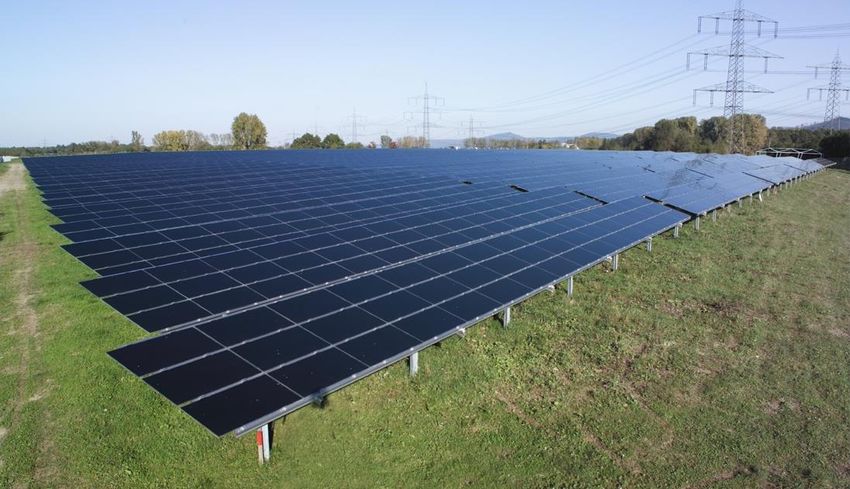
Green Energy Finance

ACEF Deep Dive Workshop

Alexander Boensch, 6th June 2016, Manila

 www.renac.de
Agenda – DDW “Green Energy Finance”

1. Introduction to Assessment & Financing of Photovoltaic (PV)
   Projects

                                                                 AGENDA
    09:00 – 10:30h, speaker: Alexander Boensch (RENAC)

2. Bankability Assessment and Cash Flow Modelling
    11:00 – 12:30h, speaker: Alexander Boensch (RENAC)

3. Introduction to Green Finance and Credit Cycle
    14:00 – 15:30h, speaker: Octavio B. Peralta (ADFIAP)

4. Credit Appraisal and Approval: Risk-Based Green Lending
   Framework
  www.renac.de

    16:00 – 17:30h, speaker: Arlene S. Orencia (ADFIAP)

                                                                      11
1. Introduction to the Technology - PV Applications
www.renac.de
12Off-grid vs. grid-connected photovoltaics (PV) systems
www.renac.de
13Use of PV applications
Off-Grid Grid-connected
Telecom Systems Gross-metering (FiT, PPA, etc…)
Street-Lighting Net-metering (reduce utility bill)
Metering & controls Backup systems
Water Pumping
Solar Home Systems
Village Power Supply
Hotels/Resorts
www.renac.de
etc.
14Some examples of off-grid systems…
www.renac.de
15Off-grid systems - the “cradle“ of PV technology
Private / leisure time use of off-grid photovoltaics –
already in the 1980s…
www.renac.de
Mobile homes Boats /yachting Caravaning
Source: Siemens Solar (brochure from the 1980s, courtesy of Ulrich Warna)
16Remote water-pumping and telecom base stations
www.renac.de
Pictures: Lars Koerner
17Individual hybrid PV system of a remote home
www.renac.de
Pictures: Koos Alberts, Omnisolar, South Africa
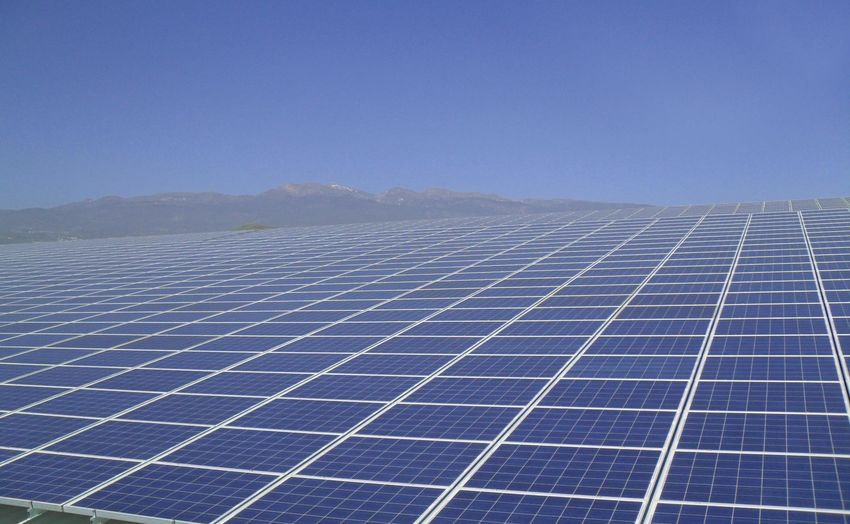
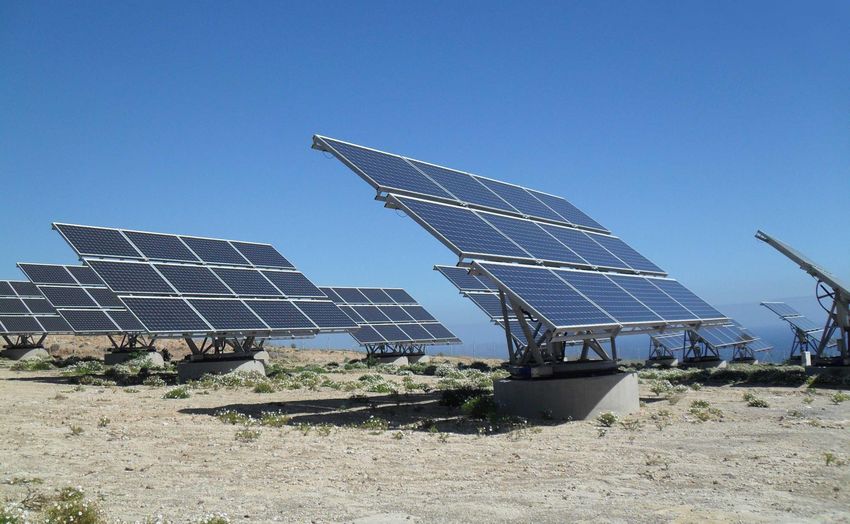
18Examples of grid-connected systems…
www.renac.de
19Grid-tied PV systems on residential properties
Energy cost reduction Well-suited for Proximity to electricity
for home owners and densely populated consumption
areas
Income from selling
excess production to
the grid
One – several kWp
installed capacity
Source: SMA Solar Technology AG
www.renac.de
20Grid-tied PV systems on commercial properties
Energy cost reduction Often installed on Often use of project
for the firm or industrial flat roofs finance
(large roof size)
Income from selling
excess production to Statics of the building
the grid or has to be considered
Income from selling
entire production
Up to a few MWp
www.renac.de
21Grid-tied PV systems as ‘solar power stations’
Income from selling Interest of power Often use of project
entire production to suppliers increases finance
the grid worldwide
Economies of scale Ground-mounted
Up to 100s of
MWp
Source: www.schletter.de
www.renac.de
222 Introduction to the Financing Approach
www.renac.de
23Financing options for residential projects
Small scale projects with limited capital requirements
Financing using the home owner‘s own funds
Financing from retail debt or concessionary financing instruments
Mortgage-based loan financing
Microcredits
Subsidized loans and grants
Characteristics: financing structures follow general rules of local retail financing
markets and / or requirements of support programs
www.renac.deThree debt financing alternatives for commercial projects
Financing on the project sponsor‘s balance sheet
Utilities or other sponsors with strong financing capacity are able to finance small
to medium-sized PV projects using their own cash resources
Investment costs are met from corporate financing or operating cash flows
Project debt is secured through the assets in the sponsor‘s balance sheet
Characteristics: easy, low transaction and capital costs, flexible financing
structure, sponsor bears the default risk (“full recourse” to the sponsor‘s balance
sheet)
Financing using capital market products
Bonds / asset-backed securities, e.g. Breeze I-IV (originator: Unicredit Bank)
Characteristics: high transaction costs due to credit rating requirements and
(usually) investment bank support, only suitable for very large projects or portfolio
refinancing
www.renac.deThree debt financing alternatives for commercial projects
Project Finance without / with limited recourse to the sponsor
Project debt is provided by banks and other financial institutions, project equity is
paid-in by the sponsor(s) or external Investors
The project‘s creditworthiness and debt capacity exclusively depends on the
project cashflows
“Non- or limited recourse”- financings without or with limited recourse to the
sponsor’s balance sheet
Characteristics: requires stable, forecastable project cash flows, ideally from a
reliable public support scheme (e.g. feed-in tariff) or a long-term power
purchasing agreement, “growth engine” for green energy markets in many
developed countries, knowledge-intensive, transaction costs can be high
www.renac.deContractual structure of a PV – project financing
Project Finance
Loan Agreement
Transformer Station
Definition / characteristics Grid connection
Legally-independent
www.renac.de project company
Cash flow of the project is the main source of collateral and loan repayment
Long-term contractual relationship
Higher degree of leverage compared to corporate financeContracts in the investment phase
Investment
Project Finance
Loan Agreement
Transformer Station
Engineering, procurement, construction (EPC) Grid connection
Module supply agreement
www.renac.de
Project development-/ BoP-contract alt. „Multi-Contracting“ (attention: interfaces !)
Grid connection-/ Grid usage agreement
Capital procurement contracts (if any)Contracts in the operating phase
Project Finance
Loan Agreement
Transformer
Operating agreements Operating Financing
Grid connection
Offtake-agreement
www.renac.de
/ PPA
Land rights contracts Financing agreements
O&M-/ operating agreements Project finance loan agreement
Insurance contracts Shareholder agreementProject finance process overview www.renac.de
Credit decision-making
Essential prerequisites for a credit application are usually
two independently and accurately performed PV resource assessments for the
proposed site from certified consultants,
a full-information cash flow forecast (incl. input assumptions from project
contracts),
a recourse-free building permit and a full set of valid project rights and contracts
allowing turnkey-ready installation
Before financial close is achieved and the first drawdown from the credit
facility can be made, the bank, and respectively its consultants, perform a
legal, technical and financial due diligence of the whole project to ensure
that all major risks have been addressed
Based on these information, the credit analyst will assign a rating to the
www.renac.de
projectCredit agreement The project finance loan agreement regulates facility purpose, loan amount, tenor, interest margins and bank fee disbursement and repayment schedules “conditions precedent” for first utilization of the loan provision of collateral “covenants” (e.g. DSCR, minimum debt-to-equity ratio, etc.) definition of “events of default” reporting obligations of the borrower The security package (collateral) includes i.a. pledge agreements for modules, infrastructure, material contracts and the project debt service and maintenance reserve accounts www.renac.de
EPC / PV module supply agreement (financing aspects) General warranty periods in EPC and module supply agreements Power output warranty / warranted minimum production Maximum degradation levels Warranties can be issued in combination with a separate maintenance contract concluded with the technology supplier Warranty for delivery period and availability of spare parts Liquidated damage payments (LDs) have to be sufficient ! Recycling of modules after decommissioning www.renac.de
3     Technical Aspects and Yield Assessment

    www.renac.de

                                               34
Different solar cells: wafer-based vs. thin-film
Wafer-based Thin-film
1: Source: http://www.greentechmedia.com/articles/read/Yingli-Gains-Crown-As-Top-Producer-in-a-36-GW-
One cell
Silicon wafers are processed to solar Depositions on large area substrates
cells which are then connected in series and ‘monolithic series integration’ of the
cells (typically by lasing)
Global-PV-Market; retrieved on 2 April 2014
Current module efficiency: 14-21%
Current module efficiency: 8-16%
Proven technology: market share about
89% 1
www.renac.de Potential for ultra-low cost and medium
efficiency (14-20%) but market share is
Potential for low cost high efficiency decreasing
(20 - 25%)
35Area needs c-si versus thin-film
Solar park Waltenhofen (Germany):
0.7MWp c-si
www.renac.de
0.4MWp TF (a-Si; ~7% module efficiency)
36Inverter types typical values micro inverter string inverter central inverter DC-Input power 200…300 Wp 1…100 kWp 100…2500 kWp DC-Voltage range
Sample CAPEX structure of a 5.0 MW PV system

                  Modules                         2,680,000      USD
                  Cables                             55,000      USD
Hardware          Accessories (combiner, plugs,
                  arresters, …)                      27,000      USD
                  Mounting frame                    360,000      USD
                  Inverters                       1,100,000      USD
                  Power switch                       32,000      USD
                  Transformer                       110,000      USD
                  Remote control                     55,000      USD
Service           Approvals and licenses             36,000      USD
                  Project planning                  180,000      USD
                  Expertises / studies               32,000      USD
Labor             Assembly                          180,000      USD
 www.renac.de
                  Grid connection                    90,000      USD
Miscellaneous                                       215,000      USD
Total CAPEX                                       5,152,000      USD
Specific cost per unit of installed capacity       1,030      USD/ kWp

                                                                         38
First yield estimate using resource maps
Colour-coded maps show how irradiation is distributed in the target area
Data is usually provided as average annual sum in kWh/m²
www.renac.de
39Energy yield assessment to derive net output
Maps only provide a first indication
of the available energy production
(AEP) potential
Two resource assessment studies
required that take into account site
characteristics and technology
Certified, ‘bankable’ consultants
http://solargis.info/doc/free-solar-radiation-maps-GHI#P
Net output to reflect losses:
1,900.0 MWh Gross production
– 437.0 MWh 23.0% system losses
– 7.3 MWh 0.5% degradation
www.renac.de
– 29.1 MWh 2.0% line losses
= 1,426.6 MWh Net output 1st year
40Shading by very close obstacles reduces net output
www.renac.de
Source: www.azsolarcenter.org, www.solarpraxis .de / Schubert (3x)
41Advantage of thin film modules in case of shading
www.renac.de
42Risks and Mitigation from the Financier‘s
4 Perspective
www.renac.de
43Risk profile and capital costs of a PV project
Construction
risk
Development risk Yield risk
Bankability
assessment
Development of risk
Degree of project completion
Siting Permitting Construction Plant Operation
+ Equity of the developer (rE ~15%)
Time
Capital sources
Financial investors private or funds (rE ~5 - 15%)
and costs
www.renac.de
Strategic investors (e.g. energy companies) (rE ~4 - 15%)
- Bank-debt / Project Finance (rD ~2.0-6.5%)It’s all about risk!
The key to PV - project financing is the
reallocation of all risks away from
the lenders to the project
where they are
mitigated
www.renac.deAn operating PV farm’s risk exposure
Operational
Force majeure
Risk Technology
performance
Agency conflicts
Legal claims of
third parties
PV resource
overestimated
Decreasing Supportive laws
energy demand Off-taker changed
defaults
Taxes
rise
Market
www.renac.de Adverse price
changes
Regulatory
Risk Risk
Tax incentives
WACC removed
increasesDefinitions of project completion
Principle categories of risk: pre-completion and post-completion
Physical Completion
Project is physically complete according to technical design criteria
Mechanical Completion
Project can sustain production at a specified capacity for a certain period
of time
Financial Completion (financial sustainability)
Project can produce under a certain unit cost for a certain period of time
Project meets certain financial ratios (current ratio, debt/equity, debt
www.renac.de
service capacity ratios)Pre-completion risks
A. Pre-completion risks: Examples how to reduce or shift risk
Types of risks Away from financial institution
Participant risks
Sponsor commitment - Reduce size of investment?
Financially weak sponsor - Attain third party credit support for
weak sponsor (e.g. letter of credit)
Transportation, construction
design defects - Experienced EPC / module supplier
- Turn-key construction contract
www.renac.de
- Transport and installation insurancePre-completion risks
A. Pre-completion risks: Examples how to reduce or shift risk
Types of risks Away from financial institution
Process failure - Process / equipment warranties
Completion risks
Cost overruns - Pre-agreed overrun funding
- Fixed (real) price contract
Project not completed - Completion guarantee
- Independent acceptance testing
www.renac.dePost-completion risks
B. Post-completion risks: Examples how to reduce or shift risk
Types of risks Away from financial institution
PV resource risk
Availability of input - Independent PV resource assessments
resource - Use of long-term data
- Include safety deductions
Production / operating risks
Operating difficulty leads to - Proven module and inverter technology
insufficient cash flow - Experienced operator / management
team
www.renac.de
- Performance guarantees on equipment
- Insurance to guarantee minimum cashPost-completion risks
B. Post-completion risks: Examples how to reduce or shift risk
Types of risks Away from financial institution
Market risk
Volume (output not sold entirely) - Preferred grid access for renewables,
PPAs with take-or-pay clause
Price (output not sold at a profit) - Feed-in laws, minimum volume/floor
price provisions in PPAs etc.
- Price escalation / indexation clauses
Force majeure risks
Strikes, floods, earthquakes, etc.
www.renac.de - Comprehensive insurance package
- Debt service / maintenance reserveswww.renac.de
Force majeure risk – example of the Philippines
OCHA – Regional office for Asia Pacific (http://www.unocha.org/)Post-completion risks
B. Post-completion risks: Examples how to reduce or shift risk
Types of risks Away from financial institution
Political risk
Covers range of issues from - Host govt. political risk assurances
nationalization/expropriation, - Development bank
changes in tax and other laws, - Political risk cover: Hermes, COFACE,
currency inconvertibility, etc. EXIM etc.
- Private insurance (LLOYDS etc.)
- Offshore escrow accounts
- Multilateral or bilateral agency
involvement
www.renac.dePost-completion risks
B. Post-completion risks: Examples how to reduce or shift risk
Types of risks Away from financial institution
Abandonment risk
Sponsors walk away from - Abandonment test for banks to run
project project based on historical and
projected costs and revenues
Other risks related to the financing
Syndication risk - Secure strong lead financial institution
Currency risk - Currency swaps / hedges
Interest rate exposure - Fixed rates / interest rate swaps
www.renac.de
Rigid debt service - Built-in flexibility in debt service
obligations
Cross defaultBankability Assessment and Cash Flow
5 Modelling
www.renac.de
55Case study cash flow modelling
Super Solar Investor Ltd. (“SSI”) got the opportunity to acquire a used
750kW PV project that has been installed 14 years ago.
The PV modules are operating under a renewable energy feed-in tariff
scheme which is remunerating the generated electricity for a period of at
least 20 years from the commissioning date.
SSI can operate the PV modules for at least 6 additional years under the
same conditions as before (same feed-in tariff).
SSI considers to invest under the pre-condition that it can raise a bank loan
for co-financing.
Project acquisition date shall be 01 January 2017.
Let’s show SSI how to evaluate the project from a banker’s perspective!
www.renac.de
56Overview of project input parameters
Project purchase cost: 230,000 USD
Average historic energy production (incl. system losses): 1,100 MWh p.a.
Module degradation: 0.5% p.a.
Electrical losses: 2.0% p.a.
Feed-in tariff: 91 USD / MWh until 31 December 2020 (for 6 years)
Operating cost per year:
O&M modules & inverters: 20,000 USD, indexed with 2.0% p.a.
Caretaker / maintenance man: 2,400 USD, indexed with 2.0% p.a.
Electricity consumption cost: 1,200 USD, indexed with 2.0% p.a.
Land leases: 8.0% of the electricity revenues
www.renac.de
Insurance cost: 2,200 USD, indexed with 2.0% p.a.
Accounting / annual report: 1,500 USD, indexed with 2.0% p.a.
Dismantling cost: 40,000 USD, accumulated in years 5 & 6
57Incremental project cash out- and inflows
Principle of cash flow planning Case Study: Investment Cost Budget
Initial investment outlay. The up- The total upfront investment cost
front cost of the renewable energy for the used photovoltaic project is
technology and all other fixed 230,000 USD.
assets.
The investor can provide
Operating cash flows over the 90,000 USD of equity.
project life. To be evaluated…
He needs a bank loan of
USD 230,000 Investment
– USD 90,000 Equity
= USD 140,000 Bank loan
www.renac.de
58Step 1: Revenue calculation
Principle of cash flow planning Case study: Revenue calculation
Annual energy production:
1,100.0 MWh Gross production
Under the project finance – 5.5 MWh 0.5% Degradation
approach, cash flow positions – 21.9 MWh 2.0% Availability loss
follow a hierarchy called cash flow
= 1,073.0 MWh Net output 1st year
waterfall.
Feed-in tariff: 91.0 USD / MWh
This concept requires annual
revenues to cover periodical costs Electricity revenues p.a.:
in a strict order. 1,073 MWh x 91.0 USD = 97,608 USD
Step 1: No revenues for green energy
www.renac.de certificates considered
Interest income depends on
reserve account size
59Step 2: Calculation of operational costs and taxes
Principle of cash flow planning Case study: operational costs, taxes
Detailed cost schedule for all six
operating years:
Year 1 2 3 4 5 6
2017 2018 2019 2020 2021 2022
Under the project finance O&M Contract 20,000 20,400 20,808 21,224 0 0
approach, cash flow positions Maintenance Man
Electricity Consumption
2,400
1,200
2,448
1,224
2,497
1,248
2,547
1,273
2,598
1,299
2,650
1,325
follow a hierarchy called cash flow Land Leases
Insurance
7,809
2,200
7,770
2,244
7,731
2,289
7,692
2,335
7,654
2,381
7,615
2,429
waterfall. Dismantling costs
Accounting 1,500 1,530 1,561 1,592
20,000 20,000
1,624 1,656
Total Operating Costs -35,109 -35,616 -36,134 -36,663 -35,555 -35,675
This concept requires annual Trade Tax -2,225 -2,191 -2,237 -2,282 -2,516 -2,447
EBITDA 60,274 59,313 58,263 57,206 57,599 57,070
revenues to cover periodical costs Income Tax -2,459 -2,413 -2,464 -2,513 -2,792 -2,703
in a strict order.
All costs increase at 2% p.a., except
Step 2: land leases.
www.renac.de
O&M payments are stopped two
years before the project ends.
Taxes are calculated from P/L
statement.
60Step 3: Summing up all positions to receive CADS
Case study: cash flow available for debt service (CADS)
Year 1 2 3 4 5 6
2017 2018 2019 2020 2021 2022
Park Output Potential 1,100 1,100 1,100 1,100 1,100 1,100
Degradation Factor 99.5% 99.0% 98.5% 98.0% 97.5% 97.0%
Electrical Losses 2.0% 2.0% 2.0% 2.0% 2.0% 2.0%
Net Output 1,073 1,067 1,062 1,057 1,051 1,046
Electricity Price 91.00 91.00 91.00 91.00 91.00 91.00
Electricity Revenues 97,608 97,119 96,634 96,151 95,670 95,192
Total Income 97,608 97,119 96,634 96,151 95,670 95,192
O&M Contract 20,000 20,400 20,808 21,224 0 0
Maintenance Man 2,400 2,448 2,497 2,547 2,598 2,650
Electricity Consumption 1,200 1,224 1,248 1,273 1,299 1,325
Land Leases 7,809 7,770 7,731 7,692 7,654 7,615
Insurance 2,200 2,244 2,289 2,335 2,381 2,429
Dismantling costs 20,000 20,000
Accounting
www.renac.de
1,500 1,530 1,561 1,592 1,624 1,656
Total Operating Costs -35,109 -35,616 -36,134 -36,663 -35,555 -35,675
Trade Tax -2,225 -2,191 -2,237 -2,282 -2,516 -2,447
EBITDA 60,274 59,313 58,263 57,206 57,599 57,070
Income Tax -2,459 -2,413 -2,464 -2,513 -2,792 -2,703
CADS 57,814 56,900 55,800 54,693 54,807 54,367
61Step 4: From CADS to ECF
Principle of cash flow planning Case study: Debt service
The bank loan of 140,000 USD is to
be repaid in annual installments:
Year 1: - 20,000 USD 120,000 USD
CADS is predominantly used to Year 2: - 40,000 USD 80,000 USD
meet the project’s annual debt Year 3: - 40,000 USD 40,000 USD
service.
Year 4. - 40,000 USD 0 USD
Debt service consists of the
Loan tenor is usually shorter than
scheduled annual interest and
project tenor (here: 4y < 6y)
debt repayments.
risk buffer
Debt holders usually demand an
additional
www.renac.de debt service reserve Interest rate: 3.5% p.a.
account (DSRA).
DSRA: 6-months debt service.
62Step 4: From CADS to ECF
Case Study: Equity Cash Flow (ECF)
Year 1 2 3 4 5 6
2017 2018 2019 2020 2021 2022
CADS 57,814 56,900 55,800 54,693 54,807 54,367
Redemption -20,000 -40,000 -40,000 -40,000 0 0
Interest -4,900 -4,200 -2,800 -1,400 0 0
Debt Service -24,900 -44,200 -42,800 -41,400 0 0
Cash before DSRA 32,914 12,700 13,000 13,293 54,807 54,367
Cash incl. DSRA 32,914 34,800 34,400 33,993 54,807 54,367
DSRA Target 22,100 21,400 20,700 0 0 0
DSRA Actual 22,100 21,400 20,700 0 0 0
Equity Cash Flow (ECF) 10,814 13,400 13,700 33,993 54,807 54,367
Interest rate is only applied to the outstanding loan amount.
DSRA (Target) is calculated as 50% of next year’s debt service.
DSRA (Actual) is the actual (”real”) cash reserve amount that the PV project
www.renac.de
was able to accumulate in the respective period.
Annual ECFs can be distributed to the equity investor.
636. Key Financial Project Ratios
www.renac.de
64Key financial project ratios - DSCR
CADSt Case study: DSCRs
DSCRt = ---------------------------
Debt Service t To calculate the DSCRs for the
sample project, we divide the
PV of CADSt over Loan Life annual CADS by the total debt
LLCRt = -------------------------------------- service.
Debt Outstanding t
Sample calculation for year 1:
PV of CADSt over Project Life DSCR1 = 57,814 USD / 24,900 USD
PLCRt = ---------------------------------------
Debt Outstanding t DSCR1 = 2.32
The debt service cover ratio All DSCR values need to be >1 for
(DSCR) indicates, to what extent a project to be bankable.
CADS exceeds the scheduled debt
service in a given period.
www.renac.de
65Key financial project ratios – LLCR, PLCR
CADSt Case study: LLCR, PLCR
DSCRt = ---------------------------
Debt Service t Sample LLCR calculation (year 3):
55,800 54,693
+
1,035 1,0352
PV of CADSt over Loan Life LLCR3 =
80,000
LLCRt = --------------------------------------
Debt Outstanding t LLCR3 = 1.31
PV of CADSt over Project Life Sample PLCR calculation (year 3):
PLCRt = --------------------------------------- 55,800 54,693 54,807 54,367
+ + +
1,035 1,0352 1,0353 1,0354
Debt Outstanding t PLCR3 =
80,000
The loan life cover ratio (LLCR)
PLCR3 = 2.52
and the project life cover ratio
(PLCR) take an aggregated view on LLCR >1: project surpluses more
the project putting the present value than sufficient to cover aggregate
(PV)www.renac.de
of the respective CADS values debt service over the loan life.
into relation to the outstanding debt.
PLCR shows additional potential to
loan life considered for LLCR stretch tenors in case a loan
project life considered for PLCR restructuring is needed.
66Evaluation of case results
Case study: Overview of all project ratios
Year 1 2 3 4 5 6
2017 2018 2019 2020 2021 2022
CADS 57,814 56,900 55,800 54,693 54,807 54,367
Redemption -20,000 -40,000 -40,000 -40,000 0 0
Interest -4,900 -4,200 -2,800 -1,400 0 0
Debt Service -24,900 -44,200 -42,800 -41,400 0 0
Cash before DSRA 32,914 12,700 13,000 13,293 54,807 54,367
Cash incl. DSRA 32,914 34,800 34,400 33,993 54,807 54,367
DSRA Target 22,100 21,400 20,700 0 0 0
DSRA Actual 22,100 21,400 20,700 0 0 0
Equity Cash Flow (ECF) 10,814 13,400 13,700 33,993 54,807 54,367
DSCR 2.32 1.29 1.30 1.32 n/n n/n
LLCR 1.48 1.30 1.31 1.32 n/n n/n
PLCR 2.12 2.08 2.52 3.83 n/n n/n
All minimum values observed in year 2.
Key results of ratio analysis
www.renac.de
Ø-DSCR 1.56 Ø-LLCR 1.35 Ø-PLCR 2.64
Min-DSCR 1.29 Min-LLCR 1.30 Min-PLCR 2.08
>1.0 >1.0 >1.5
Project seems financially feasible from a lender‘s perspective!
67Do you have any questions?
www.renac.de
68Thank you! Alexander Boensch Renewables Academy (RENAC) Schönhauser Allee 10-11 D-10119 Berlin Tel: +49 30 52 689 58-76 Fax: +49 30 52 689 58-99 altevogt@renac.de
You can also read