BRIONY TYREE 28127Y7C4D2 - PILATES20
←
→
Page content transcription
If your browser does not render page correctly, please read the page content below
Briony Tyree

Date of birth:   myDNA ID:     Pathology No:

24 Nov 1976      30293         28127Y7C4D2

Collected:       Received:     Reported:
11 Jan 2018      16 Jan 2018   1 Feb 2018
INTRODUCTION TO YOUR REPORT
ABOUT THIS REPORT
What is the purpose of this report?
The overarching goal of our genetic test products is to empower you to take more control in improving
your quality of life.
The specific purpose of this report is to assist you in understanding how your genes can influence:
your body size and weight
your ability to lose weight
whether you can maintain weight loss
the way your body stores and processes dietary fats
your likelihood of altered blood triglycerides and cholesterol.
Once you have this information, you and your healthcare professional will be able to make better
informed decisions about your health management and you may be inspired to make lasting changes to
your lifestyle.
What is included in your report?
The report will identify and explain your results for seven key genes. Four genes are related to
body weight: FTO, PPARG, ADIPOQ, MTIF3. Three genes are linked to triglycerides and
cholesterol levels: APOA5, LIPC, FADS1.
The report includes advice for the most appropriate diet for your gene variants. We include two
different diet recommendations (with sample menus): one for weight maintenance and one for
weight loss.
There are many genes that combine to affect your body weight, but a handful are the most
influential. We report the genes with the strongest evidence that links them to the control of
body weight.
What are the limitations of this report?
For some people, their results may show no risk factors in their genes, but they may still be
obese or have elevated triglycerides or cholesterol levels.
Similarly, for other people, their results may show that they have an increased risk of being
overweight or of having high triglycerides or cholesterol levels, but this does not mean that they
will necessarily be overweight or have high triglycerides or cholesterol.
This is because your lifestyle, the foods you eat and the environment to which you are exposed
have an impact on the final effect predicted by your genes. Such external factors cannot be
taken into consideration in this report.
Please note this report does not provide specific dietary recommendations for people with
coeliac disease, diabetes, allergy and other specific health conditions affecting diet and weight.
Also, women pregnant or breastfeeding may need other dietary considerations. We encourage
our customers to consult a healthcare professional for such advice.
How is the report organised?
The report has 4 main sections:
Genetic Summary (section A)
Diet Recommendations (section B)
Genetic Findings (section C)
Healthcare professional section
Additional diet information (such as Serving Size Guides and Sample Menus) are found online. Please
log in to your Explore myDNA Portal account (https://explore.mydna.life).
1 February 2018, © 2017 My DNA Life. All rights reserved. www.mydna.lifeTHE SCIENCE BEHIND THIS REPORT
From your cheek sample to your report: a journey through science and evidence
Your cheek sample arrived at our NATA accredited laboratory in Melbourne and our in-house
scientists extracted your DNA and analyzed your genes.
Our team of qualified genetics and nutrition professionals performed a rigorous review of all the
current scientific literature relating to your gene variants and developed an Evidence Rating
System that explains the quality of the relevant scientific findings (please see star rating
explanation in the Healthcare Professional section of the report).
After collecting and rating the evidence available for the selected genes, our scientists have
summarised the main findings.
Our nutrition professionals have developed a diet recommendation for your genetic type. This is
based on studies that showed that individuals who share your genetic results responded well,
improving their health and weight.
What is genetics and genetic testing?
Your genes contain information called DNA that determines the characteristics that are with you
since birth. These include hair and eye colour, and other body characteristics such as how you
process nutrients. You have two copies of each gene; one is inherited from your mother and one
from your father. As human beings, we all have the same set of genes, but small variations within
each of these genes make us different from each other. These individual variations have been
also shown to predict certain aspects of your health. Analysis of such genetic variations provides
the basis for your report.
Recent research has investigated the value of genetic testing for personal use. It found that
people who know their genetic profile are more likely to make sustainable healthy changes to
their lifestyle, including their diet and exercise behaviour. However, it is important to understand
that a genetic test does not take into consideration environmental factors that affect your
genetic predisposition.
So, how can your genes and your weight be related?
As you may know, the main predictor of your weight is the balance between the number of calories you
consume and the calories you burn. This balance is controlled by a combination of your genes and your
environment. Your genes control your weight from within, by influencing things like how fast you burn
calories or the type of foods that you choose, or by affecting your appetite and your body fat
distribution. Environmental factors include your lifestyle and control your weight from outside, for
example by making you more likely to eat too much or exercise too little.
For each person, the relative influence that genes and environment have on body weight is different.
That is why it is so important to know your genetic background and to consider it alongside your
lifestyle. This will help you understand the reasons for your weight and to be empowered to know what
to do about it.
NOW ENJOY YOUR PERSONALISED DIET REPORT!
Things to consider
We recommend that you consult with your healthcare professional before you start any new diet
program recommended in this report. If you have any specific medical conditions, and are thinking
about starting a new diet program based on this report, please seek your healthcare professional’s
advice. These recommendations may differ based on your age, height, weight or activity levels.
The diet recommendations in this report apply to 19 years old and above.
It is recommended that a healthcare professional is consulted for under 19 years of age.
1 February 2018, © 2017 My DNA Life. All rights reserved. www.mydna.lifeA GENETIC SUMMARY
WEIGHT MANAGEMENT
WEIGHT &
• FTO GENE
Your FTO gene variation is likely to increase your appetite and your
tendency to overeat and to reduce your sense of feeling full after a
APPETITE meal. This can lead to weight gain and a moderate chance of obesity.
BODY SIZE &
• MTIF3 GENE
Your MTIF3 gene variation gives you a moderate chance of having an
increased body size. On the bright side, you are more successful in
WEIGHT REGAIN maintaining weight loss over time.
FAT STORAGE
• PPARG GENE
Your PPARG gene variation suggests that when you eat more food that
your body needs, the excess calories will be stored in your body as fat.
FAT BURNING
• ADIPOQ GENE
Your ADIPOQ gene variation does not influence your levels of fat
burning hormone.
LIPID PROFILE *
TRIGLYCERIDE
• APOA5 GENE
Your APOA5 gene variation does not influence your chance of having
LEVELS high triglycerides.
CHOLESTEROL &
TRIGLYCERIDE
• LIPC GENE
Your LIPC gene variation is not likely to influence your lipid profile
(cholesterol and triglyceride levels). Other factors may affect it.
LEVELS
FATTY ACIDS
• FADS1 GENE
Your FADS1 gene variation predicts a normal ability to process omega-
3 and omega-6 fatty acids and a normal lipid profile.
PROCESSING
LEGEND: For health implications Favourable Less Favourable Least Favourable
Detailed information about each gene is found in Section C – GENETIC FINDINGS.
*Please note that only a lipid profile blood test can detect your actual cholesterol and triglyceride levels.
1 February 2018, © 2017 My DNA Life. All rights reserved. www.mydna.life
3B DIET RECOMMENDATIONS
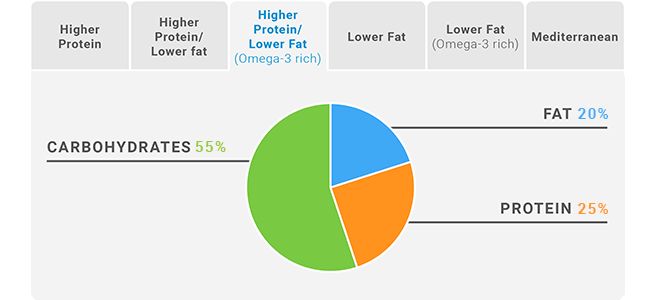
YOUR RECOMMENDED DIET IS
Higher Protein/Lower Fat (Omega-3 rich)
How to follow your diet?
We provide a diet for two weight goals:
Weight Loss: calorie reduction of ~ 2092 kilojoules / 500 Calories from your daily energy
requirements is needed
Weight Maintenance : your daily energy requirements are based on your gender and age
For both goals, we provide detailed Diet Guidelines, Serving Size Guides and Sample Menus.
You will find all this information online. Log in NOW to your Explore myDNA Portal account at:
https://explore.mydna.life
Your Recommended Diet is based on current research on four genes and can change with new
emerging research and as more genes are added to your profile.
Each of your Weight Management gene results has specific diet recommendations (found below
in section C) which derive from scientific studies showing that individuals with your same result
achieve most weight loss. Your diet combines all these recommendations in one actionable
advice. All our recommendations are within the World Health Organisation (WHO) Dietary
Recommendations and Nutritional Requirements.
This diet is not specifically designed to help lower your existing high triglyceride and/or
cholesterol levels. For further advice on weight or lipid profile management, please seek advice
from a healthcare professional.
1 February 2018, © 2017 My DNA Life. All rights reserved. www.mydna.life
4C GENETIC FINDINGS
WEIGHT, APPETITE & OBESITY - FTO
About the gene
The FTO gene is linked to body size, body fat storage and obesity. This gene affects your eating habits,
food preferences, appetite and the feeling of being full in your brain’s control centre (the hypothalamus
area). The FTO gene is linked to your chance of being overweight.
* These percentages only refer to Caucasian population and can vary in different ethnic groups.
**Please note each gene variation has specific diet recommendations (steps to lose weight) which have been combined into
Your Recommended Diet, found in Section B.
1 February 2018, © 2017 My DNA Life. All rights reserved. www.mydna.life
5C GENETIC FINDINGS
BODY SIZE AND WEIGHT REGAIN - MTIF3
About the gene
The MTIF3 gene is involved in the production of energy inside the powerhouses of the cells, called
mitochondria. To keep functioning, our cells need energy-rich molecules derived from food. Cells that
need more energy, such as muscle cells, have more mitochondria to cater for high-energy
requirements. The MTIF3 gene has been linked to increased body size, which is measured as Body
Mass Index (BMI) and also to regain of weight after dieting. The exact mechanism is however yet to be
discovered.
* These percentages only refer to Caucasian population and can vary in different ethnic groups.
**Please note each gene variation has specific diet recommendations (steps to lose weight) which have been combined into
Your Recommended Diet, found in Section B.
1 February 2018, © 2017 My DNA Life. All rights reserved. www.mydna.life
6C GENETIC FINDINGS
FAT STORAGE - PPARG
About the gene
Your body has certain nutrient requirements to sustain your energy levels. However, when you eat more
food than your body needs, the excess calories are stored as body fat. The PPARG gene is called the
'thrifty' gene as it facilitates this fat storage process and saves fat for future energy needs.
* These percentages only refer to Caucasian population and can vary in different ethnic groups.
**Please note each gene variation has specific diet recommendations (steps to lose weight) which have been combined into
Your Recommended Diet, found in Section B.
1 February 2018, © 2017 My DNA Life. All rights reserved. www.mydna.life
7C GENETIC FINDINGS
FAT BURNING - ADIPOQ
About the gene
The ADIPOQ gene produces a hormone called adiponectin that is involved in fat burning and helps to
control energy levels. Lower levels of adiponectin are associated with higher amount of fat around the
abdominal area and is linked to obesity and other obesity-related conditions.
* These percentages only refer to Caucasian population and can vary in different ethnic groups.
**Please note each gene variation has specific diet recommendations (steps to lose weight) which have been combined into
Your Recommended Diet, found in Section B.
1 February 2018, © 2017 My DNA Life. All rights reserved. www.mydna.life
8C GENETIC FINDINGS
TRIGLYCERIDE LEVELS - APOA5
About the gene
The APOA5 gene contributes to the regulation of triglyceride levels in your blood. While genetics play
a role in how likely you are to have high triglyceride levels, other factors can also contribute. These
include being overweight, consuming excess calories from refined and sugary foods, drinking too much
alcohol, and having Type 2 diabetes or kidney disease.
* These percentages only refer to Caucasian population and can vary in different ethnic groups.
1 February 2018, © 2017 My DNA Life. All rights reserved. www.mydna.life
9C GENETIC FINDINGS
CHOLESTEROL AND TRIGLYCERIDE LEVELS - LIPC
About the gene
The LIPC gene is involved in the way your body processes and breaks down dietary fats. There are
several types of dietary fats that are found in your blood: cholesterol (which can be measured as total
cholesterol or as its components such as high-density cholesterol (HDL-C) and low-density cholesterol
(LDL-C)) and triglycerides. While higher levels of HDL-C can be favourable this is not desirable for LDL-
C and triglycerides. The LIPC gene can influence the overall balance of these fats in your blood, which
in turn can affect your overall cardiovascular health.
* These percentages only refer to Caucasian population and can vary in different ethnic groups.
1 February 2018, © 2017 My DNA Life. All rights reserved. www.mydna.life
10C GENETIC FINDINGS
FATTY ACIDS PROCESSING - FADS1
About the gene
Fats are made of fatty acids, which can come from dietary sources but are also produced in small
amounts in the body. Fatty acids come in different types, such as short or long, saturated or
unsaturated, and can be grouped in further subtypes, like omega-3 and omega-6. Your body processes
fatty acids and rearranges them to produce all different types. FADS1 is specifically involved in the
processing and production of unsaturated omega-3 and omega-6 types. Some of the main functions of
omega-3 and omega-6 fatty acids include brain functioning, skin and hair growth, development and
reproduction. In addition, they can also influence the balance of blood triglycerides and cholesterol
(lipids); as such, FADS1 has an impact on the lipid profile too.
* These percentages only refer to Caucasian population and can vary in different ethnic groups.
1 February 2018, © 2017 My DNA Life. All rights reserved. www.mydna.life
11HEALTHCARE PROFESSIONAL SECTION
The following are detailed healthcare professional reports, which explain the clinical aspects of each
test.
UNDERSTANDING THE HEALTHCARE PROFESSIONAL REPORT
This report provides an in-depth analysis of the patient’s genetic profile, the research that we have used
as a basis for our recommendations and the associated outcomes. Each genotype is represented by
two letters, the arrangement of which determines the function of the gene that allows us to interpret
each result.
EVIDENCE RATING SYSTEM
We have developed a ratings system so that you can see our level of confidence in the research that we
have used as a basis for our recommendations. This is based on Oxford Centre for Evidence Based
Medicine – Level of Evidence, March 2009* and has been modified by myDNA to apply for genetic
tests.
LEVEL CAUSATION AND TREATMENT
» Systematic review of multiple RCT (meta-analysis)
» Systematic review of meta-analyses
» Single RCT (randomised controlled trial) with narrow confidence intervals
» Meta-analysis of cohort studies
» Prospective cohort with 80% follow up.
» Single RCT not in 5
» Good quality ecological research
» Genome-wide association studies
» Multiple case control studies
» Meta-analysis of case control
» Follow up cohort 1000 people
» Case control good quality
» Single case control not in 3
» Case-series
» Cross sectionalHEALTHCARE PROFESSIONAL SECTION
x
FTO GENE rs9939609 and rs1558902 evidence rating for risk
evidence rating for diet
GENOTYPE AT
GENE FUNCTION The FTO gene (Fat mass and obesity-associated protein) contributes to the regulation
of body size and body fat accumulation. The gene is highly expressed in the
hypothalamus area of the brain to control appetite and satiety (the feeling of being
full).
PREDICTED OUTCOME Moderate risk of obesity
GENETIC RESULT This individual has the AT genotype (one normal functioning allele (T) and one risk
INTERPRETATION variant allele (A)) for the FTO gene*.
This genetic finding is associated with:
• Less sensitivity to satiety cues
• Increased appetite, increased weight, increased BMI, increased fat mass and 20-30%
greater odds of obesity1
• Increased consumption of high fat and energy dense foods
• More frequent loss of control over the amount of food eaten (in children)3
The AT association with weight gain increases during childhood and peaks at 20 years
old.
*This genotype indicates that one or both the FTO variations tested has the obesity
risk allele.
DIET AND EXERCISE If the individual is overweight or obese and is trying to lose weight, one randomised
RECOMMENDATION controlled trial over 2 years was shown to result in long term weight loss. This diet
approach was a calorie restricted diet focussed on a higher protein content (25% of
the total daily calories as protein)5. This diet was shown to improve their body fat
distribution and resulted in more weight loss for this genetic finding. See additional
details below for more information on this diet.
Additionally, a high protein diet has been shown to promote satiety so this is another
reason this diet may suit individuals with AT genotype.
Regular moderate physical activity (at least 150 minutes per week) has also been
shown to reduce by 30% the risk of obesity associated with this genetic finding78.
Note: For successful weight loss, an individual approach should be taken that
considers appropriate intervention for lifestyle and diet that is sustainable for the
individual. Discussion with health professionals is advised.
References
1. Frayling TM, Timpson NJ, Weedon MN, et al. A common variant in the FTO gene is associated with body mass index and predisposes to childhood and adult obesity. Science 2007;
316(5826): 889-94.
2. Kara E, O'Daly OG, Choudhury AI, et al. A link between FTO, ghrelin, and impaired brain food-cue responsivity. J Clin Invest 2013; 123 (8): 3539-51
3. Tovar A, Emond JA, Hennessy E, Gilbert-Diamond D. An FTO Gene Variant Moderates the Association between Parental Restriction and Child BMI. PLoS One. 2016;11(5):e0155521.
4. Livingstone KM, Celis-Morales C, Papandonatos GD, Erar B, Florez JC, Jablonski KA, et al. FTO genotype and weight loss: systematic review and meta-analysis of 9563 individual
participant data from eight randomised controlled trials. BMJ. 2016;354:i4707.
5. Zhang X, Qi Q, Zhang C, Smith SR, Hu FB, Sacks FM, et al. FTO genotype and 2-year change in body composition and fat distribution in response to weight-loss diets: the POUNDS
LOST Trial. Diabetes. 2012;61(11):3005-11.
6. Wycherley TP, Moran LJ, Clifton PM, Noakes M, Brinkworth GD. Effects of energy-restricted high-protein, low-fat compared with standard-protein, low-fat diets: a meta-analysis of
randomized controlled trials. Am J Clin Nutr 2012; 96(6):1281-98.
7. Andreasen CH, Stender-Petersen KL, Mogensen MS, Torekov SS, Wegner L, Andersen G, et al. Low physical activity accentuates the effect of the FTO rs9939609 polymorphism on
body fat accumulation. Diabetes. 2008;57(1):95-101.
8. Kilpelainen TO, Qi L, Brage S, Sharp SJ, Sonestedt E, Demerath E, et al. Physical activity attenuates the influence of FTO variants on obesity risk: a meta-analysis of 218,166 adults and
19,268 children. PLoS Med. 2011;8(11):e1001116.
1 February 2018, © 2017 My DNA Life. All rights reserved. www.mydna.life
13HEALTHCARE PROFESSIONAL SECTION
MTIF3 gene rs4771122 and rs1885988 evidence rating for risk
evidence rating for diet
GENOTYPE AG
GENE FUNCTION MTIF3 is involved in the production of energy within mitochondria. The energy
produced is used to power the cellular function.
What are mitochondria?
Mitochondria are the powerhouses of the cell where biochemical processes of
respiration and energy production occur.
Some of the important functions of mitochondria include ATP synthesis, energy
balance, modulation of reactive oxygen species by electron transport chain.
PREDICTED OUTCOME Moderate risk of higher BMI
GENETIC RESULT This individual has the genotype AG (one risk variant allele (G) and one normal
INTERPRETATION functioning allele (A)) for the MTIF3 gene*.
This genotype is associated with increased body mass index (BMI)1,2,3. The risk of
increased BMI is intermediate between the AA genotype and the GG genotype.
The good news is that individuals with this genetic finding were shown to have more
success in maintaining their lost weight compared to those with the normal TT
genotype upon calorie restricted low fat diet (as described in recommendation
section). This study was a meta-analysis of randomised controlled trials.
* This genetic finding indicates that one or both the MTIF3 variations tested was
found to have the risk allele.
DIET AND EXERCISE If the individual is overweight/obese and is trying to lose weight, a calorie restricted
RECOMMENDATION (500-1000 calorie deficit per day) low fat diet (no more than 25% total fat) and
moderate physical activity (≥ 150-175 minutes per week) has been shown to result in
weight loss.
This diet approach is based on a meta-analysis of two randomised controlled trials
where individuals with the GG genotype were shown to lose the most amount of
weight compared to individuals with the AA genotype4,5,6.
References
1. Goumidi L, Cottel D, Dallongeville J, Amouyel P, Meirhaeghe A. Effects of established BMI-associated loci on obesity-related traits in a French representative population sample. BMC
Genet 2014; 15: 62.
2. Hong KW, Oh B. Recapitulation of genome-wide association studies on body mass index in the Korean population. Int J Obes (Lond) 2012; 36(8): 1127-30.
3. Speliotes EK, Willer CJ, Berndt SI, et al. Association analyses of 249,796 individuals reveal 18 new loci associated with body mass index. Nat Genet 2010; 42(11): 937-48.
4. Papandonatos GD, Pan Q, Pajewski NM, et al. Genetic Predisposition to Weight Loss and Regain With Lifestyle Intervention: Analyses From the Diabetes Prevention Program and the
Look AHEAD Randomized Controlled Trials. Diabetes 2015; 64(12): 4312-21.
5. Diabetes Prevention Program Research G. The Diabetes Prevention Program (DPP): description of lifestyle intervention. Diabetes Care 2002; 25(12): 2165-71.
6. Look ARG, Wadden TA, West DS, et al. The Look AHEAD study: a description of the lifestyle intervention and the evidence supporting it. Obesity (Silver Spring) 2006; 14(5): 737-52.
1 February 2018, © 2017 My DNA Life. All rights reserved. www.mydna.life
14HEALTHCARE PROFESSIONAL SECTION
PPARG gene rs1801282 evidence rating for risk
evidence rating for diet
GENOTYPE CC
GENE FUNCTION Excess food intake is regulated by a group of genes called the PPAR (peroxisome
proliferator-activated receptor) genes. In the presence of excess energy or calories
from food, the PPARG gene promotes fat storage and is therefore called the 'thrifty'
gene.
PREDICTED OUTCOME Normal conversion of excess energy into fat
GENETIC RESULT This individual has the CC genotype (two normal functioning alleles) for the PPARG
INTERPRETATION gene. This indicates that the PPARG gene produces a protein with normal ability to
convert excess calories into body fat for energy storage. Having this genetic finding is
associated with the risk of type 2 diabetes and high body mass index (BMI) upon high
calorie intake1.
The gene is known as the thrifty gene because it stores the maximum energy as body
fat.
DIET AND EXERCISE Individuals with this genetic finding are likely to be more sensitive to excess calorie
RECOMMENDATION intake and the type of fats within their diet.
Three observational studies suggested that high dietary fat intake in individuals with
this genotype could lead to high BMI.
In order to maintain and lose weight, it is advisable for these individuals to limit the
amount of total dietary fat intake to less than 25% and the saturated fat intake to less
than 10%. Intake of polyunsaturated fats from food sources such as avocado, nuts and
salmon is also favourable for this genetic finding5,6.
References
1. Gouda HN, Sagoo GS, Harding AH, Yates J, Sandhu MS, Higgins JP. The association between the peroxisome proliferator-activated receptor-gamma2 (PPARG2) Pro12Ala gene variant
and type 2 diabetes mellitus: a HuGE review and meta-analysis. Am J Epidemiol 2010; 171(6): 645-55.
2. Delahanty LM, Pan Q, Jablonski KA, et al. Genetic predictors of weight loss and weight regain after intensive lifestyle modification, metformin treatment, or standard care in the
Diabetes Prevention Program. Diabetes Care 2012; 35(2): 363-6.
3. Kilpelainen TO, Lakka TA, Laaksonen DE, et al. SNPs in PPARG associate with type 2 diabetes and interact with physical activity. Med Sci Sports Exerc 2008; 40(1): 25-33.
4. Ruchat SM, Rankinen T, Weisnagel SJ, et al. Improvements in glucose homeostasis in response to regular exercise are influenced by the PPARG Pro12Ala variant: results from the
HERITAGE Family Study. Diabetologia 2010; 53(4): 679-89.
5. Memisoglu, A., et al. (2003). "Interaction between a peroxisome proliferator-activated receptor gamma gene polymorphism and dietary fat intake in relation to body mass." Hum Mol
Genet 12(22): 2923-2929.
6. Franks, P.W., et al. (2007). "The Pro12Ala variant at the peroxisome proliferator-activated receptor gamma gene and change in obesity-related traits in the Diabetes Prevention
Program." Diabetologia 50(12): 2451-2460.
1 February 2018, © 2017 My DNA Life. All rights reserved. www.mydna.life
15HEALTHCARE PROFESSIONAL SECTION
ADIPOQ gene rs1501299 evidence rating for risk
evidence rating for diet
GENOTYPE TT
GENE FUNCTION The ADIPOQ gene contains the information to produce hormone adiponectin.
What is adiponectin?
Adiponectin is a hormone produced by the adipocytes (fat cells) to initiate fat break
down, boost metabolism, and to help regulate glucose concentration in the blood.
Lower adiponectin has been correlated to higher BMI and insulin resistance which may
lead to obesity and other chronic diseases. Low adiponectin levels are also associated
with the amount of visceral fat (fat around the abdominal area).
Adiponectin hormone level increases with weight loss and decreases with weight gain.
PREDICTED OUTCOME Normal adiponectin levels
GENETIC RESULT This individual has two normal alleles (TT) for the ADIPOQ (adiponectin) gene. This
INTERPRETATION genotype has not been associated with reduced adiponectin levels or a risk of obesity.
It is important to note that being obese or overweight naturally decreases your
adiponectin levels.
Ethnic difference affects adiponectin concentrations. White Europeans normally have
higher adiponectin compared to South Asians and Chinese5.
Adiponectin levels are lower in males than females, which may be attributed to the
inhibitory effect of testosterone on adiponectin production6.
DIET AND EXERCISE No specific diet has been indicated for this genetic finding. Specific diet may be
RECOMMENDATION indicated by the result of other tests.
References
1. Lu JF, Zhou Y, Huang GH, Jiang HX, Hu BL, Qin SY. Association of ADIPOQ polymorphisms with obesity risk: a meta-analysis. Hum Immunol 2014; 75(10): 1062-8.
2. Gao M, Ding D, Huang J, Qu Y, Wang Y, Huang Q. Association of genetic variants in the adiponectin gene with metabolic syndrome: a case-control study and a systematic meta-analysis in the Chinese
population. PLoS One 2013; 8(4): e58412.
3. Hara K, Boutin P, Mori Y, et al. Genetic variation in the gene encoding adiponectin is associated with an increased risk of type 2 diabetes in the Japanese population. Diabetes 2002; 51(2): 536-40.
4. Shin MJ, Jang Y, Koh SJ, et al. The association of SNP276G>T at adiponectin gene with circulating adiponectin and insulin resistance in response to mild weight loss. Int J Obes (Lond) 2006; 30(12): 1702-
8.
5. Mente A, Razak F, Blankenberg S, et al. Ethnic variation in adiponectin and leptin levels and their association with adiposity and insulin resistance. Diabetes Care 2010; 33(7): 1629-34.
6. Cheung CY, Hui EY, Cheung BM, et al. Adiponectin gene variants and the risk of coronary heart disease: a 16-year longitudinal study. Eur J Endocrinol 2014; 171(1): 107-15.
7. Reis CE, Bressan J, Alfenas RC. Effect of the diet components on adiponectin levels. Nutr Hosp 2010; 25(6): 881-8.
8. Yu N, Ruan Y, Gao X, Sun J. Systematic Review and Meta-Analysis of Randomized, Controlled Trials on the Effect of Exercise on Serum Leptin and Adiponectin in Overweight and Obese Individuals. Horm
Metab Res 2017; 49(3): 164-73.
1 February 2018, © 2017 My DNA Life. All rights reserved. www.mydna.life
16HEALTHCARE PROFESSIONAL SECTION
APOA5 gene rs662799 evidence rating for risk
evidence rating for diet
GENOTYPE TT
GENE FUNCTION APOA5 (Apolipoprotein A5) is a major gene that regulates triglyceride concentrations
in the blood. Carriers of the risk allele have been shown to be more susceptible to
higher triglyceride levels than those with the normal allele1. However, studies have
also shown that dietary and lifestyle changes can improve triglyceride levels in both
the normal and high risk allele variants.
PREDICTED OUTCOME Normal risk of elevated triglyceride levels
GENETIC RESULT This individual has the TT genotype (two normal functioning alleles) for the APOA5
INTERPRETATION gene.
This TT genotype is associated with lower fasting triglyceride levels compared to the
CC genotype2.
DIET AND EXERCISE No specific diet has been indicated for this genotype. This genotype is not associated
RECOMMENDATION with an increased risk of having high triglyceride levels. However, diet and lifestyle
factors can still contribute to elevated triglyceride levels. These include:
• Excessive alcohol consumption
• Type 2 diabetes
• Excessive food consumption, in particularly a high intake of refined carbohydrates,
such as soft drinks, processed breads, cereals, cakes and lollies.
• Excessive consumption of high fat foods, in particularly saturated fats.
In the presence of any of the above factors, consider measuring triglyceride levels.
Diet
A balanced diet would be suitable provided there are no other medical conditions that
would require a specialised diet. Refer to
http://www.who.int/nutrition/publications/nutrient/en/ for further information.
Exercise
Standard exercise advice applies, assuming there are no other factors to consider.
References
1. Zhao T, Zhao J. Association of the apolipoprotein A5 gene -1131 T>C polymorphism with fasting blood lipids: a meta-analysis in 37859 subjects. BMC Med Genet 2010; 11:
120.
2. De Caterina R, Talmud PJ, Merlini PA, et al. Strong association of the APOA5-1131T>C gene variant and early-onset acute myocardial infarction. Atherosclerosis 2011; 214(2):
397-403.
3. Kang R, Kim M, Chae JS, Lee SH, Lee JH. Consumption of whole grains and legumes modulates the genetic effect of the APOA5 -1131C variant on changes in triglyceride and
apolipoprotein A-V concentrations in patients with impaired fasting glucose or newly diagnosed type 2 diabetes. Trials 2014; 15: 100.
4. Lai CQ, Corella D, Demissie S, et al. Dietary intake of n-6 fatty acids modulates effect of apolipoprotein A5 gene on plasma fasting triglycerides, remnant lipoprotein
concentrations, and lipoprotein particle size: the Framingham Heart Study. Circulation 2006; 113(17): 2062-70.
1 February 2018, © 2017 My DNA Life. All rights reserved. www.mydna.life
17HEALTHCARE PROFESSIONAL SECTION
LIPC GENE rs1800588 evidence rating for risk
evidence rating for diet
GENOTYPE CC
GENE FUNCTION The LIPC (Lipase C, Hepatic Type) gene contains the information to produce an
enzyme called hepatic lipase.
What is hepatic lipase?
The hepatic lipase enzyme helps to regulate lipids such as cholesterol and
triglycerides in the blood. It does so by controlling the balance of the lipid transport
molecules e.g. LDL cholesterol (LDL-C) and HDL cholesterol (HDL-C) in the blood. It
also breaks down triglycerides for energy use. High levels of HDL-C are considered
beneficial while high levels of LDL-C are not desirable.
PREDICTED OUTCOME Normal hepatic lipase enzyme activity
GENETIC RESULT This individual has the CC genotype for the LIPC gene. Normal activity of the hepatic
INTERPRETATION lipase enzyme is predicted.
DIET AND EXERCISE Although this genetic result indicates normal hepatic lipase enzyme activity, other
RECOMMENDATION factors such as your diet or lifestyle choices may affect the overall lipid profile.
A healthy balanced diet is important for maintaining healthy cholesterol balance in the
blood. Being overweight/obese and increased intra-abdominal fat may increase the
risk of cholesterol imbalance.
A balanced diet would be suitable provided there are no other medical conditions
that would require a specialised diet. Refer to
http://www.who.int/nutrition/publications/nutrient/en/ for further information.
References
1. Isaacs A, Sayed-Tabatabaei FA, Njajou OT, Witteman JC, van Duijn CM. The -514 C->T hepatic lipase promoter region polymorphism and plasma lipids: a meta-analysis. J Clin
Endocrinol Metab 2004; 89(8): 3858-63.
2. Xu M, Ng SS, Bray GA, et al. Dietary Fat Intake Modifies the Effect of a Common Variant in the LIPC Gene on Changes in Serum Lipid Concentrations during a Long-Term Weight-Loss
Intervention Trial. The Journal of nutrition 2015; 145(6): 1289-94.
3. Ordovas JM, Corella D, Demissie S, et al. Dietary fat intake determines the effect of a common polymorphism in the hepatic lipase gene promoter on high-density lipoprotein
metabolism: evidence of a strong dose effect in this gene-nutrient interaction in the Framingham Study. Circulation 2002; 106(18): 2315-21.
4. Grarup N, Andreasen CH, Andersen MK, et al. The -250G>A promoter variant in hepatic lipase associates with elevated fasting serum high-density lipoprotein cholesterol modulated
by interaction with physical activity in a study of 16,156 Danish subjects. J Clin Endocrinol Metab 2008; 93(6): 2294-9.
1 February 2018, © 2017 My DNA Life. All rights reserved. www.mydna.life
18HEALTHCARE PROFESSIONAL SECTION
FADS1 GENE rs174546 evidence rating for risk
evidence rating for diet
GENOTYPE CC
GENE FUNCTION The FADS1 (Fatty Acid Desaturase 1) gene is involved in the processing of omega-3
and omega-6 long chain polyunsaturated fatty acids (LC-PUFA), thereby regulating the
levels of essential LC-PUFAs such as arachidonic acid (AA), eicosapentaenoic acid
(EPA) and docosahexaenoic acid (DHA).
PREDICTED OUTCOME Normal Fatty Acid Desaturase 1 enzyme activity
GENETIC RESULT These individuals are likely to have normal concentrations of processed omega-6
INTERPRETATION PUFAs arachidonic acid; AA) and omega-3 PUFAs (eicosapentaenoic acid; EPA) and
docosahexaenoic acid; DHA), due to the normal function of the enzyme2,3,4.
DIET AND EXERCISE Although this genetic result has not been associated to abnormal triglycerides or
RECOMMENDATION cholesterol levels, other factors such as your diet or lifestyle choices may affect your
overall lipid profile.
A healthy balanced diet is important for maintaining healthy lipid balance in the
blood.
Foods rich in omega-3 fatty acids
Three of the most beneficial forms of omega-3 fatty acid are eicosapentaenoic acid
(EPA), docosahexaenoic acid (DHA), and alpha-linoleic acid (ALA). EPA and DHA are
commonly found in fish.
Linoleic acid (LA) is an essential fatty acid found in vegetable oils that breaks down
into gamma-linoleic acid (GLA).
The World Health Organisation recommends adults consume at least 250 mg per day
of long-chain omega-3 fatty acids. This can be achieved by eating a combination of
two to three serves of oily fish every week and supplementing intake with fish oil
supplements (oil or capsule) and omega-3 enriched food or drinks (such as eggs,
bread and milk). Factors such as your diet or lifestyle choices may affect your overall
lipid profile.
A healthy balanced diet is important for maintaining healthy lipid balance in the
blood.
References
1. Bokor, S., et al., Single nucleotide polymorphisms in the FADS gene cluster are associated with delta-5 and delta-6 desaturase activities estimated by serum fatty acid ratios. J Lipid
Res, 2010. 51(8): p. 2325-33.
2. Dumont, J., et al., Dietary linoleic acid interacts with FADS1 genetic variability to modulate HDL-cholesterol and obesity-related traits. Clinical Nutrition, 2017.
3. Lemaitre, R.N., et al., Genetic loci associated with plasma phospholipid n-3 fatty acids: a meta-analysis of genome-wide association studies from the CHARGE Consortium. PLoS Genet,
2011. 7(7): p. e1002193.
4. AlSaleh, A., et al., Genetic predisposition scores for dyslipidaemia influence plasma lipid concentrations at baseline, but not the changes after controlled intake of n-3 polyunsaturated
fatty acids. Genes Nutr, 2014. 9(4): p. 412.
1 February 2018, © 2017 My DNA Life. All rights reserved. www.mydna.life
19HEALTHCARE PROFESSIONAL SECTION
GENETIC RESULT SUMMARY
GENE GENOTYPE PREDICTED FUNCTION
FTO AT Moderate risk of obesity
MTIF3 AG Moderate risk of higher BMI
PPARG CC Normal conversion of excess energy into fat
ADIPOQ TT Normal adiponectin levels
APOA5 TT Normal risk of elevated triglyceride levels
LIPC CC Normal hepatic lipase enzyme activity
FADS1 CC Normal Fatty Acid Desaturase 1 enzyme activity
LEGEND: For health implications Favourable Less Favourable Least Favourable
The overall recommended diet is found in section B. Such diet has been designed by combining the
recommendations for each individual gene into one practical actionable advice.
The patient has access to further details about the recommended diet, including calorie restriction,
serving size guide and sample menu, on the Explore myDNA Portal.
1 February 2018, © 2017 My DNA Life. All rights reserved. www.mydna.life
20REPORT PREPARED BY: Laboratory Results provided by GenSeq Labs South Yarra Victoria, Australia - A/Prof Les Sheffield FRACP, Approved Pathology Practitioner and Clinical Geneticist. Report repared by My DNA Life Australia Pty Ltd team of Clinical Geneticists, Molecular Geneticists, Accredited Practicing Dietitian, Clinical Pharmacists. MYDNA CLINICAL SUPPORT For all health practitioner enquiries, please contact myDNA clinical support E: clinical@mydna.life 1 February 2018, © 2017 My DNA Life. All rights reserved. www.mydna.life
You can also read