CITY BUDGET 2020 21 - (FINAL) ADOPTED 22 June 2020 - City of Gold Coast
←
→
Page content transcription
If your browser does not render page correctly, please read the page content below
CITY BUDGET
2020 – 21
A BALANCED BUDGET WITH
A SUSTAINABLE LONG-TERM
FINANCIAL OUTLOOK
(FINAL) ADOPTED
22 June 2020
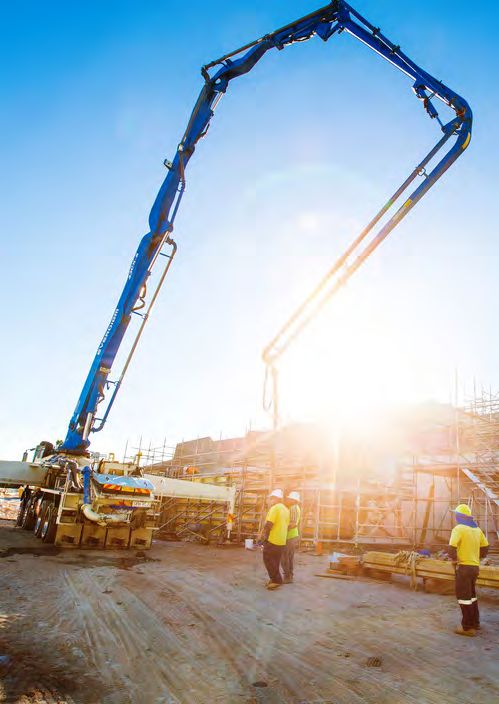
Construction, Gold Coast Cultural PrecinctAnnual Plan 2020-21 City Budget
CITY BUDGET
2020-21
A B A L AN C ED BU DG E T W IT H A
SU ST AI NA B L E LO NG - T ERM
FIN A NC I AL O UT L O O K
(FINAL) ADOPTED 22 JUNE 2020
This page is intentionally blank
Page 12Annual Plan 2020-21 Table of contents
City Budget Contents
2. City Budget 2020-21……………………………………………………………………………...………………… 11
2.1 City Budget 2020-21 overview………………………………………..…………………………………… 13
2.2 Revenue and expenditure (including rates and charges)……………………………..………………… 16
2.3 Long-term financial forecast………………………………………………………………...……………… 20
2.4 Financial performance……………………………………………………………….……………………… 21
2.5 2019 credit review……………………………………………………………………….…………………… 25
2.6 Financial sustainability indicators……………………………………………………..…………………… 25
2.7 Management of operating position……………………………………………………….………………… 26
2.8 Management of debt………………………………………………………………………………….…… 26
2.9 Management of infrastructure assets……………………………………………………………..……… 26Annual Plan 2020-21 City Budget
2.1 City Budget 2020-21 overview
2.1.1 Total budget for 2020-21
The 2020-21 Budget has been developed in alignment with the Corporate Plan, Annual City Operational Plan and
Long-Term Financial Plan.
It continues to deliver high standard, value for money services to the community and provides funding for projects and
programs that will improve the city transport network, deliver new community and cultural assets, diversify and
strengthen the Gold Coast economy and protect and enhance the Gold Coast lifestyle and environment.
The total budget for 2020-21 is $1,720 million, made up as follows:
capital expenditure $575 million
services and operating costs $1,065 million
debt repayments (principal) $80 million.
2.1.2 Key initiatives for 2020-21
The following key initiatives are included in the budget:
1. Community and Businesses Support to assist in the recovery from COVID-19 impacts
o $9.1 million of rates relief for 137,800 residential properties by providing every principal place of residence
ratepayer a $64 rebate on their rates notice, resulting in 93,000 residential properties receiving a zero
increase or a reduction in their total rates & charges (excluding State bulk water costs) for 2020-21.
o $3.6 million rates relief for 265,270 properties by keeping water consumption and sewerage volumetric
charges at the same level as 2019-20. This will benefit both residential and non-residential water and sewer
customers.
o As a result of a restructure of the funding for major events on the Gold Coast and in response to COVID-19,
commercial and tourist rental properties will benefit as follows:
o The Tourism & Economic Diversification Differential Rate for 2020-21 will remain the same as
2019-20, with 50% ($2.6 million) of the Major Events Gold Coast operating grant funding model being
deferred for 12 months i.e. 25,600 commercial and tourist rental properties will benefit from a 0%
increase.
o The Special Rates paid in 2019-20 by commercial and tourist rental properties in the tourism and
business hubs of Surfers Paradise, Broadbeach, Southern Gold Coast and Southport have been
eliminated in 2020-21 i.e. 11,500 commercial and tourist rental properties will save $8.45 million in
special rates, with 91% of these properties to receive a reduction in their total rates & charges.
o $2.2 million relief and support initiatives through the water and waste hardship program, providing financial
relief and other support to residential and commercial customers experiencing difficulties in paying their water,
sewerage and waste bills.
o $1.9 million relief through the general and separate rates bill hardship program for customers experiencing
difficulties paying their general and separate rates bill.
o $2.15 million relief by waiving or reducing some fees and charges for businesses, community groups and
sporting organisations, including roadside dining fees for 2020-21.
o $1.45 million relief for community organisations through targeted grants programs and other support initiatives.
2. Economic Stimulus and Recovery
o $4.3 million set aside to allocate toward targeted stimulus measures to be decided by Council.
o $3.0 million has been set aside for major events, tourism and economic diversification opportunities to be
identified.
o An additional $250,000 contribution to Study Gold Coast to support the return of international students
o An additional $1.25 million (making a total of $1.75 million) to fast track planning for Light Rail Stage 4
o $7.5 million in accelerated capital works included in an expanded economic boosting 2020-21 capital works
program totalling $575 million.
Page 13Annual Plan 2020-21 City Budget
3. Light Rail
o Stage 3 - Council continues to work with the State Government in the planning of Stage 3 of the Light Rail
from Broadbeach South to Burleigh Heads. Council is committed to an $82 million cash contribution to the
project, with the first payment of $7 million to be paid in 2020-21. In addition, Council will allocate $9.5 million
for indirect (internal) costs, of which $1.9 million will be incurred in 2020-21.
o Stage 4 - Council will contribute $1.75 million in 2020-21 to identify the route options for the extension of the
Light Rail from Burleigh Heads to Coolangatta.
4. Cultural Precinct
o $35.4 million in 2020-21 to complete work on the Art Gallery at HOTA. All these works contribute to the $130
million first stage (Stage 1A & 1B) of the Cultural Precinct including the amphitheatre, the green bridge and
the art gallery.
o Cultural Precinct Mid-life Review – an amount of $500,000 has been provided to conduct a mid-life review of
the Cultural Precinct. This review will assist Council when considering the funding of future stages of the
cultural precinct. The review will:
• Investigate the implications of any changes to the master plan
• Review and re-define functional requirements of remaining major components
• Prepare preliminary cost estimates
• Develop recommendations for delivery sequencing.
o Cultural Precinct Playground – it is proposed to replace the existing children's playground with a significant
artist led playground. Concept plans and more detailed cost estimates will be developed in 2020-21 through
the integration of artist involvement, community engagement and integrated landscape and playground
architectural designs - $290,000
o Versatile Outdoor Space (VOS) Activation – an amount of $100,000 has been allocated to activate the VOS
following the easing of the COVID-19 restrictions.
5. Asset Renewals
o Funding for the renewal of infrastructure assets $138.6 million as identified in Council’s Asset Management
Plans, to ensure the long-term sustainability of City assets and service levels to the community.
6. City Transport
o Continued commitment to an integrated, accessible and effective city transport system with allocations for the
following key initiatives and services:
• New and Upgraded Roads - $81.7 million
• Road and Bridges Rehabilitation and Renewals - $50.6 million
• Continue work on the bridge duplication across the Nerang River linking Isle of Capri to the Gold
Coast Highway to increase traffic flow in the area - $24.0 million (total cost of $60 million)
• Expansion of Sundale Bridge to five lanes and a capacity upgrade at the Waterways Drive/Gold Coast
Highway intersection - $12.5 million (total cost of $31 million)
• Roads and Bridges Maintenance - $18.9 million
• New and Improved Infrastructure for Active Transport Modes - $18.8 million
• Public Transport - Free Seniors Travel - $0.9 million
7. Ocean Beaches
o Council is committed to the protection and stabilisation of the city’s beaches and infrastructure, with the
following projects included:
• Construct the Surfers Paradise Sand Nourishment Pipeline to improve the resilience of beaches at
Surfers Paradise, Narrowneck and Main Beach - $4.1 million
• Construct a seawall at Wagawn St Tugun - $1.2 million
Page 14Annual Plan 2020-21 City Budget
8. Sporting and Community Facilities
o Complete the Pimpama Sports Hub at Heritage Park Pimpama. Planned works include a new aquatic centre,
community centre, netball courts and tennis courts - $40.6 million
o Renew and upgrade facilities at Miami Aquatic Centre - $8.5 million
o New Coomera Civic Hub – regional community facility incorporating a library, community centre, auditorium,
customer service and Councillor office; 2020-21 budget is for schematic and detailed design and development
approval process - $7.0 million
o Broadbeach Community Precinct –primarily for renewal and upgrade of the Albert Waterways Community
Centre and Life Education building - $4.0 million
o Palm Beach Aquatic Centre –progress design development and tendering for the redevelopment of the site
including an additional 25 metre outdoor pool and youth/community centre - $2.2 million
9. Parks, Natural Areas and Recreation
o Complete design and commence construction of Robina City Parklands - $8.3 million
o Complete design and commence construction of Stage 3B Southport Broadwater Parklands - $5.4 million
o Strategic land acquisition adjacent to Firth Park for future expansion - $2.6 million
o Upgrade Pizzey Park skateboard park to an Olympic standard - $1.7 million
10. Tourism and Economic Diversification
o Funding has been provided for tourism and economic diversification, including:
• Contribution to Destination Gold Coast - $15.5 million
• Support and sponsorship of events and festivals - $4.1 million
• Contribution to Major Events Gold Coast - $9.3 million
• Contribution to Study Gold Coast - $3.275 million
• Contribution towards Super Yacht berth at Southport Yacht Club (joint funding with State
Government) - $2.4 million
• $1.9 million for future allocation by Council to initiatives that will support the tourism industry on the
Gold Coast
11. Information Management
o $7.7 million will be spent to upgrade some of Council’s core systems, including:
• Upgrade from unsupported versions and transition to Cloud based systems - $4.9 million
• $2.7 million Modern Workspace Program which will improve data access, system efficiencies and staff
mobility.
o $1.4 million to replace Council’s website.
12. Water and Sewerage
o Upgrade Coombabah sewerage treatment plant - $68.1 million
o Progress the development of the Long Term Recycled Water Release Plan Stage 1 - $16.1 million
o Deliver infrastructure to expand the recycled water network for improved utilisation of recycled water across
the city - $14 million
13. Local Area Works
o An amount of $750,000 has been provided for each Divisional Councillor and $300,000 for the Mayor’s whole
of city local area works.
Page 15Annual Plan 2020-21 City Budget
2.1.3 Debt management
Council compares favourably against industry benchmarks.
Debt has been prudently managed with new borrowings of $128 million for 2020-21 representing only 22% of the
total capital works program of $575 million.
Total debt is expected to increase by $48 million in 2020-21 (from $615 million in June 2020 to $663 million in June
2021), taking into account principal repayments of $80 million.
Council is well within industry benchmarks used to measure debt and its impact on financial sustainability. The net
financial liabilities ratio (total liabilities less current assets all divided by total operating revenue) forecast for 2019 -
20 is -1% which is well below the maximum benchmark of 60% used by the Department of Infrastructure, Local
Government and Planning to assess Council’s long-term financial sustainability. The negative ratio actually
indicates that cash assets will be higher than total debt.
2.1.4 Value for money
The Value for Money Program has delivered significant savings annually. A number of value for money initiatives have
or will be implemented, including:
End of Year cash surplus (including value for money bankable savings) target of $16 million for 2019-20 to
underpin the 2020-21 budget and a further $16.2 million to contribute to COVID-19 related relief for community and
business.
Energy Management - ongoing initiatives to reduce energy costs.
Fibre Optic Network - delivery of upgraded fibre optic networks to support City operations and enhance broadband
services for businesses and residents.
2.2 Revenue and expenditure (including rates and charges)
The overall rates and charges notice results in a 0.1% decrease (excluding State Government Bulk Water Charges)
for a residential non-Community Title Property dwelling being a principal place of residence paying the average
general rate after the $64 rebate is applied.
City Budget supporting documents provide further details of the Rates and Charges for 2020-21. The table below
represents the total rate bill for a property that is a non-community titled principal place of residence paying the
average general rate.
Page 16Annual Plan 2020-21 City Budget
Table 1: Summary of total rates and charges 2020-21
Average General Rate (residential non-Community Title Property (CTP)
dwelling being principal place of residence only)
2019-20 2020-21
Total Rates & Total Rates &
Total Increase Total Increase
Charges Charges
% %
$ $
General Rate $1,537.16 2.94% $1,590.96 3.50%
Early Payment Discount @ 10.0% ($153.72) 2.94% ($159.10) 3.50%
Residential Financial Relief Rebate $0.00 N/A ($64.00) N/A
Sewerage $724.12 0.00% $724.12 0.00%
Water Service $212.08 0.00% $212.08 0.00%
Water Consumption - 2020-21 rate $1.09/kl
$196.20 0.00% $196.20 0.00%
(Based on 180kl per annum)
Waste Management Utility Charge $287.30 2.50% $294.48 2.50%
Net Rates and Charges $2,803.15 1.69% $2,794.75 (0.30%)
City Transport Improvement Separate Charge $128.30 1.83% $133.30 3.90%
Recreational Space Separate Charge $29.00 0.00% $29.00 0.00%
Open Space including Koala Habitat, Maintenance and
$46.00 12.20% $46.00 0.00%
Enhancement Separate Charge
Final Volunteer Fire Brigade Contribution Separate Charge $1.00 (50.00%) $1.00 0.00%
Net Total Rates and Charges (Excl. State Charges) $3,007.45 1.68% $3,004.05 (0.11%)
State Charges Outside of Council Control
Water Consumption - (State Gov't.) Bulk Water
component $3.01/kl to $3.12/kl (Based on 180kl per $541.80 3.44% $561.96 3.72%
annum)
Net Total Rates and Charges $3,549.25 1.95% $3,566.01 0.47%
Note 1: The above rate bill separately displays State bulk water costs.
Note 2: The water consumption charge includes the State Government bulk water charge. The bulk water charge is $3.12/kl
which represents 74.12% of the total consumption charge. This is a 3.72% increase on the 2019-20 bulk water charge.
Excluding Including State Excluding Including State
State Charges Charges State Charges Charges
Total Rate Increase After Discount Outside of Outside of Outside of Outside of
Council Council Council Council
Control Control Control Control
Annual Increase $49.82 $67.82 ($3.40) $16.76
Weekly Increase $0.96 $1.30 ($0.07) $0.32
Page 17Annual Plan 2020-21 City Budget
2.2.1 Expenditure programs 2020-21
The following table provides a breakdown of the major expenditure programs to be undertaken by Council as part of
the 2020-21 budget (excluding internal transfers to reserves). Council's expenditure programs are guided by the
priorities identified in the Gold Coast 2022 Corporate Plan. The city’s population growth is accompanied by demands
for roads, transport and drainage, park and recreational facilities and social infrastructure such as libraries, community
centres and aquatic facilities etc.
Compared to 2019-20, Council’s total budget indicates a minor decrease of $9.8 million with an increase of
$26.5 million in capital works.
Major changes in operating expenditure include:
planning and early works for Light Rail Stage 3 - $8.9 million
planning and for Light Rail Stage 4 - $1.8 million
water utility billing stabilisation software improvements - $5.0 million
HOTA operating contribution increase - $4.2 million
change in accounting treatment of a new Waste Management Levy payable to the State Government that was
included as an operating expense in 2019-20 but is not in 2020-21 resulting in a decrease of - $29.9 million
Major increases in capital expenditure include:
Water and Sewerage upgrade and renewal projects - $18 million
City Transport projects including works starting on Coomera Town Centre road developer infrastructure works -
$12 million
Coomera Civic Hub - $7 million
Pimpama Sports Hub - $6.1 million
HOTA, Home of the Arts, Art Gallery - $6.4 million
Southport Broadwater Parklands - $4.7 million
Greenheart Stage 1 (Robina City) - $4.5 million
Table 2: Expenditure by program
2019-20 2020-21
($ million) ($ million)
Program 1: City Planning 55.3 55.6
Program 2: City Transport 280.9 292.1
Program 3: Community Health and Safety 85.9 82.8
Program 4: Conservation and Environment 44.9 33.8
Program 5: Economic Development 55.9 53.2
Program 6: Parks, Recreation and Culture 324.9 344.2
Program 7: Waste Management 143.6 112.1
Program 8: Water and Sewerage 449.9 473.1
Program 9: Organisational Capability 195.3 188.5
Program 10: Internal Services 93.2 84.6
Total 1,729.8 1,720.0
Page 18Annual Plan 2020-21 City Budget
2.2.2 Source of funds 2020-21
Council’s total budget of $1,720 million is funded from various revenue sources. The following table provides a
breakdown of the major sources of funding used to underpin Council's 2020-21 budget:
Table 3: Source of funds
2019-20 2020-21
($ million) ($ million)
Brought Forward Surplus 21.5 32.2
General Rates (net) 498.0 509.3
Water and Sewerage Charges 514.5 515.6
Other Rates and Charges 151.1 149.6
Loans 73.4 128.6
Infrastructure Charges to fund capital works 174.0 190.1
Fees and Charges 138.3 97.8
Grants and Subsidies 42.2 40.5
Other (e.g. interest, rental and lease income) 58.4 43.8
Transfers from Reserves 58.4 12.5
Total 1,729.8 1,720.0
Council’s borrowing program for 2020-21 is for the provision of long-term infrastructure assets as follows:
Table 4: Loan program 2020-21
Loan Amount
Funding of Repayments
($ million)
Cultural Precinct 48.0 General Revenue
Pimpama Sports Hub 18.0 General Revenue
Transport Improvement 15.0 General Revenue
Coomera Civic Hub 4.9 General Revenue
Total General Borrowings 85.9
Transport Improvement 28.8 City Transport Improvement Separate Charge
Light Rail 8.9 City Transport Improvement Separate Charge
Tourist Parks 2.4 Tourist Parks Revenue
Waste Management 2.2 Waste Management Utility Charge
Centre Improvement Program 0.4 CIP – Special Rates Benefited Area
Total Loans 128.6
Page 19Annual Plan 2020-21 City Budget
2.3 Long-term financial forecast
2.3.1 Financial goals and strategies
Detailed 10 Year Service Financial Forecasts (10 year financial plans) are maintained for the following 11 key
functional areas and incorporated into the consolidated long-term financial forecast.
City Transport
Waste Services
Beaches and Waterways
Flooding and Drainage
Parks, Natural Areas and Recreation
Major Sporting Venues and Aquatic Centres
Library Services
Community Centres
Tourist Parks
Water and Sewerage Services
Information Management.
In preparing the long-term financial forecast Council has sought to:
Provide financial relief and support to residents, community groups and businesses to assist in the recovery from
COVID-19 impacts
minimise rate increases
prudently manage debt
maintain current high level value for money services to the community
fully fund asset renewal requirements in order to maintain infrastructure assets
reduce congestion on roads
provide funding for community and sporting facilities
fund key initiatives included in Council’s key City Strategies
continue to achieve value for money savings to assist in keeping rate increases to a minimum.
Financial decisions are guided by corporate policies, strategies and principles of effective financial management.
Council regularly models financial performance, financial position and cash flow forecasts to monitor the long-term
sustainability of decisions. The long-term financial outlook is updated quarterly and a comprehensive analysis is
undertaken between July and December each year, and this sets the context for the development of the annual
budget. Projected financial statements are included in the City Budget supporting documents section of this annual
plan.
Page 20Annual Plan 2020-21 City Budget
2.3.2 Long-term financial outlook
Council’s long-term financial model includes a set of key assumptions for the nine years beyond 2020-21, which
represents the first year of the forecast period. These assumptions do not reflect final Council policy but provide a
guide to future financial performance. Key inclusions in the forecast include:
Upgrading ageing facilities including the Miami Aquatic Centre ($19 million), Palm Beach Aquatic Centre ($53
million) and Broadbeach Community Precinct ($15 million)
complete stage 1 of the Cultural Precinct at Evandale Parklands, with a total capital cost of $130 million (Stage 1A
and 1B), including the construction of the amphitheatre (completed in 2017-18), pedestrian bridge (completed in
2019-20), art gallery and parklands
partnering with the State government to deliver Stage 3 of the Light Rail from Broadbeach South to Burleigh Heads
($92m) and to plan for Stage 4 from Burleigh Heads to Coolangatta.
improving the transport network to reduce traffic congestion including additional lanes being added to the Isle of
Capri bridge ($60m) and Sundale bridge ($31m) and the upgrade of Old Coach Road, Reedy Creek to four lanes
and a connection through to Bermuda Street ($92 million)
construction of the Pimpama Sports Hub incorporating an aquatic centre, community centre, netball courts and
tennis courts at Heritage Park Pimpama to be completed in 2021 at a cost of $80 million
development of a civic hub at Coomera including a library and community centre (approx. $105m)
targeted annual value for money savings of $16 million to be achieved
the delivery of projects included in the Local Government Infrastructure Plan which will deliver the trunk
infrastructure required in the city to meet demands created by growth and new development.
Funding plans are in place for all major capital projects included in the adopted 10 year plan.
2.4 Financial performance
Council’s financial performance can be evaluated against four key pillars:
1. competitive rating levels and user pays charges
2. debt levels and capacity to service debt
3. the condition of Council’s infrastructure assets
4. the scope and standard of services.
In terms of financial performance and sustainability, Council is performing well against these four pillars. Council
continues to minimise discretionary expenditure and deliver value for money savings.
2.4.1 Competitive rating levels and user pay charges
Council’s rates and utility charges remain competitive with other South East Queensland Councils, particularly taking
into account comparative levels of service and the significant impact of external costs such as bulk water and
electricity, which make up a significant portion of total operating costs.
In accordance with the Gold Coast 2022 Corporate Plan, average rate increases throughout the ten year forecast
have been kept as near to CPI as possible while continuing to provide high quality value for money services.
Council applies the principles of equity, effectiveness and efficiency, simplicity and sustainability in setting rates and
utility charges as set out in the Revenue Policy.
Council’s Revenue Policy is included in the City Budget supporting documents of this Annual Plan.
Page 21Annual Plan 2020-21 City Budget
2.4.2 Debt levels and capacity to service debt
Council is focused on responsibly managing debt in the short and long-term.
Total debt is forecast to increase over the next few years from $615 million in June 2020 to a peak of $825 million in
June 2025 as Council delivers a number of major infrastructure projects to reduce congestion on roads, expand the
public transport network and to meet demand for new and improved community facilities. Debt is then projected to
decrease back to $612 million by June 2030.
Despite the increased debt outlook in the medium-term, Council will remain well within debt ratio benchmarks set by
the State Government and Queensland Treasury Corporation (QTC) as shown in the ratio tables in section 2.8. The
debt service ratio (debt and interest payments divided by operating revenue) for 2020-21 is estimated at 8% and will
reduce to 6% by 2029-30 (well below the benchmark of 20%), demonstrating Council’s ability to adequately service
debt commitments.
The level of borrowings drawn each financial year is carefully monitored through long-term financial modelling to
ensure affordability. In addition to internal assessments, Council is required to submit an annual application to the
State Government, which includes the long-term financial forecast, to gain approval for all planned borrowings. QTC
undertakes a detailed annual credit assessment of Council and makes recommendations to the State government
regarding sustainable borrowing levels. The 2019 credit rating by QTC was maintained as ‘Sound’ with ‘Positive’
outlook.
Council seeks to minimise general rates as a funding source to repay debt, preferring to rely on specific revenue
sources that are matched to the infrastructure being constructed.
Debt is only used for capital purposes. The term of the debt is matched, as best as possible, to the life of the asset up
to the maximum term imposed by QTC. Borrowings usually have terms of between 10 and 15 years. Occasionally, for
major capital projects, debt will be borrowed up to the maximum allowable term of 20 years.
Council’s Debt Policy is included in City Budget supporting documents of this Annual Plan.
Page 22Annual Plan 2020-21 City Budget
2.4.3 The condition of City infrastructure assets
Each year the Asset Management Plans for the City’s $21 billion (replacement cost) infrastructure base are updated.
Undertaking condition assessments is a key component of asset management that underpins planning for the renewal
(i.e. replacement and refurbishment) of infrastructure. As illustrated by the below graph, the majority of the City’s
infrastructure is in a very healthy state, with 96.2% of the assets being in very good, good or fair condition. This is due
to many of the assets being relatively young with long useful lives, the infrastructure base being well maintained and
City of Gold Coast (Council) investing in infrastructure renewal when required.
The relevant standing committees annually review Asset Management Plans for relevant categories of infrastructure
with particular emphasis on the 3.8% of the City’s assets in poor (2.7%) and very poor (1.1%) condition and
infrastructure renewal requirements. The asset inspection & condition assessment programs that are in place to
determine the asset condition profile also monitor the assets in poor and very poor condition to maintain a level of
functionality and public safety until renewal or maintenance works are undertaken.
Figure 1: Condition of city infrastructure assets
Figure 2: Overall condition of City infrastructure assets
2.4.4 Adoption of Total Asset Management Plan
The outputs of each of the Asset Management Plans are summarised into the overarching Total Asset Management
Plan that informs the budget process and is integrated into the Long-Term Financial Forecast. Council adopts the
Total Asset Management Plan annually in conjunction with adoption of the budget.
• The 2020-21 to 2029-30 Total Asset Management Plan states the infrastructure renewal requirement (i.e. the
renewal investment required to maintain current levels of service for existing infrastructure assets) for 2020-21 is
$138.6 million. Renewal requirements rise to an annual average of $153.8 million (in today’s dollars) for the nine
future years, noting that an increase in the renewal requirement is expected as the City’s infrastructure base ages
and as more assets are identified as needing renewal through expanded condition assessment programs.
Page 23Annual Plan 2020-21 City Budget
Figure 3: Council’s asset renewal requirement
The City’s infrastructure base is sustainable in the long-term as the long-term financial forecast includes
funding for the infrastructure renewal requirements in the Total Asset Management Plan, as demonstrated by
the Asset Renewal Funding Ratio – refer sections 2.6 and 2.9.
2.4.5 The scope and standard of services
Council continues to commit the required funding on an annual basis to maintain our exceptionally high
standard of operational services across our growing city, including maintaining our roads, parks, beaches,
libraries, events, sporting and community venues. Significant world class sporting and associated
infrastructure has recently been provided as a direct result of the Commonwealth Games. Council is currently
undertaking or planning construction of new and refurbished major assets across the city that will provide new
and improved services, including:
• Art Gallery at HOTA
• Coomera Hub
• Pimpama Sports Hub
• Miami and Palm Beach Aquatic Centres
• Olympic standard skate park at Pizzey Park, Miami
• Light Rail stages 3 and 4
• Enhanced road program to manage congestion and protect our unique lifestyle. This involves:
o major road projects to increase the capacity of City-controlled roads
o intersection and ‘pinch point’ upgrades
o more efficient traffic operations with the use of data, technology and intelligent transport systems
o extending and connecting the walking and cycling network
The standards of service in terms of both infrastructure and other services continue to be of a high standard
and are projected to remain so into the future.
Page 24Annual Plan 2020-21 City Budget
2.5 2019 credit review
Queensland Treasury Corporation (QTC) conducted a credit review of Council in 2019 as part of the annual
debt application. The rating was maintained as ‘sound’ with a ‘positive’ outlook. A sound rating is defined as:
“The local government’s capacity to meet its financial commitments in the short, medium
and long-term is sound. This capacity may be more vulnerable to adverse changes in
general business and economic conditions including unforeseen financial shocks. It may
also be more vulnerable to adverse changes to its business and operational environment.
The capacity to manage core business risks is sound.”
A positive outlook is defined as:
“As a result of a foreseeable event or circumstance occurring, there is the potential for
enhancement in the local government’s capacity to meet its financial commitments (short
and/or long-term). Such enhancement may result in a change in its rating over a one to two
year period. However, it does not necessarily indicate that a rating change may be
forthcoming.”
This credit review confirms that the City’s finances are in good shape and have the flexibility to successfully
meet the challenges over the next decade.
2.6 Financial sustainability indicators
The following financial sustainability ratios are prescribed under the Local Government Regulation 2012:
Operating Surplus Ratio (net operating result divided by total operating revenue)
Net Financial Liabilities Ratio (total liabilities less current assets all divided by total operating revenue)
Asset Sustainability Ratio (capital expenditure on renewal of assets divided by depreciation expense).
The asset sustainability ratio uses accounting depreciation as a substitute measure for required capital
expenditure on infrastructure renewals. This limits the effectiveness of this ratio. In its report to Parliament
‘Results of audit: Local government entities 2013-14’ tabled on 5 May 2015, the Queensland Audit Office
(QAO) highlighted inadequacies of using accounting depreciation as a substitute measure for required capital
expenditure on infrastructure renewal and recommended that additional ratios be used to better understand
asset performance, being the:
Asset Renewal Funding Ratio (capital expenditure on the renewal of assets divided by required renewal
expenditure from the Asset Management Plan)
Asset Consumption Ratio (written down value of assets divided by the gross value of assets).
Council is also required to maintain three other financial ratios within limits agreed with Queensland Treasury
Corporation (QTC) as part of the lending terms and conditions. These ratios are:
Adjusted Operating Surplus (net operating result plus depreciation expense all divided by total operating revenue)
Leverage (total debt less cash investments all divided by total operating revenue)
Debt Service Coverage (net operating result plus interest expense plus depreciation all divided by interest expense
plus prior year current debt).
Given the issues associated with using accounting depreciation as a substitute measure for required capital
expenditure on infrastructure renewals, it was agreed with QTC to use an adjusted operating surplus ratio
which excludes depreciation from the calculation.
Page 25Annual Plan 2020-21 City Budget
2.7 Management of operating position
Table 5: Operating ratios
Target
Ratio 2020-21 2021-22 2022-23 2023-24 2024-25 2025-26 2026-27 2027-28 2028-29 2029-30
min max
Operating Surplus 0% 10% 0% 5% 5% 3% 1% 4% 4% 5% 6% 6%
Adjusted Operating Surplus 16% 19% 24% 25% 23% 21% 24% 24% 25% 24% 25%
The forecast Operating Surplus Ratio remains positive, indicating the Council is raising sufficient operating
revenue to cover operating expenses.
The Adjusted Operating Surplus Ratio, required by QTC, removes accounting depreciation from the
calculation and the target result. Council is forecasting to meet the benchmark set by QTC for the entire
forecasting period.
2.8 Management of debt
Table 6: Debt ratios
Target
Ratio 2020-21 2021-22 2022-23 2023-24 2024-25 2025-26 2026-27 2027-28 2028-29 2029-30
min max
Net Financial Liabilities 60% -1% 10% 19% 30% 27% 19% 11% 4% -4% -13%
Debt Service Coverage 2.2 2.7 3.3 3.4 3.2 2.9 3.6 3.9 4.1 4.2 4.4
Debt Service Ratio 0% 20% 8% 8% 8% 8% 8% 7% 7% 6% 6% 6%
The three ratios above seek to provide an indication as to whether debt is being responsibly managed.
Council sits comfortably within the required benchmarks for the forecast period.
Through prudent debt management, Council maintains the flexibility to utilise debt funding should it need to do
so in the future.
2.9 Management of infrastructure assets
Table 7: Asset management ratios
Target
Ratio 2020-21 2021-22 2022-23 2023-24 2024-25 2025-26 2026-27 2027-28 2028-29 2029-30
min max
Asset Sustainability 90% 45% 45% 47% 47% 47% 45% 43% 46% 47% 48%
Asset Renewal Funding 90% 100% 100% 100% 100% 100% 100% 100% 100% 100% 100% 100%
Target
Ratio 2018-19
min max
Asset Consumption
40% 80% 68%
(WDV/Gross Value)
The Asset Sustainability Ratio uses accounting depreciation as a proxy for required capital expenditure on
renewals (as opposed to capital renewal funding requirements determined through robust asset management
planning) with the results of this ratio indicating that infrastructure renewal funding is less than 50% of the
depreciation cost annually. The calculation method of this ratio does not provide an effective measure of
whether the investment in capital renewal is sufficient. This is particularly obvious with the City having a
relatively young asset base with the majority of infrastructure constructed since 1960, therefore, it is expected
that required capital expenditure on infrastructure renewal is currently substantially lower than accounting
depreciation.
Page 26Annual Plan 2020-21 City Budget
In comparison, the Asset Renewal Funding Ratio uses required capital expenditure on infrastructure renewals
(as stated in the Council adopted Total Asset Management Plan). The results of this ratio for the 10 year
period is 100% which demonstrates that the City’s infrastructure is sustainable in the long-term and that
Council is committed to funding required infrastructure renewal as determined through robust asset
management planning.
The Asset Consumption Ratio gives an indication of the ‘as new condition’ left in the assets. The results of this
ratio (as at 30 June 2019 - the last audited results available) reinforces the sustainability of the City’s
infrastructure assets with the result of 69% being towards the higher end of the target range. This aligns with
information provided previously on condition of the City’s infrastructure with the majority of the assets being in
a very healthy state.
Page 27P 1300 GOLDCOAST (1300 465 326)
W cityofgoldcoast.com.au
D_CityBudget Page 27 of 17You can also read