The JPMorgan Smaller Companies Investment Trust plc - July 2020

Page created by Nelson Sullivan
 
CONTINUE READING
The JPMorgan Smaller Companies Investment Trust plc - July 2020
The JPMorgan Smaller Companies Investment Trust plc
July 2020

Georgina Brittain, Portfolio Manager
Katen Patel, Portfolio Manager

FOR PROFESSIONAL CLIENTS | NOT FOR RETAIL USE OR DISTRIBUTION
The JPMorgan Smaller Companies Investment Trust plc - July 2020
Agenda

The case for UK mid & small caps

UK market outlook

Investment process

The JPMorgan Smaller Companies Investment Trust plc

2 | FOR PROFESSIONAL CLIENTS ONLY – NOT FOR RETAIL USE OR DISTRIBUTION
The JPMorgan Smaller Companies Investment Trust plc - July 2020
The case for UK mid & small caps
A compelling long-term asset class

3 | FOR PROFESSIONAL CLIENTS | NOT FOR RETAIL USE OR DISTRIBUTION
The JPMorgan Smaller Companies Investment Trust plc - July 2020
Long term performance of UK mid and small caps

Cumulative returns

1,800

1,600
                             S&P 500
                             FTSE 250 (ex IT)
1,400                        Russell 2000
                             MSCI Europe (ex UK) Small Cap
1,200                        MSCI Europe (ex UK)
                             MSCI AC Asia Pacific (ex Japan)
1,000                        MSCI Emerging Markets
                             FTSE All-Share
                             TOPIX
  800

  600

  400

  200

     0
         '95   '96    '97     '98     '99    '00     '01     '02     '03      '04   '05   '06   '07   '08   '09   '10   '11    '12    '13    '14    '15     '16    '17    '18   '19   '20

… long term returns amongst the best in the world

Source: J.P. Morgan Asset Management, Bloomberg. All series are rebased to 100 as at 31 December 1994 to 30 June 2020. All indices in GBP and include reinvested dividends.
Indices do not include fees or operating expenses and are not available for actual investment.

Past performance is not a reliable indicator of current and future results.

4 | FOR PROFESSIONAL CLIENTS ONLY – NOT FOR RETAIL USE OR DISTRIBUTION
The JPMorgan Smaller Companies Investment Trust plc - July 2020
Opportunities for extraordinary growth

                       Innovators or disruptors

                       Nimble business models

                       Rapidly growing new markets

                                                           OneSavings                                               Oxford
           Future                                                                                                                              Spirent
                                                             Bank                                                Instruments

Image source: Shutterstock

The securities above are shown for illustrative purposes only. Their inclusion should not be interpreted as a recommendation to buy or sell.

5 | FOR PROFESSIONAL CLIENTS ONLY – NOT FOR RETAIL USE OR DISTRIBUTION
The JPMorgan Smaller Companies Investment Trust plc - July 2020
Mergers & Acquisitions

 Sell-side                                                                                                                                    Buy-side

Percentage of index acquired                                                                   FTSE 100
                                                                                               FTSE 250
                                                                                                                                               Smaller companies    Larger companies
12%
                                                                                               Small Cap
                                                                                               FTSE 100 avg.
10%                                                                                                                                                                      Corporate
                                                                                                                                                Family ownership
                                                                                                                                                                         ownership
 8%

 6%
                                                                                                                                                Less efficient or   Fewer opportunities
 4%
                                                                                                                                                   sub-scale            for business
                                                                                                                                                  businesses           improvement

 2%

 0%
                                                                                                                                                 Limited overall       Regulatory and
         2001
                2002
                       2003
                              2004
                                     2005
                                            2006
                                                   2007
                                                          2008
                                                                 2009
                                                                        2010
                                                                               2011
                                                                                      2012
                                                                                             2013
                                                                                                    2014
                                                                                                           2015
                                                                                                                  2016
                                                                                                                         2017
                                                                                                                                2018
                                                                                                                                       2019      market impact      logistical challenges

Source: Liberum, Bloomberg, as at 31 December 2019.
Past performance is not a reliable indicator for current and future results.

6 | FOR PROFESSIONAL CLIENTS ONLY – NOT FOR RETAIL USE OR DISTRIBUTION
The JPMorgan Smaller Companies Investment Trust plc - July 2020
Opportunities for active managers in under-researched companies

 Rolling average analyst coverage by market cap
   25

   20
                                                                   FTSE 100   FTSE 250   FTSE Small Cap

   15

   10

    5

    0

   £m

 ... Average of 18 analysts covering each FTSE 100 company
 Average of 10 analysts covering each FTSE 250 company
 Average of 5 analysts covering each FTSE Small Cap company

Source: Liberum, Datastream. As at 7 January 2020.

7 | FOR PROFESSIONAL CLIENTS ONLY – NOT FOR RETAIL USE OR DISTRIBUTION
The JPMorgan Smaller Companies Investment Trust plc - July 2020
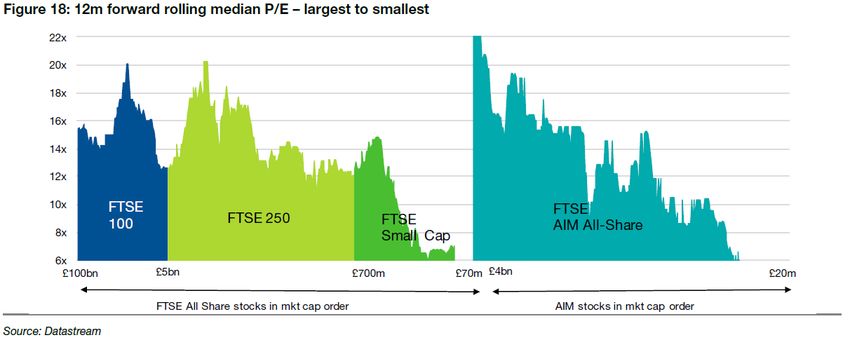
The UK Market Outlook

8 | FOR PROFESSIONAL CLIENTS | NOT FOR RETAIL USE OR DISTRIBUTION
Economic outlook: pandemic woes visible to all, outlook beyond unclear

 UK retail sales and consumer confidence                                                                       UK GDP growth forecasts for 2020 at historic lows
   8                                                                                                  10                           15%

                                                                                                                                   10%
   0                                                                                                  0

                                                                                                                 Real GDP, YoY %
                                                                                                                                    5%
  -8                                                                                                  -10
                                                                                                                                    0%
 -16                                                                                                  -20                          -5%
                                                                      UK Retail Sales % YOY
                                                                      (LHS)                                                                                                                     NIESR, -7.2%
 -24                                                                                                  -30                          -10%                                                          IMF, -10.2%
                                                                      GFK Consumer                                                                                                              OBR, -12.4%
                                                                      Confidence (RHS)                                             -15%
 -32                                                                                                  -40                              1900     1920     1940          1960       1980           2000          2020
    2005              2008              2011              2014              2017              2020
                                                                                                                                                       Outturn   IMF    OBR     NIESR

 UK Purchasing Managers Index                                                                                  Brent crude oil price ($/barrel)
  70
                                                                                                                100
  60
                                                                                                                  80
  50
                                                                                                                  60
  40
                                                                    Manufacturing PMI                             40
  30                                                                Services PMI
                                                                    Construction PMI                              20
  20
                                                                                                                           0
  10                                                                                                                        2015              2016       2017            2018            2019             2020
    2005               2008               2011               2014               2017              2020
Sources: top left chart: ONS, GfK, with data from January 2005 to June 2020; bottom left chart: Bloomberg, data from January 2005 to June 2020; top right chart: Panmure Gordon, data as of 14th July 2020; bottom right
chart: Bloomberg, data from January 2015 to July 2020. Opinions, estimates, forecasts, projections and statements of financial market trends are based on market conditions at the date of the publication, constitute our
judgment and are subject to change without notice. There can be no guarantee they will be met.
Past performance is not a reliable indicator of current and future performance.

9 | FOR PROFESSIONAL CLIENTS ONLY – NOT FOR RETAIL USE OR DISTRIBUTION
UK market valuation

                                                                                                         FTSE 100                       FTSE 250                       NSCI & AIM

      2021 P/E ratio (ex loss-makers)                                                                      13.4x                           13.3x                              11.7x

      2021 median earnings growth                                                                          12.1%                          19.0%                           19.6%

      2021 dividend yield (ex non-pay)                                                                      4.5%                           3.5%                               3.6%

      12m forward rolling median P/E – largest to smallest

     Source: Top table is from Peel Hunt as at 13 July 2020; bottom chart is from Liberum as at 10 September 2019, using Datastream. Opinions, estimates, forecasts,
     projections and statements of financial market trends are based on market conditions at the date of the publication, constitute our judgment and are subject to change
     without notice. There can be no guarantee they will be met.

10 | FOR PROFESSIONAL CLIENTS ONLY – NOT FOR RETAIL USE OR DISTRIBUTION
Global earnings expectations and equity valuations                                                                                                             GTM – UK |   48
           Consensus estimates for global earnings per share growth                                            Global forward price-to-earnings ratios
           % change year on year, earnings per share estimates                                                 x, multiple
             50                                                                                                 75x
                                                                                                                40x
             45                     2020          2021
                                                                                                                                              Current
             40                                                                                                 35x
             35                                                                                                                              Range since 1990
             30                                                                                                                              Average since 1990
             25                                                                                                 30x

             20
             15                                                                                                 25x
             10
Equities

               5
                                                                                                                20x
               0
              -5
            -10                                                                                                 15x
            -15
            -20                                                                                                 10x
            -25
            -30
                                                                                                                  5x
            -35
            -40
            -45                                                                                                   0x
                          US             Europe             UK              Japan              EM                             US             Europe             UK                Japan     EM
                                         ex-UK                                                                                               ex-UK
           Source: (Left) FTSE, IBES, MSCI, Refinitiv Datastream, Standard & Poor’s, TOPIX, J.P. Morgan Asset Management. MSCI indices are used for Europe ex-UK and
           EM. UK is FTSE All-Share, US is S&P 500 and Japan is TOPIX. Data used are in local currency, except for EM, which is in US dollars. (Right) IBES, MSCI, Refinitiv
           Datastream, Standard & Poor’s, J.P. Morgan Asset Management. MSCI indices are used for all regions/countries (due to data availability), except for the US, which is
           represented by the S&P 500. Past performance is not a reliable indicator of current and future results. Guide to the Markets - UK. Data as of 22 June 2020.
           Opinions, estimates, forecasts, projections and statements of financial market trends are based on market conditions at the date of the
           publication, constitute our judgment and are subject to change without notice. There can be no guarantee they will be met.
  11
Are UK equities still cheap?
UK market cheap on price to book and near the lows of the 1980s

 UK Market Price to Book (x)

                                                 UK Market Price To Book Value                   Max   Min    Median
  4.0

  3.5

  3.0

  2.5

  2.0

  1.5

  1.0

  0.5

  0.0
     1980                                       1990                                      2000               2010      2020

Source: Datastream, Morgan Stanley Research. Data from 1 January 1980 to 23 June 2020..

Past performance is not a reliable indicator of current and future results

12 | FOR PROFESSIONAL CLIENTS ONLY – NOT FOR RETAIL USE OR DISTRIBUTION
Investment Process

13 | FOR PROFESSIONAL CLIENTS | NOT FOR RETAIL USE OR DISTRIBUTION
What do we look for in a company?
For every stock we ask 3 questions:

                  IS IT A GOOD BUSINESS?
                  We consider the quality of the company through its profitability, sustainability of earnings and capital allocation discipline

                  IS IT ATTRACTIVELY VALUED?
                  We look at a company’s valuation to assess if its future prospects have been incorrectly estimated by the market

                  IS THE OUTLOOK IMPROVING?
                  Assessing the operational momentum of the business and how is this being reflected in expectations

                             THREE COMPLEMENTARY CONSIDERATIONS THAT HELP PREDICT STOCK RETURNS

14 | FOR PROFESSIONAL CLIENTS ONLY – NOT FOR RETAIL USE OR DISTRIBUTION
Stock specific considerations: A differentiated approach to fundamental analysis
Focused fundamental research on the drivers of share prices

                                                                            Stock specific considerations

              2,945                                                    820                                                  408                                    60
       Company newsflow                                           Fundamental                                     Company meetings                           IPOs and Placings
       (Comments written)                                           revisions                                                                                   evaluated

Source: J.P. Morgan Asset Management, Data for International Equity Group – European Behavioural Finance Team for calendar year 2019 for UK equities only.

15 | FOR PROFESSIONAL CLIENTS ONLY – NOT FOR RETAIL USE OR DISTRIBUTION
Investment philosophy

                                       We believe that attractively valued, high quality stocks with
                                               positive momentum outperform the market

                            VALUE                                                      QUALITY                                                     MOMENTUM
              Themes:                                                    Themes:                                                        Themes:
               -   Out of favour stocks with                               -   Market leaders                                              -   Structurally growing end
                   catalysts                                                                                                                   markets
                                                                           -   High return of capital
               -   Cyclical end market recovery                                                                                            -   Bolt-on acquisition strategy
                                                                           -   Disciplined capital allocation
               -   High cash generation                                                                                                    -   Disruptive technology
              The numbers:                                               The numbers:                                                   The numbers:

            FCF yield          Trust          Index                         ROIC            Trust          Index                      Momentum              Trust          Index

           Small Cap           6.5%           3.7%                       Small Cap          13.5%           9.3%                          Small Cap        -13.2%         -17.7%

Source: J.P. Morgan Asset Management, FactSet, as of 30 June 2020. Figures reported are weighted medians. Figures shown are Value = Free Cash Flow Yield, Quality = return on invested
capital, Momentum = 3 month historic earnings per share revisions. Small Cap is the JPMorgan Smaller Companies Investment Trust plc, whose index is Numis Smaller Companies plus AIM ex
IT.

16 | FOR PROFESSIONAL CLIENTS ONLY – NOT FOR RETAIL USE OR DISTRIBUTION
A deep understanding of the portfolio’s positioning
A powerful tool for visualizing exposures

                                                                          Red flags
          Liquidity
          analysis

                                                                          Style exposures

       Fundamental
       adjustments

                                                                          Top stock actives
      Alpha drivers

        ESG rating

17 | FOR PROFESSIONAL CLIENTS ONLY – NOT FOR RETAIL USE OR DISTRIBUTION
The investment process in action – Dunelm

 High quality business                                                                                Dunelm– Total Return

 • UK Market leader in fragmented homewares category                                                   GBP                 Share Price             Consensus EPS Estimate                 GBP

 • Improving product range and well-managed supply chain                                               14                                                                                  0.80

                                                                                                       13                                                                                  0.75
                                                                                                                                                                                           0.70
Attractively valued                                                                                    12
                                                                                                                                                                                           0.65
                                                                                                       11
 • Consistently cash generative and strong balance-sheet                                                                                                                                   0.60
                                                                                                       10                                                                                  0.55
 • Disciplined approach to shareholder returns
                                                                                                        9                                                                                  0.50
                                                                                                                                                                                           0.45
Promising outlook                                                                                       8
                                                                                                                                                                                           0.40
                                                                                                        7                                                                                  0.35
 • Market share gains driving multi-channel revenue growth
                                                                                                        6                                                                                0.30
 • Margin expansion potential                                                                          Jun 2019          Sep 2019            Dec 2019           Mar 2020           Jun 2020

Source: J.P. Morgan Asset Management, Bloomberg. Share Price 30 June 2019 – 30 June 2020. * The consensus EPS estimate is an arithmetic average of selected broker estimates for earnings per
share of the company for the year shown. The companies/securities above are shown for illustrative purposes only. Their inclusion should not be interpreted as a recommendation to buy or sell..

Past performance is not a reliable indicator of current and future results.

18 | FOR PROFESSIONAL CLIENTS ONLY – NOT FOR RETAIL USE OR DISTRIBUTION
The investment process in action – Computacenter

 High quality business                                                                               Computacenter – Total Return

 • Global IT infrastructure/services provider. High returns on                                         GBP                Share Price              Consensus EPS Estimate                GBP

     capital and track record of outperforming market estimates                                       20                                                                                  0.96

                                                                                                                                                                                          0.94
                                                                                                      18
Attractively valued                                                                                                                                                                       0.92
                                                                                                      16
 • Strong cash-flow generation, high dividend growth and net                                                                                                                              0.90

     cash balance sheet                                                                               14                                                                                  0.88

                                                                                                                                                                                          0.86
                                                                                                      12
Promising outlook                                                                                                                                                                         0.84
                                                                                                      10
                                                                                                                                                                                          0.82
 • Benefitting from a multi-year trend of digital investment by
                                                                                                       8                                                                                0.80
     enterprise and public-sector clients                                                             Jun 2019           Sep 2019           Dec 2019           Mar 2020           Jun 2020

Source: J.P. Morgan Asset Management, Bloomberg. Share Price 30 June 2019 – 30 June 2020. * The consensus EPS estimate is an arithmetic average of selected broker estimates for earnings per
share of the company for the year shown. The companies/securities above are shown for illustrative purposes only. Their inclusion should not be interpreted as a recommendation to buy or sell.

Past performance is not a reliable indicator of current and future results.

19 | FOR PROFESSIONAL CLIENTS ONLY – NOT FOR RETAIL USE OR DISTRIBUTION
The JPMorgan Smaller Companies Investment Trust plc

20 | FOR PROFESSIONAL CLIENTS | NOT FOR RETAIL USE OR DISTRIBUTION
Fund summary
JPM Smaller Companies Investment Trust plc

                                                                                                    Annualised performance to 30 June 2020
             Georgina Brittain                                  Katen Patel
             Portfolio Manager                                  Portfolio Manager
             Experience: 25 / 25                                Experience: 15 / 7                        15%                                                                 13.11
                                                                                                                                     Trust              Benchmark
                                                                                                                                                                                      9.31
                                                                                                          10%
                                                                                                                                        6.98               7.22

       Nimble and                    Portfolio size                     £223.4m                            5%
                                                                                                                                                                   2.11
        focused                      No. of stocks                      88                                          0.08
                                                                                                            0%

                                                                                                           -5%                                 -3.54
                                     Discount to NAV                    13.4%
      Inexpensive
                                     Historic dividend yield            1.6%                            -10%
                                                                                                                            -10.74
                                                                                                         -15%
                                     Strong long term outperformance                                                   1 year          3 years p.a.       5 years p.a.      10 years p.a.
     Performance                     1st in peer group over 3 years and over 1                     Excess
                                                                                                                        +12.12            +10.91             +5.00               +3.47
                                      year*                                                         return (%)

Source: J.P. Morgan Asset Management. As at 30 June 2020 unless otherwise stated. Experience: Industry/Firm as of 31 March 2020. NAV returns are net of fees, in GBP, with income reinvested.
Prospective dividend yield is indicative and based on mid market prices, and include the declared and net prospective dividends for the current financial year. Benchmark changed from the FTSE
Smaller Companies Index ex IT to the NUMIS Smaller Companies Index plus AIM ex IT on 1st January 2019. *Peer group of 26, Morningstar peer quartile ranking within EAA CE UK Small-Cap Equity
universe. Morningstar™ rankings/universe: © Morningstar. All Rights Reserved.
Past performance is not a reliable indicator for current and future results .

21 | FOR PROFESSIONAL CLIENTS ONLY – NOT FOR RETAIL USE OR DISTRIBUTION
Performance attribution
                                                                                                                                                                                  Stock: 11.68
JPM Smaller Companies Investment Trust plc                                                                                                         Attribution summary
                                                                                                                                                                                  Sector: -0.17
for 12 months ending 30 June 2020                                                                                                                  Benchmark
                                                                                                                                                                                  Numis Smaller Companies
                                                                                                                                                                                  plus AIM (ex IT) Index

Stock attribution
                                                  Relative           Stock           Impact                                                                   Relative            Stock           Impact
 Top 10 contributors                                                                                        Top 10 detractors
                                                 weight (%)        return (%)          (%)                                                                   weight (%)         return (%)          (%)

 Games Workshop Group                                 4.07             65.73           2.41                  Vistry Group                                         1.33             -25.28          -0.68

 Avon Rubber                                          2.07            136.87           1.89                  OneSavings Bank                                      2.90             -25.66          -0.64

 Team17 Group                                         2.25             88.62           1.57                  Dart Group                                           1.84              -1.24          -0.63

 Judges Scientific                                    3.01             52.52           1.52                  ITM Power                                         Not Held            686.12          -0.52

 Future                                               3.38             31.78           1.41                  Centamin                                            -0.63              9.85           -0.50

 Dunelm Group                                         2.86             37.76           1.13                  Ferrexpo                                            -0.15             -48.98          -0.48

 Spirent Communications                               1.80             61.26           0.98                  Go-Ahead Group                                       0.28             -59.69          -0.45

 Liontrust Asset Mgmt                                 1.42             88.25           0.95                  GlobalData                                        Not Held            89.69           -0.45

 Codemasters Group Holdings                           1.66             50.44           0.83                  TBC Bank Group                                       0.82             -43.70          -0.43

 Ei Group                                             0.75             43.34           0.67                  Rank Group                                           0.31             -36.21          -0.35

Source: Factset. Data is gross of fees in GBP. Attribution results are for indicative purposes only. The portfolio is actively managed. Holdings, sector weights, allocations and leverage, as applicable, are
subject to change at the discretion of the Investment Manager without notice. Past performance is not a reliable indicator of current and future results.

22 | FOR PROFESSIONAL CLIENTS ONLY – NOT FOR RETAIL USE OR DISTRIBUTION
Portfolio positions
                                                                                                                                                                    Numis Smaller Companies plus
JPM Smaller Companies Investment Trust plc                                                                                      Benchmark                           AIM (excluding Investment
as of 30 June 2020                                                                                                                                                  Companies) Index

Top 10 overweight positions

 Stock                                                                                  Portfolio weight (%)                 Benchmark weight (%)                      Relative position (%)

Games Workshop Group                                                                              4.8                                    0.0                                     4.8

Dunelm Group                                                                                      4.5                                    0.0                                     4.5

Future                                                                                            4.6                                    0.7                                     3.9

Team17 Group                                                                                      3.6                                    0.4                                     3.2

Judges Scientific                                                                                 3.3                                    0.2                                     3.1

Computacenter                                                                                     3.1                                    0.0                                     3.1

Softcat                                                                                           2.5                                    0.0                                     2.5

OneSavings Bank                                                                                   2.2                                    0.0                                     2.2

Pets At Home                                                                                      2.8                                    0.7                                     2.2

Avon Rubber                                                                                       2.7                                    0.5                                     2.1

Total                                                                                             34.1                                   2.5                                     31.6

Source: J.P. Morgan Asset Management, Factset. The investment trust is actively managed. Holdings, sector weights, allocations and leverage, as applicable, are subject to change at the discretion of
the Investment Manager without notice.

23 | FOR PROFESSIONAL CLIENTS ONLY – NOT FOR RETAIL USE OR DISTRIBUTION
Portfolio positions
                                                                                                                                                                    Numis Smaller Companies plus
JPM Smaller Companies Investment Trust plc                                                                                      Benchmark                           AIM (excluding Investment
as of 31 December 2019                                                                                                                                              Companies) Index

Top 10 overweight positions

 Stock                                                                                  Portfolio weight (%)                 Benchmark weight (%)                      Relative position (%)

Games Workshop Group                                                                              4.5                                    0.8                                     3.7

OneSavings Bank                                                                                   3.7                                    0.4                                     3.3

Future Plc                                                                                        3.7                                    0.5                                     3.2

Judges Scientific                                                                                 3.2                                    0.1                                     3.1

4Imprint Group                                                                                    3.4                                    0.4                                     3.0

Forterra Plc                                                                                      2.8                                    0.3                                     2.5

Dunelm Group                                                                                      3.5                                    0.9                                     2.5

Dart Group                                                                                        3.5                                    1.0                                     2.5

MJ Gleeson                                                                                        2.6                                    0.2                                     2.4

Marshalls                                                                                         3.1                                    0.7                                     2.3

Total                                                                                             34.0                                   5.3                                     28.5

Source: J.P. Morgan Asset Management, Factset. The investment trust is actively managed. Holdings, sector weights, allocations and leverage, as applicable, are subject to change at the discretion of
the Investment Manager without notice.

24 | FOR PROFESSIONAL CLIENTS ONLY – NOT FOR RETAIL USE OR DISTRIBUTION
Portfolio positions
                                                                                                                                                                              Numis Smaller Companies
JPMorgan Smaller Companies Investment Trust plc                                                                                                                               plus AIM (excluding
                                                                                                                                               Benchmark
as of 30 June 2020                                                                                                                                                            Investment Companies)
                                                                                                                                                                              Index

Active and absolute sector positions

  Relative to benchmark (%)

      12          11.2

      10

       8
                                     6.2
       6

       4                                                3.3               3.0                2.8
       2

       0

       -2
                                                                                                               -1.9               -2.1              -2.3               -2.4
       -4                                                                                                                                                                                 -3.1
                 Leisure           General             H'h'             Software            Media        Pharmaceuticals &        Oil             Support          Construction          Mining
                 Goods             Retailers          Goods                &                               Biotechnology           &              Services              &
                                                        &                Comp.                                                    Gas                               Materials
                                                      Home               Serv.                                                 Producers
                                                     Construct.

Portfolio
Weight (%)
                  13.6               10.1               5.2               10.8               7.8               2.5                1.9               4.4                2.4                2.0

Source: J.P. Morgan Asset Management, Factset. The investment trust is actively managed. Holdings, sector weights, allocations and leverage, as applicable, are subject to change at the discretion of
the Investment Manager without notice.

25 | FOR PROFESSIONAL CLIENTS ONLY – NOT FOR RETAIL USE OR DISTRIBUTION
COVID-19: Update

       The Smaller Companies investment trust is focused on bottom up stock selection and that has not changed as a result of the
        COVID-19 crisis.

       Paying particular attention to firms balance sheets and cash flow, but this is not a deviation from how we pick stocks.
             Picking the long term winners is our area of expertise, not timing the market.

       Assessing relative upside on a multi-year approach to determine new buys and sells for the portfolio

       Revenue reserves:
            Smaller Companies revenue reserve as at 31st January 2020 was £ 6,004,000 which provides approximate cover of 1.4x
             the 2019 dividend rate.

Source: J.P. Morgan Asset Management as of 13 May 2020. Opinions, estimates, forecasts, projections and statements of financial market trends are based on market conditions at the date of the
publication, constitute our judgment and are subject to change without notice. There can be no guarantee they will be met.

26 | FOR PROFESSIONAL CLIENTS ONLY – NOT FOR RETAIL USE OR DISTRIBUTION
COVID-19 – Portfolio changes

   Buys
    –   Adding to existing high conviction holdings – Media, Construction, Retail, Technology
    –   New opportunities created by share price volatility – Industrials, Leisure, Technology

   Sells
    –   Position reduction due to relative valuation – Leisure, Construction, Real estate
    –   Sold due to preferred opportunities elsewhere – Transport, Financials

   Gearing
    –   Reduced to provide firepower for opportunities (placings/share price volatility)
           Already starting to be utilized
           Highly selective participation in placings to date

Source: J.P. Morgan Asset Management as of 30 June 2020. The portfolio is actively managed. Holdings, sector weights, allocations and leverage, as applicable, are subject to change at the discretion
of the investment manager without notice.

27 | FOR PROFESSIONAL CLIENTS ONLY – NOT FOR RETAIL USE OR DISTRIBUTION
Long term investment performance

Cumulative returns 30 June 2020 (%)

 450%

 400%                             JPMorgan Smaller Companies Investment Trust NAV

 350%                             Benchmark

 300%

 250%

 200%
                                                                                                                                                                                  +107%
 150%

 100%                                                                                                                          Share price discount to NAV is 13.4%
   50%
     Oct 2009          Oct 2010         Oct 2011          Oct 2012         Oct 2013         Oct 2014         Oct 2015          Oct 2016         Oct 2017         Oct 2018          Oct 2019

...long term alpha generation by current portfolio managers

Source: Bloomberg, J.P. Morgan Asset Management. Data from 31 October 2009 – 30 June 2020. Benchmark changed from the FTSE Smaller Companies Index ex IT to the NUMIS Smaller
Companies Index plus AIM ex IT on 1 January 2019. NAV returns are net of fees, in GBP, with income reinvested. All indices in sterling and include reinvested dividends. Indices do not include fees or
operating expenses and are not available for actual investment. Returns are cumulative.
Past performance is not a reliable indicator of current and future performance.

28 | FOR PROFESSIONAL CLIENTS ONLY – NOT FOR RETAIL USE OR DISTRIBUTION
Summary

                    Opportunities for extraordinary growth by small and mid cap companies

                    Robust, disciplined process. Established and refined over three decades

                    Strong long term trust performance vs. benchmark and peers

Past performance is not a reliable indicator of current and future performance.

29 | FOR PROFESSIONAL CLIENTS ONLY – NOT FOR RETAIL USE OR DISTRIBUTION
Appendix

30 | FOR PROFESSIONAL CLIENTS | NOT FOR RETAIL USE OR DISTRIBUTION
Performance
JPMorgan Smaller Companies Investment Trust plc as of 30 June 2020

Annualised performance, net of fees (%)
                                                                                                                                                    One                       Three                       Five
                                                                                        Three months                     YTD
                                                                                                                                                    year                      years                      years

 JPMorgan Smaller Comp. NAV (debt at fair value)                                              22.00                     -20.14                      0.08                       6.98                       7.22

 JPMorgan Smaller Comp.share price                                                            21.47                     -30.16                      2.13                      10.23                       8.29

 NUMIS Smaller Companies Index plus AIM ex IT *                                               19.17                     -19.78                     -10.74                      -3.54                      2.11

 Excess return (NAV)                                                                         +2.37                       -0.45                     +12.12                    +10.91                      +5.00

Calendar year performance, net of fees (%)

                                                                                               2015                      2016                       2017                       2018                       2019

 JPMorgan Smaller Comp. NAV (debt at fair value)                                              20.37                      -0.95                      31.62                     -13.64                     49.21
 JPMorgan Smaller Comp. share price                                                           26.03                      -6.69                      36.41                      -9.04                     67.53
 NUMIS Smaller Companies Index plus AIM ex IT *                                               12.99                      12.54                      15.61                     -13.80                     22.14
 Excess return (NAV)                                                                          +6.53                      -11.98                    +13.85                      +0.19                    +22.14

Source: J.P. Morgan Asset Management/Morningstar. Net asset value performance data has been calculated on a NAV to NAV basis, including ongoing charges and any applicable fees, with any income reinvested, in
GBP. NAV is the cum income NAV with debt at fair value, diluted for treasury and/or subscription shares if applicable, with any income reinvested. Share price performance figures are calculated on a mid market basis in
GBP with income reinvested on the ex-dividend date. The performance of the company's portfolio, or NAV performance, is not the same as share price performance and shareholders may not realise returns which are
the same as NAV performance. Indices do not include fees or operating expenses and you cannot invest in them. Geometric excess returns. Periods over one year are annualised. *Benchmark changed from the FTSE
Smaller Companies Index ex IT to the NUMIS Smaller Companies Index plus AIM ex IT on 1st January 2019. Past         performance is not a reliable indicator for current or future results.

31 | FOR PROFESSIONAL CLIENTS ONLY – NOT FOR RETAIL USE OR DISTRIBUTION
Premium/Discount to NAV

JPM Smaller Companies Investment Trust plc

    0

   -5

  -10

  -15

  -20

  -25

  -30

  -35
    Dec '16     Mar '17     Jun '17     Sep '17     Dec '17      Mar '18   Jun '18   Sep '18   Dec '18   Mar '19   Jun '19   Sep '19   Dec '19   Mar '20   Jun '20

Source: Bloomberg. Data from 31 December 2016 to 30 June 2020.
Past performance is not a reliable indicator for current and future results.

32 | FOR PROFESSIONAL CLIENTS ONLY – NOT FOR RETAIL USE OR DISTRIBUTION
5 years' historic gearing level vs. benchmark

JPM Smaller Companies Investment Trust plc
Gearing Level                                                                                                                                                                                          Index
    20%                                                                                                                                                                                                 6,000
                                     Month end gearing level - LHS

                                     Old benchmark level - RHS
    16%
                                     New benchmark level - RHS

                                                                                                                                                                                                        5,000
    12%

     8%
                                                                                                                                                                                                        4,000

     4%

     0%                                                                                                                                                                                                 3,000
       May 15        Sep 15      Jan 16      May 16      Sep 16      Jan 17      May 17      Sep 17      Jan 18      May 18      Sep 18      Jan 19      May 19      Sep 19      Jan 20      May 20

Source: Bloomberg, J.P. Morgan Asset Management
As at 30 June 2020 (weightings exclude cash/cash equivalents). Investment trusts may utilise gearing which will exaggerate market movements both down and up which could mean sudden and large falls in value. For
further details, please refer to the trust’s annual report and accounts. Gearing is the ability to borrow money to invest that money on behalf of the shareholders.

Past performance is not a reliable indicator for current and future returns.

33 | FOR PROFESSIONAL CLIENTS ONLY – NOT FOR RETAIL USE OR DISTRIBUTION
Benefits of mid & small cap strategy in an actively managed closed ended structure

 Benefits                                                                                                Reserves provide the ability to smoothing income return

                                                                                                          Pence per share
                                                                                                           7
      Liquid access to a less
                                                         No inflows/ outflows                                                  Special dividend
         liquid asset class
                                                                                                           6                   Dividend
                                                                                                                               Earnings per share
                                                                                                           5                   Net revenue reserves per share (RHS)
                                                    Reserves provide the ability
     Active use of gearing to
                                                    to smoothing income return
         enhance returns                                                                                   4
                                                         for shareholders

                                                                                                           3

      Independent Board of
                                                           Higher disclosure                               2
   Directors provide oversight

                                                                                                           1

       Share buybacks at a                          Opportunity for investors to
                                                                                                           0
    discount to NAV accretive                       buy shares at a discount to
         to shareholders                                       NAV

                  …with the opportunity for active managers to add value in under-researched companies
Source: J.P. Morgan Asset Management. All figures based on the current trust total shares, after the 5 for 1 rights issue which lapsed in 2017. Data as at 31 December 2019.
Past performance is not a reliable indicator for current and future results.

34 | FOR PROFESSIONAL CLIENTS ONLY – NOT FOR RETAIL USE OR DISTRIBUTION
J.P. Morgan International Equity Group – Drawing on resources around the world
                                                                                                       Malcolm Smith
                                                                                          Head of the International Equity Group

                                      Quantitative Research*                                                                                               Fundamental Research
                                10 years average industry experience                                                                                 19 years average industry experience

                                                 Nick Horne                                                                                                     Mark Ferguson
                                Head of Global Structured Equity Group                                                                              Global Head of Equity Research
                                                                                                                                    Christian Pecher                                David Small
                                            Philippa Clough                                                                      Asia Head of Research                     North America Head of Research
                                 Head of Quantitative Research - London                                                        14 Asia Research Analysts                 25 North America Research Analysts
                                   7 Quantitative Research Analysts
                                                                                                                                  Maciej Wasilewicz                               Shumin Huang & Giovanni Carriere
                                               Won Choi                                                                        Europe Head of Research                           Emerging Markets Heads of Research
                               Head of Quantitative Research – New York                                                      13 Europe Research Analysts                        29 Emerging Market Research Analysts
                                 7 Quantitative Research Analysts ^^^
                                                                                                                                                              10 Product Analysts*

                                                                                                 Portfolio Management
                                                                                           19 years average industry experience

                                                             56 Portfolio Managers**, supported by a team of 12 Associate Portfolio Managers

                                                                               Managing Global, International^, Europe & UK Equity Portfolios

               Investment Specialists                                                              Implementation*                                                           Trading & Data Scientists***
         19 years average industry experience                                            19 years average industry experience                                            21 years average industry experience^^

                   Frances Gerhold                                                                      James Ford                                                                        Kristian West
    11 Investment Specialists in Asia, Europe & the US                                          10 Implementation Specialists                                                           31 Equity Traders
                                                                                                                                                                                  7 Trading Analytics & Strategy
               Supported by a team of 14
                                                                                                                                                                                        7 Data Scientists

 Data as at 30 June 2020. * Some of the team members have additional PM responsibilities. Quantitative research team for New York includes VP & above **Some of the team members have additional
 Implementation, Quantitative Research or Analyst roles. ^ International is Global ex-US. ^^ex-data scientists. *** Trading & Data scientists details are as of March 31, 2020. ^^^ VP & above. Note this
 illustrates the resources available and does not necessarily reflect reporting lines
35 | FOR PROFESSIONAL CLIENTS ONLY – NOT FOR RETAIL USE OR DISTRIBUTION
European Small and Mid Cap team

                        Continental Europe                                                           UK Small & Mid Cap

                      Francesco Conte                                           Guy Anderson                              Georgina Brittain
                       Industry: 31 yrs                                         Industry: 18 yrs                         Industry: 25 yrs
                       Firm: 21 yrs                                             Firm: 8 yrs                              Firm: 25 yrs

                      Ed Greaves                                                Katen Patel                               Ed Hezlet
                       Industry: 13 yrs                                         Industry: 15 yrs                         Industry: 5 yrs
                       Firm: 9 yrs                                              Firm: 7 yrs                              Firm: 5 yrs

                      Jack Featherby                                            Anthony Lynch                             Manasij Hajra
                       Industry: 6 yrs                                                                                    Industry:
Portfolio implementation
Dedicated team ensures efficient portfolio implementation, in collaboration with our award-winning trading desk

         Implementation team                                                                                     Trading team

      Guideline management
      Corporate actions
      Account on/off boarding
      Cashflow monitoring
      Prime broker interactions
      Portfolio reporting

Source: J.P. Morgan Asset Management. Data as at 31 December 2019. 1Markets Choice Awards: a peer-based survey of exchanges, sell-side desks, institutional buy-side investors, hedge funds and
technology providers. 2Financial News Trading & Technology Awards

Past performance is not a reliable indicator of current and future results.

37 | FOR PROFESSIONAL CLIENTS ONLY – NOT FOR RETAIL USE OR DISTRIBUTION
Integrating ESG into our investment approach

 Quantitative ranking                                                                     Fundamental analysis
                                                                  Fundamental
                                                                   analysis to
     Third party data sources integrated                                                 Bottom-up ESG analysis
                                                                   understand
      into proprietary methodology                                   impact                Materiality focus
                                                                                           Data can be incomplete
     Improvement / deterioration as
      well as absolute score                                                               Understand transmission
                                                                                            mechanisms
     In-house ‘red flags’ model
      – Corporate governance                                                              Stewardship
      – Forensic accounting                                                                Informs scoring
                                                                                           Partnership with specialist ESG team
      – Financial distress
                                                                                           What is the impact on shareholder
                                                                   Challenge                value
                                                                     data

                            ...systematic and explicit consideration of ESG factors throughout the investment process

ESG - Environmental, Social, & Governance.

38 | FOR PROFESSIONAL CLIENTS ONLY – NOT FOR RETAIL USE OR DISTRIBUTION
The UK Edge

Image source: J.P. Morgan Asset Management.

39 | FOR PROFESSIONAL CLIENTS ONLY – NOT FOR RETAIL USE OR DISTRIBUTION
Biography

                        Georgina Brittain, Managing Director, is a portfolio manager for small and mid cap strategies within the J.P. Morgan Asset
                        Management International Equity Group – Behavioural Finance Team, based in London. Georgina is a fund manager for the JPM
                        UK Smaller Companies Fund, the JPMorgan Smaller Companies Investment Trust and co-manager for the JPMorgan Mid Cap
                        Investment Trust. She is also a co-manager for our range of European small cap funds. An employee since 1995, Georgina was
                        previously an analyst in the UK research department. Georgina obtained an M.A. in Classics from Oxford University, and earned
                        a Diploma in Law from City University, London. She is a qualified barrister.​

                        Katen Patel, Executive Director, is a portfolio manager for small and mid cap strategies within the J.P. Morgan Asset
                        Management International Equity Group – Behavioural Finance Team. He is the co-manager of the JPM UK Smaller Companies
                        Fund, the JPM UK Equity Income Fund, the JPMorgan Smaller Companies Investment Trust and the JPMorgan Mid Cap
                        Investment Trust. An employee since April 2013, he previously worked at HSBC Bank Plc in a European equity sales role. He
                        obtained a B.Sc. in Management from the London School of Economics. Katen is a CFA charterholder.​

     … expertise, experience and the backing of a large group

40 | FOR PROFESSIONAL CLIENTS ONLY – NOT FOR RETAIL USE OR DISTRIBUTION
Investment objective and risk profile
JPMorgan Smaller Companies Investment Trust plc (the Company) as at September 2019

    Investment objective
    Aims to provide capital growth from UK listed smaller companies. The Company aims to provide capital appreciation for shareholders from a
    diversified portfolio of UK listed small companies, emphasising capital rather than income growth. Returns are principally determined by the
    performance of the investments made by The Company, although The Company has the ability to use borrowing to gear the portfolio within the
    range of 10% net cash to 15% geared in normal market conditions. Gearing may magnify gains or losses experienced by The Company.

Key Risks

    External factors may cause an entire asset class to decline in value. Prices and values of all shares or all bonds could decline at the same time,
     or fluctuate in response to the performance of individual companies and general market conditions.

    This Company may utilise gearing (borrowing) which will exaggerate market movements both up and down.

    This Company invests in smaller companies which may increase its risk profile.

    The share price may trade at a discount to the Net Asset Value of the Company.

    The single market in which the Company primarily invests, in this case the UK, may be subject to particular political and economic risks and, as
     a result, the Company may be more volatile than more broadly diversified Company's.

    Companies listed on AIM tend to be smaller and early stage companies and may carry greater risks than an investment in a Company with a full
     listing on the London Stock Exchange.

Please refer to the Investor Disclosure Document, latest annual report, and Key Information Document (KID) for more information relating to the Company.

41 | FOR PROFESSIONAL CLIENTS ONLY – NOT FOR RETAIL USE OR DISTRIBUTION
Important information

For Professional Clients only – not for Retail use or distribution.

This is a marketing communication and as such the views contained herein do not form part of an offer, nor are they to be taken as advice or a recommendation, to
buy or sell any investment or interest thereto. Reliance upon information in this material is at the sole discretion of the reader. Any research in this document has
been obtained and may have been acted upon by J.P. Morgan Asset Management for its own purpose. The results of such research are being made available as
additional information and do not necessarily reflect the views of J.P. Morgan Asset Management. Any forecasts, figures, opinions, statements of financial market
trends or investment techniques and strategies expressed are unless otherwise stated, J.P. Morgan Asset Management’s own at the date of this document. They
are considered to be reliable at the time of writing, may not necessarily be all inclusive and are not guaranteed as to accuracy. They may be subject to change
without reference or notification to you. It should be noted that the value of investments and the income from them may fluctuate in accordance with market
conditions and taxation agreements and investors may not get back the full amount invested. Changes in exchange rates may have an adverse effect on the value,
price or income of the products or underlying overseas investments. Past performance and yield are not reliable indicators of current and future results. There is no
guarantee that any forecast made will come to pass. Furthermore, whilst it is the intention to achieve the investment objective of the investment products, there can
be no assurance that those objectives will be met. J.P. Morgan Asset Management is the brand name for the asset management business of JPMorgan Chase &
Co. and its affiliates worldwide. To the extent permitted by applicable law, we may record telephone calls and monitor electronic communications to comply with
our legal and regulatory obligations and internal policies. Personal data will be collected, stored and processed by J.P. Morgan Asset Management in accordance
with our EMEA Privacy Policy www.jpmorgan.com/emea-privacy-policy.

Investment is subject to documentation. The Investor Disclosure Document, Key Features and Terms and Conditions and Key Information Document can be
obtained free of charge from JPMorgan Funds Limited or www.jpmam.co.uk/investmenttrust. This communication is issued by JPMorgan Asset Management (UK)
Limited, which is authorised and regulated in the UK by the Financial Conduct Authority. Registered in England No: 01161446. Registered address: 25 Bank
Street, Canary Wharf, London E14 5JP.

Material ID: 0903c02a82895403

42 | FOR PROFESSIONAL CLIENTS ONLY – NOT FOR RETAIL USE OR DISTRIBUTION
You can also read