PPF Telecom Group 1H2020 results - 26 August 2020

Page created by Everett Montgomery
 
CONTINUE READING
PPF Telecom Group 1H2020 results - 26 August 2020
26 August 2020

PPF Telecom Group
1H2020 results
                    1
PPF Telecom Group 1H2020 results - 26 August 2020
Disclaimer
IMPORTANT: You must read the following before continuing. The following applies to this document, the oral presentation of the information in this document by PPF Telecom Group B.V. (formerly known as PPF Arena 1
B.V.) (the Company) or any person on behalf of the Company, and any question-and-answer session that follows the oral presentation (collectively, the Information). In accessing the Information, you agree to be bound by
the following terms and conditions.
THIS PRESENTATION IS NOT AN OFFER OR SOLICITATION OF AN OFFER TO BUY OR SELL SECURITIES. IT IS SOLELY FOR USE AT AN INVESTOR PRESENTATION AND IS PROVIDED FOR INFORMATION
PURPOSES ONLY. THIS PRESENTATION DOES NOT CONTAIN ALL OF THE INFORMATION THAT IS MATERIAL TO AN INVESTOR.

The Information may not be reproduced, redistributed, published or passed on to any other person, directly or indirectly, in whole or in part, for any purpose. The distribution of this presentation and other information in
connection with the issue of any securities by the Company in certain jurisdictions may be restricted by law and persons into whose possession this presentation or any document or other information referred to herein
comes should inform themselves about and observe any such restrictions. Any failure to comply with these restrictions may constitute a violation of the securities laws of any such jurisdiction. This presentation and any
materials distributed in connection with this presentation are not directed to, or intended for distribution to or use by, any person or entity that is a citizen or resident or located in any locality, state, country or other jurisdiction
where such distribution, publication, availability or use would be contrary to law or regulation or which would require any registration or licensing within such jurisdiction. The Company does not accept any liability to any
person in relation to the distribution or possession of this presentation in or from any jurisdiction.
The Information is not an offer of securities for sale in the United States and is not for publication or distribution to US persons (within the meaning of Regulation S under the United States Securities Act of 1933, as amended
(the Securities Act)). The securities issued by the Company have not been and will not be registered under the Securities Act or with any securities regulatory authority of any state or other jurisdiction of the United States
and may not be offered, sold or delivered within the United States or to U.S. persons except pursuant to an exemption from, or in a transaction not subject to, the registration requirements of the Securities Act and applicable
state securities laws. Accordingly, any securities of the Company will be offered, sold or delivered outside the United States to persons who are not US persons (as defined in Regulation S under the Securities Act
(Regulation S)) in offshore transactions in reliance on Regulation S and in accordance with applicable laws. Any failure to comply with the foregoing restrictions may constitute a violation of US securities laws.
The Information is being distributed to, and is directed only at (i) persons who are outside the United Kingdom; or (ii) persons who are investment professionals within the meaning of Article 19(5) of the Financial Services and
Markets Act 2000 (Financial Promotion) Order 2005 (the Order); (iii) high net worth entities, and other persons to whom it may lawfully be communicated, falling within Article 49(2)(a) to (d) of the Order; or (iv) any other
persons to whom it may otherwise lawfully be communicated or caused to be communicated (all such persons in (i) to (iv) together being referred to as Relevant Persons). Any security, investment or investment activity to
which this presentation relates will only be available to and will only be engaged with, Relevant Persons. Any person who is not a Relevant Person should not act or rely on this presentation or any of its contents.
This Information does not constitute a recommendation or investment advice regarding any securities of the Company. The Information does not constitute an offer or an agreement, or a solicitation of an offer or an
agreement, to enter into any transaction (including for the provision of any services). No assurance is given that any such transaction can or will be arranged or agreed. Any decision to purchase any securities of the
Company should be made solely on the basis of the final terms and conditions of the securities and the information to be contained in the base listing particulars or equivalent disclosure document produced in connection
with the offering of such securities. The base listing particulars may contain information different from the Information. Before entering into any transaction, you should consider the suitability of the transaction to your
particular circumstances and independently review (with your professional advisers as necessary) the specific financial risks as well as the legal, regulatory, credit, tax and accounting consequences. This document does not
disclose all the risks and other significant issues related to an investment in any securities/transaction. Prior to transacting, potential investors should ensure that they fully understand the terms of any securities/transaction
and any applicable risks.
No representation, warranty or undertaking, express or implied, is made as to, and no reliance should be placed on, the fairness, accuracy, completeness or correctness of the Information or the opinions contained therein
(and whether any information has been omitted from the presentation). The Information has not been independently verified and will not be updated. The Information, including but not limited to forward-looking statements,
applies only as of the date of this document and is not intended to give any assurances as to future results. To the extent permitted by law, the Company and each of its respective directors, officers, employees, affiliates,
advisers and representatives disclaim all liability whatsoever (in negligence or otherwise) for any loss, however arising, directly or indirectly, from any use of this presentation or its contents or otherwise arising in connection
with this presentation. The Company expressly disclaims any obligation or undertaking to disseminate any updates or revisions to the Information, including any financial data or forward-looking statements, and will not
publicly release any revisions it may make to the Information that may result from any change in the Company’s expectations, any change in events, conditions or circumstances on which these forward-looking statements
are based, or other events or circumstances arising after the date of this document. Market data used in the Information not attributed to a specific source are estimates of the Company and have not been independently
verified.
The Information may contain various forward-looking statements that relate to, among other things, events and trends that are subject to risks and uncertainties that could cause the actual business activities, results and
financial position of the of the Company and its subsidiaries (collectively, the “Group”) to differ materially from the information presented herein. These statements may include, without limitation, any statements preceded by,
followed by or including words such as “estimate”, “project”, “intend”, “anticipate”, “believe”, “expect”, “should” and similar expressions, as they relate to the Group and its management, are intended to identify such forward-
looking statements. Investors are cautioned not to place undue reliance on these forward-looking statements, which speak only as of the date of this presentation. The Issuer does not undertake any obligations publicly to
release the result of any revisions to these forward-looking statements to reflect the events or circumstances after the date of this presentation or to reflect the occurrence of unanticipated events.
When relying on forward-looking statements, investors should carefully consider the foregoing risks and uncertainties and other events, especially in light of the political, economic, social and legal environment in which the
Group operates. Factors that might affect such forward-looking statements include, among other things, overall business and government regulatory conditions, changes in tariff and tax requirements (including tax rate
changes, new tax laws and revised tax law interpretations), interest rate fluctuations and other capital market conditions, including foreign currency exchange rate fluctuations, economic and political conditions in the Czech
Republic, Slovakia, Hungary, Bulgaria, Serbia, Montenegro and other markets, and the timing, impact and other uncertainties of future actions. The Company does not make any representation, warranty or prediction that
the factors anticipated by such forward-looking statements will be present, and such forward-looking statements represent, in each case, only one of many possible scenarios and should not be viewed as the most likely or
standard scenario.

                                                                                                                                                                                                                                           2
PPF Telecom Group 1H2020 results - 26 August 2020
Meet the presenters

       Jan Tomaník                                                            Lukáš Kubesa
       Investment manager of PPF Group                                        Financial Manager of PPF Telecom Group
       9 years experience in telco M&A                                        4 years experience in telco, CETIN and PPF
                                                                              11 years in finance
       •   Acquisition of Telenor CEE                                         •   Financial Manager of PPF Telecom Group (since 2018)
       •   Structural separation of O2 and CETIN and subsequent refinancing   •   Head of Financial reporting of CETIN (2016-2018)
       •   Acquisition of Telefónica O2 CR                                    •   Senior financial reporting specialist at Raiffeisenbank CZ (2012-2016)
       •   Czech 4th mobile operator project                                  •   Senior Audit Associate at PwC (2009-2012)

                                                                                                                                                           3
PPF Telecom Group 1H2020 results - 26 August 2020
Introduction to PPF Group and PPF Telecom Group

                             PPF Group Overview   26 August 2020   4
PPF Group is an international investment group
founded in 1991 in Czech Republic
        37,9 billion
        48.6  billionEUR
                      EUR                                  7,38.8
                                                                billion  EUREUR
                                                                      billion   0,6 billion
                                                                                         0.9EURbillion EUR                                                                       160 22
                                                                                                                                                                                     ths.
         totalassets
        total  assets*
                     1                                     equity*
                                                                equity1                                 net income* net income1                                                          countries
                                                                                                                                                                                 employees 1

   PPF GROUP OPERATES IN 24 COUNTRIES                                                                                                               EQUITY BY SEGMENT1,2

                                                                                                                                          Other
                                                                                                                                          29%                                                  Financial
                                                                                                                                                                                               Services
                                                                                                                                                                                                 40%

                                                                                                                            Machinery
                                                                                                                              4%

                                                                                                                                Real Estate
Diverse business activities encompassing banking and financial services,                                                           10%                      Telecommunications
telecommunications, biotechnology, insurance, real estate, and agriculture                                                                                         17%

                                                                                                SHAREHOLDERS

                       Petr Kellner                                                              Ladislav Bartoníček                                                    Jean-Pascal Duvieusart
                       Founder and majority shareholder                                          CEO of PPF Telecom Group                                               CEO of Home Credit, Member of Board of
                                                                                                                                                                        Directors of PPF Real Estate
                       98.93 %                                                                   0.535 %                                                                0.535 %

[1] Assets as of 31 December 2019, equity attributable to owners of the parent as of 31 December 2019, net income attributable to owners of the parent for the period of 12 months up to 31 December 2019,
number of employees as of 31 December 2019
[2] Excluding Unallocated segment
Source: PPF Group Financial Statements for FY2019
                                                                                                                                                                                                                 5
PPF Telecom Group: Key credit highlights
            Market leading businesses with strong brand recognition, high quality assets and                                                                                             market share4 subscribers
   1        superior network coverage                                                                                                                 PPF Telecom
  •     Stable market leading positions across six European markets
  •      #1 to #2 positions in most retail markets by both revenue and customer share
                                                                                                                                                         Group
  •      Quality brand positioning in all markets                                                                                                      in 1H 2020 32% 17.0m3
  •      High quality mobile networks with full coverage
                                                                                                                                                           Czechia
  •      National fixed network infrastructure in Czech Republic                                                                                                               11
                                                                                                                                                                                                35%
                                                                                                                                                                                                   2
                                                                                                                                                                                                         5.9m
                                                                                                                                                                                                                2
                                                                                                                                                           mobile
                                                                                                                                                           + fixed
    2       Stable markets with positive long-term trends supporting growth
                                                                                                                                                           Slovakia             3
   •     Predictable regulatory environment in all markets                                                                                                                                      27%      2.2m
                                                                                                                                                            mobile
   •     Moderate intensity of the competition with stable market shares and ARPUs
   •     Growing demand for data across our footprint, further accelerated during COVID lockdown period
   •     Track record of moderate growth in all markets
                                                                                                                                                           Hungary              2
                                                                                                                                                            mobile                              29%      3.0m
    3       Diversified, strong and stable cash flow generation

   •     EBITDA generation well diversified across six independent streams
   •     Group cash conversion rate historically around 50%5                                                                                               Bulgaria             1
   •     Strong interest coverage ratios at consolidated and at PPF Telecom Group (stand-alone) level                                                       mobile                              35%      2.9m

       Credit strengths confirmed by crossover rating. Three Eurobond issues since 2019
                                                                                                                                                            Serbia              1
   •     BB+ Standard&Poor’s                                       •     550m 7Y Eurobond due 2026                                                          mobile                              35%      2.7m
   •     Ba1 Moody’s                                               •     600m 5Y Eurobond due 2025
   •     BBB- FitchRatings                                         •     600m 4Y Eurobond due 2024
                                                                                                                                                        Montenegro              1
[1] O2 CR #1 position in mobile and fixed markets combined; #1 position in mobile market shared with T-Mobile                                                  mobile                           33%      0.3m
[2] O2 CR Market share and subscribers number reported for mobile segment only; O2 CR subscribers reported using 13 months active criterion,
O2 SR and Telenor 3 months active
[3] Including O2 Group’s M2M subscribers; 15.9m excluding M2M subscribers                                                                                Source: Company data, Analysys Mason
[4] Market shares are for 1Q2020; market share for the CEE region is calculated as weighted average of mobile revenue market share for all countries where PPF Telecom Group is active                     6
[5] Cash conversion = Free cash flow / EBITDA; based on unaudited pro forma condensed consolidated financial information for 2017-2018 and Annual Report 2019
Regional mobile market overview
All markets have three main operators
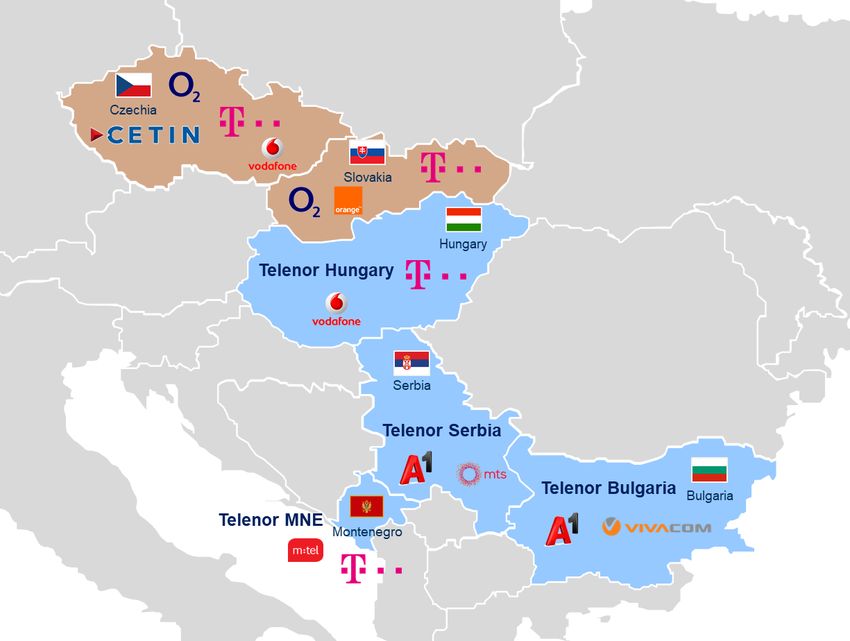
                                        7
Strong and stable position in six markets
                                                                                                                                                                                                            1
Market leader in CEE region excluding Poland with 32% market share
                                                   2
      Czechia                                                                                                                                              Slovakia
                                                   2
                                               1                                                                                                                                                     3
                                                                                 PPF Telecom Group
        ▪    5,910k mobile subs3
                                       mobile+fixed
                                                                                     in 1H 2020                                                               ▪   2,157k mobile subs3
                                                                                                                                                                                                   mobile

        ▪    35% market share1                                                                                                                                ▪   27% market share1
        ▪    €9.9   ARPU4                     26%                                                                                                             ▪   €10.0 ARPU4                       8%
        ▪    845k FBB subs
                                          EBITDA share                                                                                                                                        EBITDA share

      Czechia                                                                                                                                               Hungary
        infrastructure market                 position
                                               1                                                                                                                                                     2
                                                                                                                                                                  Telenor CEE
                                       infrastructure                                                                                                                                              mobile
        ▪   1.2m households                                                                                                                                   ▪    2,997k mobile     subs3
            connected                         23%
                                                                                                                                                              ▪    29% market share1
        ▪   >50% market share                                                                                                                                 ▪    €12.0 ARPU4                      15%
        ▪   >6k mobile sites
                                        EBITDA share                                                                                                                                          EBITDA share

      Montenegro                                                                   Serbia                                                                  Bulgaria

                                               1                                                                            1                                                                        1
            Telenor CEE                                                                   Telenor CEE                                                             Telenor CEE
                                            mobile                                                                       mobile                                                                    mobile
        ▪   315k mobile subs3                                                         ▪   2,669k mobile      subs3                                            ▪    2,937k mobile     subs3
                                              14%                                                                          14%                                                                      14%
        ▪   33% market share1                                                         ▪   35% market share1                                                   ▪    35% market share1
        ▪   €8.8 ARPU4                                                                ▪   €8.9 ARPU4                                                          ▪    €8.7 ARPU4
                                        EBITDA share5                                                                EBITDA share5                                                            EBITDA share
Source: Company data, Analysys Mason; EBITDA shares and other KPI’s based on 1H2020 results
[1] Market share for the CEE region is calculated as weighted average of mobile revenue market share for countries where PPF Telecom Group is active;
the source for market shares is Analysys Mason, August 2020; market shares are at the end of 1Q2020              [5] EBITDA share for Serbia and Montenegro are reported on a consolidated basis
[2] #1 position in mobile and fixed markets combined; #1 position in mobile market shared with T-Mobile
[3] O2 CR subscribers reported using 13 months active criterion, O2 SR and Telenor 3 months active; O2 including M2M subscribers, Telenor excluding M2M subscribers
                                                                                                                                                                                                                8
[4] ARPU is calculated according to IAS 18; O2 CZ ARPU is calculated by PPF Telecom Group using publicly available data according to IFRS15
Diversification of PPF Telecom Group
Regionally balanced portfolio with half of the business in Czechia
                          MOBILE SUBSCRIBERS BY SEGMENT                                                           GEOGRAPHICAL DISTRIBUTION OF REVENUES

 in 000’s                                      1H2020                                                 in EURm                            1H2020
                                                                                   Czech Republic 1                                                                 Czech Republic 2
                                                                                                                                    212
                                         2,984                                                                                      14%
                                          17%                                      Slovakia1                                                                        Slovakia
                                                            5,910
        Total mobile                                                                                          Total          190                  741
                                                             35%
        subscribers              2,937                                             Hungary                consolidated       13%                  48%               Hungary
          17.0m1                  17%                                                                       revenues
                                                                                                          EUR 1,545m
                                                                                   Bulgaria                                   250                                   Bulgaria
                                                       2,157                                                                  16%
                                           2,997        13%                                                                               138
                                            18%                                    Serbia +                                                                         Serbia +
                                                                                                                                          9%
                                                                                   Montenegro                                                                       Montenegro

                      GEOGRAPHICAL DISTRIBUTION OF EBITDA                                                                  EBITDA BY TYPE OF BUSINESS

 in EURm                                       1H2020                                                 in EURm                            1H2020
                                                                                                                                                              CETIN
                                                                                   Czech Republic                                                           mobile+fixed
                                            97                                                                                                              infrastructure
                                           14%                                                                                                    160         wholesale
                                                                                   Slovakia
                                                            334                                                                                   22%
           Total
                                   96                       48%                                                                                                        CETIN
        consolidated
                                  14%                                              Hungary
                                                                                                        Telenor CEE                317
          EBITDA                                                                                         mobile services                                               O2 Group
                                                                                                                                   44%
         EUR 700m                                                                                         to end users
                                                                                                                                                                       Telenor CEE
                                     110                                           Bulgaria                                                       242
                                     16%                                                                                                          34%
                                                 58
                                                                                   Serbia +                                                                     O2
                                                 8%
                                                                                   Montenegro                                                           mobile+fixed services
                                                                                                                                                           to end users
[1] Including O2 Group’s M2M subscribers; 15.9m excluding M2M subscribers                                                                                                         9
[2] O2 CZ + CETIN including international transit and excluding intercompany revenues
A track record of commitment to telco industry
                                                                                                                                                Telenor CEE

          2012                    2013                2014                   2015                      2016                   2017                   2018

      PPF aiming to                              PPF completes the                  Structural separation of      CETIN receives two ratings:     PPF Arena 1 signs
      establish 4th                              acquisition of 66%                 O2 infrastructure and         Baa2 by Moody’s                 Telenor CEE
      mobile operator in                         in Telefonica O2 CR                establishment of CETIN        BBB by Fitch                    acquisition and
      Czech Republic                             (incl. subsidiary in SK)                                                                         establishes
                                                 from Spanish Telefonica                                          CETIN issues debut              a permanent
                                                 (later raised to 84.06%)                                         dual-currency Eurobond          financing platform

2019                     Jan              Feb            Mar                                           Oct                    Nov                    Dec

                                                      PPF Arena 1 receives                               25% stake                        EUR 500m 5yr Eurobond
                                                      BB+/Ba1/BBB- ratings                               in Telenor Hungary               to partially refinance
                                                      by S&P, Moody’s, Fitch                             sold to a strategic partner      the acquisition debt

                                                      EUR 550m 7yr Eurobond
                                                      to partially refinance the acquisition debt

2020                     Jan              Feb            Mar                Apr                 May               June                 July             Aug

                       EUR 100m 5yr tap    Name changed to        5G spectrum                    EUR 500m 4yr Eurobond           Structural separation of
                                           PPF Telecom Group      acquired in Hungary            for general corporate           Telenor in Hungary,
                                                                                                 purposes                        Bulgaria and Serbia
                                                                  EUR 100m loan
                                                                                                                   EUR 100m 4yr tap              CETIN's EUR 625m
                                                                  to finance spectrum
                                                                                                                                                 committed credit
                                                                  acquisition in Hungary
                                                                                                        O2 term loan refinanced                  facility, undrawn

Source: Company data                                                                                                                                            10
PPF Telecom Group structure
                                                                                                                              1
A cluster of market-leading telecom assets

                                                                              PPF Telecom Group B.V.
                                                                                                  BB+/Ba1/BBB-
                                                                           • Term loan EUR 1.03bn, due 2024                                    of
                                                                           • Bond EUR 550m, due 2026, 3.125% p.a.
                                                                           • Bond EUR 600m, due 2025, 2.125% p.a.                   66%        Group
                                                                                                                                               debt
                                                                           • Bond EUR 600m, due 2024, 3.500% p.a.
                                                                                                                                               net leverage                     pro-forma net leverage7
                                                                              Consolidated debt EUR 4.2bn                          2.31x       30 June 2020        2.76x        26 Aug 2020 (post-dividend)

                                                         34%      of                                                      6                  of                                                                     of
                                                                  Group
                                                                  EBITDA
                                                                                        Telenor CEE                               43%        Group
                                                                                                                                             EBITDA                                                           23%
                                                                                                                                                                                                                    Group
                                                                                                                                                                                                                    EBITDA

   • Term loan EUR 223m, due 2025                                 of
                                                                             • 5Y Amortising term loan EUR 100m, due                                   • Bond EUR 625m, due 2021, 1.423% p.a.                       of
   • Schuldschein EUR 291m, due 2022/24/26              13%       Group
                                                                  debt         2025                                                2%                    +undrawn EUR 625m loan, due 2023                     19%   Group
                                                                                                                                                                                                                    debt
                                                                                                                                                       • Bond EUR 182m, due 2023, 1.25% p.a.
     O2 Czech Republic             67.83%2                                     Telenor Hungary           75%5 CETIN Hungary                             CETIN                          89.73%4
     Mobile + Fixed services       83.58%3 PPF Group                           Mobile services                    Mobile infrastructure                 Telco infrastructure           100% PPF Group
                                                                                                                                                        -/Baa2/BBB
        O2 Slovakia                100%                                        Telenor Bulgaria          100% CETIN Bulgaria
       Mobile services             by O2 Czech Republic                        Mobile services                    Mobile infrastructure

                                                                               Telenor Serbia            100% CETIN Serbia
                                                                               Mobile services                    Mobile infrastructure

                                                                               Montenegro                100%
                                                                               Mobile services and infrastructure
Source: Company data
[1] The chart represents the simplified group structure to illustrate main segments within PPF Telecom Group B.V.
[2] Share in voting rights; the difference to 65.79% share in share capital is due to ownership of own shares by O2 Czech Republic which may not exercise voting rights
[3] PPF A3 B.V. and PPF Cyprus Management Ltd, entities of the PPF Group outside of the PPF Telecom Group, hold together an additional 15.27% ownership interest in O2 Czech Republic,
    resulting in effective ownership interest of the PPF Group in O2 Czech Republic of 81.06% of share capital / 83.58% of voting rights
[4] PPF A3 B.V., an entity of the PPF Group outside of the PPF Telecom Group, owns the remaining 10.27% ownership interest in CETIN, resulting in an effective interest of the PPF Group in CETIN of 100.0%
[5] 25% stake owned by Antenna Hungária Zrt., the country’s leading state-owned telecommunications service provider, via TMT Hungary B.V. holding company
[6] Structural separation of Telenor in Hungary, Bulgaria and Serbia executed as of 1 July 2020, spinning off CETIN subsidiaries with telecommunications infrastructure
                                                                                                                                                                                                                    11
[7] Simplified calculation, using 30 June 2020 data decreased by the EUR 600m dividend paid in Aug 2020
Business update and 1st half of 2020 financial results

                                                     12
Key highlights of 1H 2020 results
Sound financial performance, investing to sustain growth
   1          Stable markets with further potential                                                               2         Structural separation of Telenor CEE

  •     Preserved overall stable competitive situation                                                            •   Separation from Telenor executed on 2 July 2020
       •   Sustainable growth of mobile subscribers +0.5% YoY in 1H2020
                                                                                                                      •   CETIN established in Hungary, Bulgaria and Serbia
       •   Share of contract clients reached 66% of total base, +2 p.p. YoY
                                                                                                                  •   Building on the success of O2 CZ separation
  •     5G spectrum auctions underway
                                                                                                                                                                                         Infrastructure:

                                                                               17.0m                              •   All changes within the perimeter of
                                                                                                                      PPF Telecom Group, not affecting
                                                                                                                                                                         CZ
                                                                                                                                                                               SK

                                                                                                                                                                               HU
                                                                                                                                                                                              integrated
                                                                                                                                                                                              separated

                                                                             mobile subscribers1
                                                                                                                                                                                    RS
                                                                                   +1.0% yoy                          its capital structure                                    ME         BG
                                                                             contract subscribers

   3          Revenue momentum                                                                                    4         Growing earnings and free cash flows

  •        “More-for-more” services pricing evolution                                                             •   Delivering on cost efficiency agenda

  •        Czech fixed subscribers momentum turnaround                                                            •   Preparation of 5G rollout
       •   CETIN wholesale FBB subscriptions up +4.3% YoY
                                                                                                                  •   4G network capacity investments,
  •        Evaluation of FMC and Pay TV
                                                                                                                      IT modernisation
           in Telenor CEE                                                      +1.1%                                                                                    +3.7%
                                                                               domestic market2
                                                                                                                                                                              EBITDA
                                                                                  revenue
                                                                                                                                                                               y-o-y
                                                                                    y-o-y
Source: Company data
[1] Including O2 Group’s M2M subscribers; 15.9m excluding M2M subscribers                                                                                                                      13
[2] Mobile, fixed and other services and HW sales on domestic markets, excluding international transit services
COVID 19 impact and outlook
Negligible impact so far, outlook is balanced mix of threats and opportunities
   MARKET DEMAND                                                                                       FREE TELCO SERVICES FOR COMMUNITY
    Government priority/ strategic infrastructure                                                      Unlimited data during lockdowns
    Increased traffic during lockdowns                                                                 Free entertainment, TV channels
    Minor impact to gross adds - most shops open                                                       O2 RE:START tariff for SME
                                                                                                        Free SMS for government
                mobile voice traffic                          mobile data traffic
      in Erl                                          in GB                                              broadcasts, volunteer helpers, free help lines
                            2020                                           2020
                                                                                                        Geolocation for infection tracing
                                                                                                        Free educational portals and libraries for closed schools
                                                                           2019
                            2019
                                                                                                        Payment terms extended for senior and disabled citizens
                     +19%          +10%         +8%                 +79%          +66%          +56%
         yoy   -1%          +16%          +6%            yoy +59%          +87%          +60%

         Jan   Feb Mar Apr May Jun              Jul     Jan   Feb Mar Apr May Jun               Jul

   OUTLOOK                                                                                             DONATIONS OF MEDICAL EQUIPMENT
    Demand for telco services will grow                                                                EUR 75k donation for health workers
    Measures to protect profitability and CF                                                           15 intensive care beds, 52 infusion
     • Opportunities in OPEX and CAPEX                                                                   pumps and 15 monitors donated
     • Focus on receivables collection                                                                  70k masks, smart phones
    Lower purchasing power                                                                             Hygiene packs for vulnerable families
    Potential second wave                                                                              PCs for centres for accommodation
                                                                                                        Phones, tablets, and cards for students’ final exams
                                                                                                        Free mobile data cards supporting digital education

Source: Company data                                                                                                                                            14
Mobile network infrastructure separation project
Executed as of 2 July 2020 in Hungary, Bulgaria and Serbia
                               OBJECTIVES AND BENEFITS                                                    PPF TELCO OPERATING MODEL

•   Sustainable model for the infrastructure separated from the                           O2 and Telenor                                   CETIN
    commercial companies, consistent across the region
    •   Clear management priorities NetCo vs. ComCo                                        Telco services                        Network assets
                                                                                         • services to end users
    •   Potential for wholesaling infrastructure services
                                                                                          • sales and marketing
    •   Potential for partnerships incl. infrastructure sharing                           • spectrum ownership
                                                                                              • network core
•   Synergies in development of the infrastructure across CETINs                                                                Network services
    •   OPEX and CAPEX savings                                                                                                 operations, maintenance
                                                                                                    MHz
                                                                                                               core               and constructions
•   Ownership and maintenance of Telenor network assets
    consolidated in CETINs

                                                                  PPF Telecom Group B.V.           NL

               PPF Telco B.V.                         NL            PPF TMT Bidco 1 B.V.      NL                      CETIN Group B.V.            NL

                        O2 CZ               68%                    Telenor HU   75%   CETIN HU                        90%   CETIN CZ

                        O2 SK                                      Telenor BG         CETIN BG
                                                                                                                                 NL    –    Netherlands
                                                                                                                                 CZ    –    Czechia
          Holding or financing company                             Telenor RS         CETIN RS                                   SK    –    Slovakia
                                                                                                                                 HU    –    Hungary
          Operating company - services to end users                                                                              BG    –    Bulgaria
                                                                            Telenor ME                                           RS    –    Serbia
          Operating company - wholesale infrastructure services                                                                  ME    –    Montenegro

    %     PPF Telecom Group ownership share

                                                                                                                                                          15
Mobile market commercial update
        O2 Czech Republic and O2 Slovakia                      Telenor Hungary, Bulgaria, Serbia + Montenegro
                        MOBILE AND FIXED                                                    MOBILE

•   Continuous growth of both Mobile and                       •   Continuous focus on customer base
    Fixed base via successful bundling                             value growth driven by pre2post
    strategy                                                       migration and growing data consumption

•   Channel transformation delivering higher                   •   Successful channel adjustments
    productivity across retail, tele-sales and                     shifting transactions to tele-sales and
    online despite of COVID19                                      on-line addressing COVID19 pandemic

                     TV AND OTHER SERVICES                                 COMPLEMENTARY EQUIPMENT AND SERVICES

•   Continuous TV growth reaching #1 in IPTV market position   •   Telenor CEE focusing on lunching new services such as Car
                                                                   fleet Drivey, Digital travel insurance or bundling wearables on
•   Network security product reaching already 100k subs            installments

                            NETWORK                                                        NETWORK

•   First commercial launch of 5G in Czech republic            •   Continued to maintain strong network perception confirmed
                                                                   by reputable benchmarks

                                                                                                                              16
Mobile revenue market shares
Telenor CEE and O2 maintain mobile revenue market shares
                               CZECHIA                                                             SLOVAKIA                                                                        HUNGARY

  25%         25%       27%        28%     28%       28%                                                                                                 24%        24%         24%       23%           23%            25%
                                                                            42%        40%     37%         36%          35%       34%

  37%         37%       37%        36%     36%       37%                                                                                                 49%        49%         49%       49%           49%            46%
                                                                            34%        35%     34%         34%          34%       35%

  38%         37%       36%        35%     35%       35%                                       27%         27%          28%       27%                    28%        27%         27%       28%           28%            29%
                                                                            24%        24%                                                                                                                                      Telenor CEE

 2015        2016       2017       2018    2019       1Q                    2015      2016     2017       2018          2019       1Q                    2015      2016         2017      2018         2019             1Q
                                                     2020                                                                         2020                                                                                 2020
    O2 Czech Republic           T-Mobile          Vodafone                    O2 Slovakia        Telekom - T-Mobile            Orange                      Telenor Hungary        Magyar Telekom - T-Mobile                 Vodafone

                           BULGARIA                                                                   SERBIA                                                                     MONTENEGRO

                                                                            20%        21%     22%         25%          28%       30%                    24%        22%         24%       27%
  36%         34%       35%        34%     33%       32%                                                                                                                                                31%            33%

                                                                            39%        39%     39%         37%                                           30%        32%         33%       33%
  25%         25%       26%        27%     30%       31%                                                                35%       35%                                                                   32%            34%

  37%         38%       38%        38%     36%       35%                    41%        40%     39%         38%          38%                              46%        46%         43%       40%           37%
                                                              Telenor CEE                                                         35%      Telenor CEE                                                                 33%      Telenor CEE

 2015        2016       2017       2018    2019       1Q                    2015      2016     2017       2018          2019       1Q                    2015      2016         2017      2018         2019             1Q
                                                     2020                                                                         2020                                                                                 2020
    Telenor Bulgaria           Vivacom            A1 – Telekom Austria        Telenor Serbia     mts – Telekom Srbija          vip – Telekom Austria       Telenor Montenegro          T-Mobile               m:tel – Telekom Srbija

Source: Analysys Mason, August 2020
                                                                                                                                                                                                                                       17
Mobile market dynamics
Stable subscriber base with ongoing prepaid to postpaid migration
                   O2 CZECH REPUBLIC                                                              O2 SLOVAKIA                                                      TELENOR HUNGARY

in millions            +5.6%              +2.0%                       in millions             +3.7%              +0.7%                         in millions              -0.9%             +2.6%
                     YoY total         YoY contract                                         YoY total         YoY contract                                           YoY total         YoY contract

       5.60       5.62       5.86      5.86        5.91 incl. M2M             2.08        2.12      2.15      2.15       2.16 incl. M2M               3.02       3.03          3.03      3.02      3.00
       5.17       5.18       5.21      5.20        5.19 excl. M2M             1.79        1.80      1.81      1.79       1.77 excl. M2M
       0.43       0.44       0.64      0.66        0.72                       0.29        0.31      0.34       0.36      0.39
                                                                                                                                                      1.08       1.07          1.05      1.02      1.00
       1.97       1.96       1.97      1.95        1.93    M2M                                                                     M2M                                                                       prepaid
                                                                              0.75        0.76      0.76      0.74       0.72                          64%                                            67%
        62%                                        63%
                                                           prepaid            58%                                           59%    prepaid                                                                   contract
                             3.25      3.26        3.26    contract                                                      1.05      contract           1.95       1.97          1.98      1.99      2.00
       3.20       3.22                                                        1.04        1.05      1.05      1.05

        2Q         3Q         4Q        1Q          2Q                         2Q          3Q        4Q         1Q        2Q                            2Q        3Q            4Q        1Q           2Q
       2019       2019       2019      2020        2020                       2019        2019      2019       2020      2020                          2019      2019          2019      2020         2020
13 months active criterion                                            3 months active criterion                                                 3 months active criterion, excluding M2M clients

                   TELENOR BULGARIA                                                          TELENOR SERBIA                                                     TELENOR MONTENEGRO

in millions              -3.4%           -1.5%                        in millions                -4.6%          +1.2%                          in millions              -12%             +1.0%
                       YoY total      YoY contract                                           YoY total       YoY contract                                           YoY total          YoY contract
                                                                                                                                                                  0.43
       3.04       3.08       3.01      2.97        2.94                       2.80        2.88      2.81       2.76                                    0.36                    0.35
                                                                                                                         2.67                                                            0.33         0.32
       0.61       0.65       0.58      0.56        0.55
        80%                                          81%
                                                           prepaid            1.15        1.21      1.13       1.09      1.00      prepaid                        0.27                                       prepaid
                                                                                                                                                       0.20                    0.19      0.17         0.15
                                                                              59%                                           63%
                                                           contract                                                                contract                                                                  contract
       2.43       2.42       2.42      2.41        2.39                                                                                                 45%                                            51%

                                                                              1.65        1.67      1.68       1.67      1.67
                                                                                                                                                       0.16       0.16         0.16      0.16         0.16

        2Q         3Q           4Q      1Q          2Q                         2Q          3Q          4Q       1Q        2Q                            2Q         3Q            4Q       1Q           2Q
       2019       2019         2019    2020        2020                       2019        2019        2019     2020      2020                          2019       2019          2019     2020         2020
3 months active criterion, excluding M2M clients                      3 months active criterion, excluding M2M clients                          3 months active criterion, excluding M2M clients

Source: Company data                                                      %         share of contract subscribers in the base, excluding M2M                                                                     18
Mobile ARPU
Generally stable ARPU across our footprint
                       O2 CZECH REPUBLIC1                                                              O2 SLOVAKIA                                                   TELENOR HUNGARY

                                 -4.4%       YoY estimate1 EUR                                             -3.4%        YoY blended EUR                                         -4.5%        YoY blended EUR
in EUR                                                                  in EUR
                                                                                                                                                 in EUR
                                 +0.6%       YoY    estimate1   CZK                                                                                                             +3.9%        YoY blended HUF

                                                                                                                                                          23.8      24.2         23.8        23.5        22.5
                10.6      10.8     10.9       10.7          10.1                  10.4          10.6       10.3        10.0      10.0
                                                                                                                                                          12.3      12.6         12.4        12.2        11.7

                                                                                                                                                          4.0        4.1         3.9         3.5          3.3

                2Q        3Q        4Q         1Q           2Q                    2Q             3Q         4Q          1Q        2Q                     2Q          3Q          4Q          1Q           2Q
               2019      2019      2019       2020         2020                  2019           2019       2019        2020      2020                   2019        2019        2019        2020         2020

                              revenue/subscribers                                                           blended                                        B2C voice contract            prepaid          blended
O2 Czech Republic is not reporting ARPU                                   O2 Slovakia is reporting only blended ARPU

                       TELENOR BULGARIA                                                          TELENOR SERBIA                                                   TELENOR MONTENEGRO
                                 +4.9%        YoY blended EUR           in EUR                             +5.3%        YoY blended EUR                                           -12%         YoY blended EUR
in EUR                                                                                                                                           in EUR
                                 +4.9%        YoY blended BGN                                              +4.9%        YoY blended RSD
                                                                          16.0           13.4      13.9      13.6        13.6     13.7                              15.6
                                                                                                                                                        15.1                     14.6        14.1        13.8
         11.1          11.5      11.5        11.6          11.6
                                                                          12.0           8.6       8.9       8.7         8.7      9.0                     10.1       9.7
         8.3           8.5        8.5         8.6           8.7                                                                                                                  7.9          8.8         8.9
                                                                            8.0                                                                           5.5        5.5                                  4.2
                                                                                                                                                                                 3.6          4.0
                                                                                         3.1       3.3       3.0         2.8      3.0
         3.1           3.2        2.9         2.7           2.9             4.0
                                                                                                                                                        2Q           3Q          4Q           1Q          2Q
                                                                            0.0
       2Q               3Q        4Q          1Q            2Q                                                                                         2019         2019        2019         2020        2020
                                                                                          2Q        3Q        4Q         1Q       2Q
      2019             2019      2019        2020          2020                          2019      2019      2019       2020     2020

           B2C voice contract             prepaid           blended                 B2C voice contract             prepaid        blended                  B2C voice contract            prepaid          blended

Source: O2 published figures, Telenor internal sources                           %     YoY growth in EUR                          %      YoY growth in local currency
[1] O2 Czech Republic stopped reporting ARPU from 2Q2019. To approximate this metric, revenue/user is calculated as mobile service revenue (excluding inbound roaming and M2M revenues) divided by the average   19
number of active mobile subscribers (excluding M2M). O2 Slovakia calculation of ARPU excludes inbound roaming and M2M revenues (undisclosed); Telenor calculation excludes inbound roaming and M2M revenues
Fixed services in the Czech Republic
CETIN upgraded its network, resumed growth and supported growth of O2
                      CETIN WHOLESALE FBB SUBSCRIPTIONS                            O2 CR TECHNOLOGY-AGNOSTIC BROADBAND1 SUBSCRIBERS

in '000s                                4.3%                               in '000s                                   2.8%
                                         YoY                                                                           YoY

             918              927        936    948       958
                                                                                        822             830            835             840               845

              2Q               3Q         4Q     1Q        2Q                            2Q             3Q              4Q              1Q                2Q
             2019             2019       2019   2020      2020                          2019           2019            2019            2020              2020

                                                                           [1] O2 CR definition: Cable (ADSL, VDSL, fibre) and wireless (4G LTE, WTTx)
Source: CETIN                                                              Source: O2 quarterly results

                      CETIN FIXED NETWORK MODERNISATION                                                  O2 CR PAY TV SUBSCRIBERS2

•   Upgrading xDSL via FFTc/FTTb/FTTh
                                                                           in '000s                                   24.3%
                                     +52 p.p.                                                                          YoY

                    30%               65%          82%    50+ Mbps lines

                    30%               36%
                                                                                                                        443            459               476
                                                   60%    100+ Mbps                     383             406
                    38%               29%
                                                   22%    50 Mbps
                                      20%                                                2Q             3Q              4Q              1Q                2Q
                    32%                             9%    20 Mbps
                                      15%           9%    ADSL                          2019           2019            2019            2020              2020
                    2015              2018         2019                    [2] O2 CR definitions: IPTV and OTT, incl. "Multi" service (second set-top-box) until 3Q 2019.
                                                                           Since 4Q 2019 incl. prepaid O2 TV Sport Pack online and O2 TV HBO and Sport Pack packages
Source: CETIN internal data                                                                                                                                                 20
                                                                           Source: O2 quarterly results
1H2020 consolidated results at a glance
Sound results, all businesses contributed to the growth of group’s earnings
                 REVENUES BY SEGMENT                                                                 REVENUES                                                                     EBITDA

EURm                          1H2019 1H2020 1H2020              2019
                                               yoy               yoy
Consolidated                                                              EURm                         Consolidated                                   EURm
                                1,507     1,545      2.5%       0.1%
revenues1                                                                                                                  1,545
                                                                                          1,507            +2.5%                                                     675            +3.7%             700
O2 Group                          747        742     -0.7%      2.5%
CETIN excl. transit               228        229     0.5%       2.5%
                                                                                                                                      International
                                                                                           118              YoY             137       transit                                                                    IFRS 16
Telenor CEE                       655        666     1.7%       2.4%                                                                                                  50             YoY               52
                                                                                                                                                                                                                 impact
  o/w Hungary                     255        250     -2.0%      1.9%                                                                  Domestic
                                                                                                                                      revenues
  o/w Bulgaria                    184        190     3.3%       2.3%                     1,393            +1.1%           1,408                                                     +3.7%
                                                                                                                                                                     625                              648
  o/w Serbia + Montenegro         200        212     6.0%       3.5%
Eliminations                       -241      -229     -5.0%      8.6%
Consolid. revenues                                                                       1H2019                          1H2020                                    1H2019                           1H2020
                                1,393     1,408      1.1%       1.5%
excl. transit

                   EBITDA BY SEGMENT                                                                    CAPEX2                                                FREE CASH FLOWS AFTER LEASES3

EURm                          1H2019 1H2020 1H2020              2019
                                                                          EURm                                                                        EURm
                                               yoy               yoy
                                                                                                                                                                     Free Cash Flows before spectrum CAPEX
EBITDA                            675        700     3.7%        14%                                                                                                                                  384
                                                                                                           +60%
                                                                                                                            254                                      301              +28%
O2 Group                          237        242     2.1%        13%
CETIN                             163        160     -1.8%       13%                                                                                                                  YoY                       Spectrum
                                                                                           159                              100       Spectrum                                                        100
                                                                                                            YoY                                                                                                 CAPEX
                                                                                                                                                                      31
Telenor CEE                       275        303      10%        16%                        31
  o/w Hungary                     104        110     5.8%        16%
                                                                                                           +20%            154                                       270             +5.2%            284
                                                                                           128
  o/w Bulgaria                      87        96      10%        14%

  o/w Serbia + Montenegro           83        97      17%        18%
                                                                                         1H2019                          1H2020                                    1H2019                           1H2020
EBITDA
                                  625        648     3.7%       6.4%
excl. IFRS 16 impact
 Source: Telenor CEE internal data, CETIN Annual report 2019,
 PPF Telecom Group audited consolidated financial statements for the year ended 31 December 2019, 2017 and 2018 based on unaudited pro forma condensed consolidated financial information,
[1] Revenues + other income                                                                                                                                                                                           21
[2] CAPEX represents additions to property, plant and equipment and intangible assets
[3] Free cash flows represent Net cash from operating activities less cash used for Purchase of PPE and intangible assets and including Proceeds from disposals of PPE and intangible assets and including Lease payments
Key credit metrics
Majority of the consolidated debt is held at PPF Telecom Group level
              NOMINAL FINANCIAL DEBT1 PROFILE AS OF 30-JUN-2020                                                         CONSOLIDATED NET LEVERAGE RATIO5 AS OF 30-JUN-2020

    in EURm                                                          O2 CR
                                                                                                             in EURm
                                                  291           20                                                      3.20x Gross leverage
    O2                  553m                                          223
    CETIN               807m                                                    PPF Telecom Group
    Telenor Hungary     100m              1,932         2,020                                                                                  1,184
    PPF Telecom Group 2,783m                                          600                                                                                             2.31x Net leverage
    FINANCIAL DEBT       4,243m
                                                    CETIN                         20       O2 CR
                                            20                                                                          4,229
                                                        182
                                                                                 600          36                                               3,045                  3,045
                                                                     1,033
                      625          O2 CR                625                                  550                                                                                               1,321
                                    32                                           262
                20            20
        2020         2021          2022             2023             2024       2025         2026                  Financial debt 2            Cash                 Net debt 3                 EBITDA 4
            Term loans        Bonds         Schuldscheins              Amortising term loan TNR HU
                                                                                                                                       Financial debt             Cash            EBITDA
•    EUR 625m CETIN liquidity back-up facility, signed 31 July 2020, undrawn and committed                  •    In Aug 2020, PPF Telecom Group has paid a EUR 600m dividend, driving the pro-forma net
     for refinancing of the 1.423% EUR 625m Dec 2021 bond.                                                       leverage to 2.76x
•    EUR 1,033m PPF Telecom Group bank loan can be prepaid with no prepayment fee

                                                  BONDS                                                                                     2020 LEVERAGE5 DYNAMICS

CETIN - investment grade Baa2 / BBB (Moody’s / FitchRatings)                                                     3.2x                    financial policy threshold for net leverage excl. IFRS 16 impact
•    Eurobond EUR 625m, 5 years, due Dec 2021, 1.423% p.a.                                                                  3.09x
                                                                                                                                                                         3.20x
     + undrawn EUR 625m facility, due Dec 2023, committed for refinancing                                                                                                              2.76x
                                                                                                                                                                                                26-Aug-2020
                                                                                                                                                                                                 pro-forma6
•    Eurobond CZK 4,866m (EUR 192m), 7 years, due Dec 2023, 1.235% p.a.
                                                                                                                                         2.48x
                                                                                                                                                                                      2.31x
PPF Telecom Group - crossover rating BB+ / Ba1 / BBB- (S&P/ M / F)
•    Eurobond EUR 550m, 7 years, due Mar 2026, 3.125% p.a.
•    Eurobond EUR 600m, 5 years, due Jan 2025, 2.125% p.a.
•    Eurobond EUR 600m, 4 years, due May 2024, 3.500% p.a.                                                                      31 Dec 2019                                 30-Jun-20
                                                                                                                                    Gross leverage                 Net leverage
Source: O2 published results, PPF Telecom Group internal data, PPF Telecom Group audited consolidated financial statements for the year ended 31 December 2019 and PPF Telecom Group 1H2020 financial statements
[1] Outstanding principal amounts, excluding RCF and overdraft facilities; CZK-denominated debt converted with EUR/CZK rate of 26.74
[2] Financial debt = amount due to banks and debt securities issued, including amortised legal fees/bank fees and accrued interest, excluding IFRS 16 impact
[3] Net debt = Gross debt (excluding IFRS 16 impact) less Cash and cash equivalents and other highly liquid assets
[4] EBITDA for the last twelve months preceding 30 June 2020, excluding IFRS 16 impact                                                                                                                       22
[5] Consolidated net leverage ratio = consolidated Gross Debt less Cash and cash equivalents / EBITDA for the last twelve months preceding 30 June 2020, excluding IFRS 16 impact
[6] Simplified calculation, using 30 June 2020 data decreased by the EUR 600m dividend paid in Aug 2020
Appendix - Key financial metrics
EURm                                       2018      2019    2019 yoy         1H2019       1H2020    1H2020 yoy
Consolidated revenues                     3,165     3,170         0.1%          1,507        1,545          2.5%
O2 Group                                  1,497     1,534         2.5%            747          742         -0.7%
CETIN excl. transit                         460       471         2.5%            228          229          0.5%
Telenor CEE                               1,343     1,375         2.4%            655          666          1.7%
 o/w Hungary                                517       527         1.9%            255          250         -2.0%
 o/w Bulgaria                               375       384         2.3%            184          190          3.3%
 o/w Serbia + Montenegro                    415       430         3.5%            200          212          6.0%
Eliminations                                -453      -492         8.6%           -241        -229          -5.0%
CETIN transit revenues                      319       282         -12%            118          137           16%
Cons. revenues (excl. transit)            2,846     2,888         1.5%          1,393        1,408          1.1%
                                                                                                                                                                    2018     2019      1H2019 1H2020
EBITDA                                    1,220     1,397         14%             675          700          3.7%    EBITDA margins                                   39%     44%           45%       45%
O2 Group                                    433       492         13%             237          242          2.1%    O2 Group                                         29%     32%           32%       33%
CETIN                                       295       333         13%             163          160         -1.8%    CETIN                                            64%     71%           71%       70%
Telenor CEE                                 493       573         16%             275          303          10%     Telenor CEE                                      37%     42%           42%       45%
 o/w Hungary                                179       208         16%             104          110          5.8%     o/w Hungary                                     35%     39%           41%       44%
 o/w Bulgaria                               158       180         14%              87           96          10%      o/w Bulgaria                                    42%     47%           47%       51%
 o/w Serbia + Montenegro                    156       184         18%              83           97          17%      o/w Serbia + Montenegro                         37%     43%           42%       46%
EBITDA excl. IFRS 16 impact               1,220     1,298         6.4%            625          648          3.7%    EBITDA margins                                   39%     41%           41%       42%

CAPEX                                       423       392        -7.5%            159          254           60%    CAPEX / revenues                                 13%      12%          11%       16%
O2 Group                                    172        95         -45%             41           39         -4.9%    O2 Group                                        11%      6.2%         5.5%      5.3%
CETIN                                       158       161         2.1%             55           63          15%     CETIN                                           34%      34%           24%       27%
Telenor CEE                                  94       136          45%             63          152         141%     Telenor CEE                                     7.0%     9.9%         9.6%       23%
 o/w Hungary                                 34        62          83%             40          122         205%      o/w Hungary                                    6.6%     12%           16%       49%
 o/w Bulgaria                                23        28          20%             11           13          18%      o/w Bulgaria                                   6.1%     7.2%         6.0%      6.8%
 o/w Serbia + Montenegro                     37        46          26%             12           17          42%      o/w Serbia+ Montenegro                         8.8%     11%          6.0%      8.0%

EBITDA less Capex                           797     1,005          26%            516          446           -14%
O2 Group                                    261       397         52%             196          203          3.6%
CETIN                                       138       172         25%             108           97          -10%
Telenor CEE                                 399       437         9.5%            212          151          -29%
 o/w Hungary                                145       146         0.5%             64          -12         -119%
 o/w Bulgaria                               135       152         13%              76           83          9.2%
 o/w Serbia + Montenegro                    119       138         16%              71           80            13%

Free Cash Flow                              598       827          38%            319          344          7.8% FCF Conversion rate                                 49%     59%           47%       49%

FCF after lease payments                    598       727          22%            270          284          5.2% FCF Conv. rate after lease payments                 49%     56%           43%       44%
Source: 2018 figures are based on unaudited pro forma condensed consolidated financial information; CETIN revenues from international voice transit service were provided by Group’s internal reporting and will be
published in CETIN’s annual reports; these revenues contribute only a minimum amount of gross profit/EBITDA
2018 figures are excluding the effects of IFRS 16; 2019 figures are including the effects of IFRS 16 adoption, using the modified retrospective method
                                                                                                                                                                                                                      23
Free cash flows represent Net cash from operating activities less cash used for Purchase of PPE and intangible assets and including Proceeds from disposals of PPE and intangible assets
Appendix - Group balance sheet highlights
New bond issues further diversified the Group’s funding sources
 in EURm                                                            31 Dec 2019 30 Jun 2020                    diff.

 Non-current assets                                                            6,643                  6,324   -4.8%

 •     o/w property, plant & equip. + intangible                               4,365                  4,150   -4.9%

 Current assets                                                                1,572                  1,899   +21%

 •     o/w cash & other highly liquid assets                                      795                 1,184   +49% 600m dividend paid in Aug ’20; the remainder held

                                                                                                                       for spectrum auctions and as liquidity reserve

 TOTAL ASSETS                                                                  8,215                  8,222   +0.1%

 EQUITY                                                                        2,261                  2,209   -2.3%

 Liabilities                                                                   5,954                  6,011   +1.0%

 •     o/w bonds                                                               1,869                  2,564   +37% +700m PPF Telecom Group Eurobonds

       o/w debt to banks                                                       2,139                  1,665   -22% -545m net repayment of term loan,

                                                                                                                       +100m Telenor HU spectrum financing

                                                                                                                                                                        24
Source: PPF Telecom Group audited consolidated financial statements for the year ended 30 June 2020
Appendix - Spectrum allocation
                   band size up to:    2 x 30 MHz     2 x 30 MHz   2 x 35 MHz     2 x 115 MHz     2 x 60 MHz       2 x 80 MHz   70 MHz   2 x 100 MHz      190 MHz    200 MHz

                                                                                                                    FDD         TDD        FDD             TDD       TDD
                   410         450       700            800           900           1 800           2 100           2 600       2 600      3 500           3 500     3 700
                                       upcoming                                                                                                           upcoming

                                                      2 x 10 MHz   2 x 10 MHz     2 x 27 MHz      2 x 19.8 MHz     2 x 20 MHz            Vodafone                    40 MHz    Vodafone

Czechia           3 MHz     Nordic                                                                                                                                   80 MHz    Nordic
                                       2 x 30 MHz     2 x 10 MHz   2 x 12.7 MHz   2 x 20 MHz      2 x 19.8 MHz     2 x 30 MHz   25 MHz   T-Mobile          190 MHz
                                                                                                                                                                     40 MHz    PODA

                     O2        4 MHz                  2 x 10 MHz   2 x 12.4 MHz   2 x 27.8 MHz    2 x 19.8 MHz     2 x 20 MHz   25 MHz   O2                          40 MHz    O2

                                       upcoming

                          Orange                      2 x 10 MHz   2 x 4.6 MHz    2 x 8.9 MHz     2 x 20 MHz       2 x 30 MHz            2 x 35 MHz    Slovanet      80 MHz    regional
                                                                                  2 x 20 MHz
Slovakia                  T-Mobile
                                                                   2 x 10 MHz                                                                              20 MHz    40 MHz    4ka
                                       2 x 30 MHz     2 x 10 MHz                  2 x 15 MHz      2 x 20 MHz       2 x 40 MHz   50 MHz
                                                                   2 x 10.2 MHz                                                                                      40 MHz    Benestra
                                                                                  2 x 15.2 MHz
                          O2                          2 x 10 MHz                                  2 x 20 MHz                                                                   O2
                                                                   2 x 10.2 MHz   2 x 15.8 MHz                                           2 x 45 MHz        20 MHz    40 MHz

                                          new                                                    2 x 15 MHz new                                                        new

                                       2 x 10 MHz     2 x 10 MHz   2 x 11 MHz     2 x 15 MHz      2 x 20 MHz       2 x 20 MHz   25 MHz                     120 MHz   50 MHz
                          Vodafone
Hungary                                                                           2 x 4.9 MHz                                   25 MHz                     60 MHz
                          T-Mobile     2 x 10 MHz     2 x 10 MHz   2 x 12 MHz                     2 x 25 MHz       2 x 30 MHz                                        120 MHz
                                                                                  2 x 25 MHz                                                   DIGI        20 MHz
                          Telenor      2 x 5 MHz      2 x 10 MHz   2 x 11.8 MHz   2 x 29.9 MHz    2 x 15 MHz       2 x 20 MHz                                        140 MHz

                                                                                  2 x 10 MHz
                                                                                   2 x 5 MHz                      Bulsatcom
                                                        A1         2 x 11.2 MHz                   2 x 15 MHz
Bulgaria                                                                          2 x 15 MHz
                                                                                                  2 x 15 MHz
                                                        Vivacom    2 x 11.2 MHz   2 x 15 MHz                      T.com
                                                                                  2 x 15 MHz      2 x 15 MHz
                                                        Telenor    2 x 11.2 MHz                   2 x 15 MHz
                                                                                  2 x 15 MHz

                                                      2 x 10 MHz   2 x 11.2 MHz    2 x 5 MHz      2 x 15 MHz
                                         mt:s

Serbia                                   Vip mobile
                                                                   2 x 9.6 MHz    2 x 20 MHz      2 x 15 MHz
                                                      2 x 10 MHz
                                                                   2 x 4.2 MHz    2 x 30 MHz      2 x 15 MHz
                                         Telenor      2 x 10 MHz   2 x 9.6 MHz    2 x 20 MHz      2 x 15 MHz

                                                      2 x 10 MHz   2 x 10 MHz     2 x 25 MHz       2 x 5 MHz       2 x 40 MHz   45 MHz   2 x 75 MHz
                                         m:tel

Montenegro                               T-Mobile                  2 x 10 MHz     2 x 25 MHz
                                                                                                  2 x 15 MHz       2 x 20 MHz            2 x 25 MHz

                                                      2 x 20 MHz                                  2 x 20 MHz       2 x 10 MHz   5 MHz
                                         Telenor                   2 x 15 MHz     2 x 25 MHz      2 x 20 MHz

                   410         450       700            800           900           1 800           2 100           2 600       2 600      3 500           3 500     3 700              25
                                                                                                                    FDD         TDD        FDD             TDD
Source: spectrummonitoring.com
www.ppftelecom.eu

        THANK YOU FOR YOUR ATTENTION

                    Q&A
                                       26
You can also read