An Introduction to Hyve Group plc - May 2020

Page created by Gary Armstrong
 
CONTINUE READING
An Introduction to Hyve Group plc - May 2020
An Introduction
to Hyve Group plc
     May 2020
An Introduction to Hyve Group plc - May 2020
We are Hyve                                                                                            2019 financial and operational highlights

                                                                                                         £220.7m                      £50.4m                           7%                           +14                        +28
We are a next generation global events business creating unmissable events, where                                                                                  like-for-like             Top 10 exhibitor            Top 10 visitor
customers from all corners of the globe share extraordinary moments and shape industry                     revenue                  headline profit                                          NPS (vs. industry          NPS (vs. industry
                                                                                                                                                                     revenue
                                                                                                                                      before tax                                              average -17)*              average +7)**
innovation.                                                                                                                                                           growth

Our vision is to create the world’s leading portfolio of content-driven, must-attend events         * Source: UFI & Explori, Global Exhibitor Insights, November 2017 edition ** Source: UFI & Explori, Global Visitor Insights, 2018/19 edition

delivering an outstanding experience and ROI for our customers.
                                                                                                       Revenue by division
Where business is personal, where meetings move markets and where today’s leaders
inspire tomorrow’s.                                                                                                                                                          Global Brands                                      31%

                                                                                                                                                                             Russia                                             25%

  130+                      in 14                  1,200+                       in 13                                                   FY                                   UK                                                 20%

   events                  countries                colleagues                 countries
                                                                                                                                    19                                       Asia

                                                                                                                                                                             Central Asia
                                                                                                                                                                                                                                 9%

                                                                                                                                                                                                                                 8%

                                                                                                                                                                             Eastern & Southern Europe                           8%

                                                                                                      This is based on the enlarged group pro-forma FY19 revenue by region including Shoptalk and Groceryshop (acquired December2019)

                                                                 100+       50 - 100     1 - 50        Our leadership team
                                                               India      China        Azerbaijan
                                                               Russia     Kazahkstan   Brazil
                                                               UK         Turkey       Indonesia
                                                                          Ukraine      UAE
                                                                                       USA
                                                                                       Uzbekistan

                                                                                                                                       Mark Shashoua                          Andrew Beach
                                                                                                                                       Chief ExecutiveOfficer                 Chief Financial Officer                                 / 2
An Introduction to Hyve Group plc - May 2020
Recent acquisitions                                                                 Revenue by sector                                                       Advanced Technologies                      3%

                                                                                                                                                            Beauty & Healthcare                        4%

                      Shoptalk                                                                                                                              Build & Interiors                         15%
                      ▪ 8,000+ attendees                     Grocery shop                                                                                                                              6%
                                                                                                                                                            Connect
                      ▪ Becomes our #1                       ▪ 2,200+ attendees
                        event by revenue                     ▪ Becomes our #9                                                                               E-Commerce                                11%
                      ▪ +50 attendee NPS                       event by revenue                                FY                                                                                      4%
                                                                                                                                                            Energy
                                                             ▪ +42 attendee NPS

                                                                                                            19                                              Education
                                                                                                                                                            Fashion
                                                                                                                                                                                                       7%

                                                                                                                                                                                                       7%

                                                                                                                                                            Food & Packaging                          12%
Our top 10 events (based on FY19 pro-forma revenue)
                                                                                                                                                            Manufacturing Industrial Tech 7%
                                                                                                                                                            Retail                                    13%

                                                                                                                                                            Transport & Logistics                      7%
1.             2.                     3.                     4.
                                                                                                                                                            Travel & Tourism                           4%

                                                                                  This is based on the enlarged group pro-forma FY19 revenue by region including Shoptalk and Groceryshop (acquired December2019)

     5.                  6.                       7.

8.                              9.                     10.
                                                                                                                                           Talk to us
                                                                                                                                           LinkedIn: Hyve Group plc
                                                                                                                                           Instagram: @hyve_group
                                                                                                                                           Twitter: @hyve_group                                              / 3
                                                                                                                                           Facebook: HyveEvents
                                                                                                                                           YouTube: Hyve Group plc
An Introduction to Hyve Group plc - May 2020
Contents
› Our Senior Executive team   p3
› Our business model          p4
› Market overview             p7
› 2017 strategic review       p10
› Transformation delivered    p18
› TAG financials              p30
› FY19 results                p39
› Appendices                  p46

                                    Introduction to Hyve Group plc – May 2020   / 4
An Introduction to Hyve Group plc - May 2020
Our Senior Executive Team
Mark Shashoua – Chief Executive Officer                                      Andrew Beach – Chief Financial Officer
                 ›    Appointed CEO in September 2016                                          ›   Appointed CFO in October 2016 and is Chairman of
                 ›    Previously CEO of i2i Events Group, (events arm of                           Hyve’s Risk Committee
                      Ascential) from 2011, led the professionalisation                        ›   Previously the Chief Financial and Operating
                      and diversification of the business, turning it from                         Officer of Ebiquity plc, spent nine years overseeing
                      double-digit CAGR decline to one of consistent                               the rapid expansion of the business to 20 offices in
                      organic CAGR growth                                                          14 markets, employing over 900 staff
›   Second-generation and prominent figure in the international events       ›   Prior to joining Ebiquity, he spent nine years at PwC as part of the
    industry                                                                     Entertainment and Media assurance practice where he qualified as a
›   From 2001, he was a co-founder and Chief Executive Officer of                Chartered Accountant (ICAEW) in 2000
    Expomedia Group Plc and from 2009-2011, Mark was the operating           ›   Andrew headed up the PwC UK Publishing sector knowledge network
    partner of Advent International, a leading private equity fund               and managed a portfolio of large media clients
›   One of the founding members of the Hyve group (then ITE) which
    grew organically from 3 people to over 800 and 80 shows. He led the
    floatation of the business in 1998 as CEO, and was a board director
    until 1999.

                                                                                                                Introduction to Hyve Group plc – May 2020   / 5
An Introduction to Hyve Group plc - May 2020
Our business model

               Introduction to Hyve Group plc – May 2020   / 6
An Introduction to Hyve Group plc - May 2020
Our business model

Connecting people
  EXHIBITORS                                                                                                   VISITORS
  use our events to satisfy all                                                            come to our events to
  of their marketing needs:                                                           learn, experience, develop
  to transact, market their                                                                            their skills,
  brand, launch a product,                                                            find inspiration, meet new
  educate the sector, deploy                                                           contacts or buy products.
  thought leadership or
  steer their industry.

                                  Hyve Group provides market-leading , face-to-
                                  face platforms where communities can come
                                   together to achieve all of this within a high-
                                          quality exhibition experience.

                                                                               Introduction to Hyve Group plc – May 2020   / 7
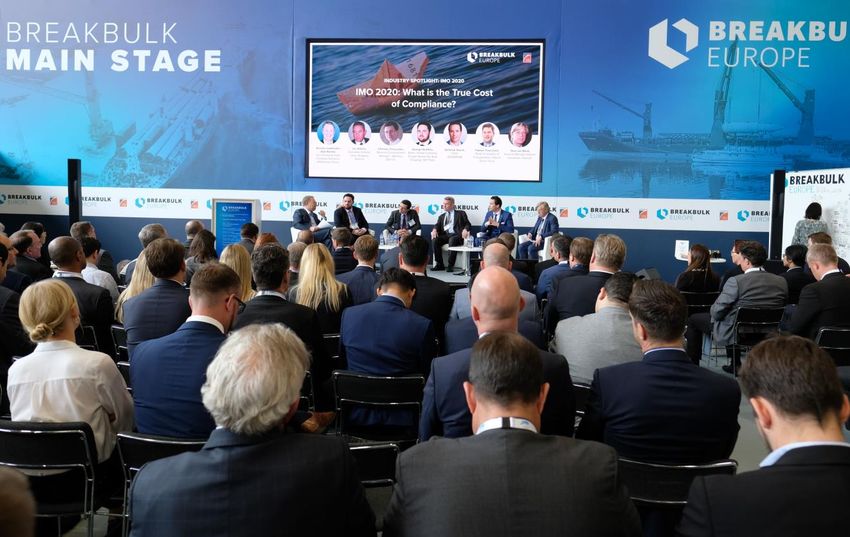
An Introduction to Hyve Group plc - May 2020
Our business model

Revenue streams managed the Hyve way
Our revenue is generated through multiple streams                            We do things the Hyve way so exhibitors, visitors and
                                                                             sponsors choose us
83% of our revenue is generated from exhibitors, with each exhibitor
paying for floor space at an event, and many taking technical services
(such as stand construction and furniture).

Usually, visitors attend for free (with a few exceptions). Some events
benefit from sponsorship revenue.                                            MARKET-           CONTENT-           MUST-              OUTSTANDING        RETURN ON
                                                                             LEADING:          DRIVEN:            ATTEND:            CUSTOMER           INVESTMENT:
                                                                             We focus on       We supply          We offer the       EXPERIENCE:        Our customer
                                                                             market-leading    thought-           best of            We have a          success team
                                                                             events, so that   provoking          everything to      relentless focus   makes sure
             12%                  Exhibitor space                            we have the       content that       ensure we are      on improving       exhibitors
        5%                                                                   highest value     attracts high      the one event      every part of      achieve their
      7%                          Technical services                         proposition       quality visitors   that our           the customer       event goals so
                                                                             for exhibitors    and raises the     customers          experience and     that they come
                                                                             and visitors      profile of our     choose to put      tailoring our      back next time
                                  Sponsorship                                                  events             in their           communication
                      76%                                                                                         calendars          with them
                                  Other (incl delegates & hosted meetings)

                                                                                                                     Introduction to Hyve Group plc – May 2020   / 8
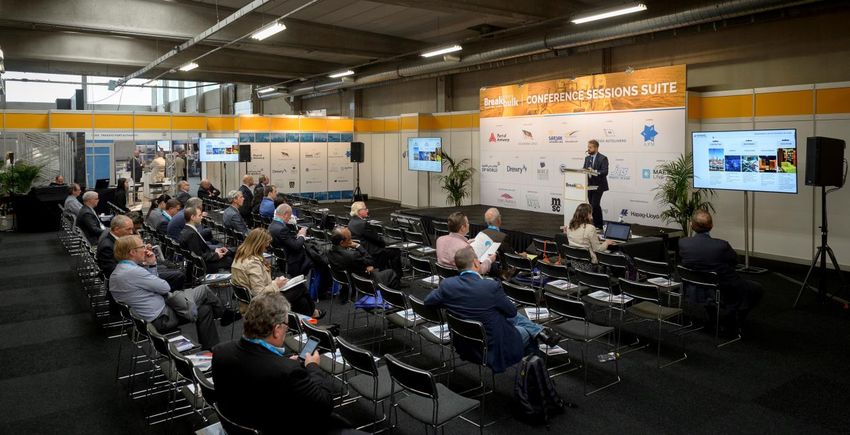
An Introduction to Hyve Group plc - May 2020
Market overview

             Introduction to Hyve Group plc – May 2020   / 9
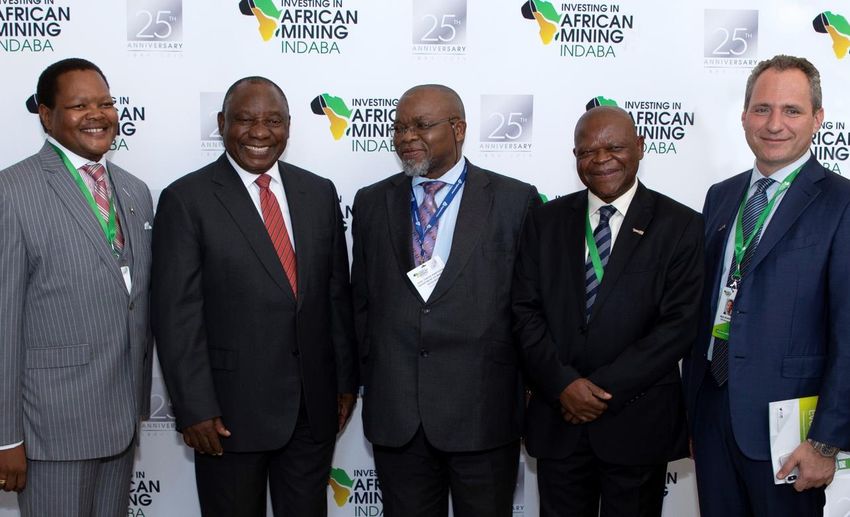
An Introduction to Hyve Group plc - May 2020
Market overview

Overview of the events industry
Competition                                                                                   Top 10 international organisers by
                                                                                           organising revenues, 2018, million USD1
 › M&A consolidation in traditional event                                                     Informa                                               1976
   organisers
                                                                                      Reed Exhibitions                                      1625
 › New market entrants focussing on sectors                                           Messe Frankfurt                 678
   which are being disrupted
                                                                                               Clarion          456
 › Online business communities and DIY meet-up                                          Comexposium            424
   platforms challenging the traditional model
                                                                                        Messe Munich       369
 › Impact of new technologies - augmented                                            Messe Dusseldorf     307
   reality, facial recognition, improved analytics
                                                                                                 Hyve    234 2
   tools provide opportunities to increase
                                                                                      Deutsche Messe     229
   engagement, create better products and drive
   better ROI and ROT for customers                                                         GL Events    184

         1   Source: Organiser’s financial reports; AMR International, Globex 2019
         2 Pre  acquisition of Ascential, Mining Indaba and Shoptalk/Groceryshop.                              Introduction to Hyve Group plc – May 2020   / 10
             FY19 result approx. $285m
Market overview

Global exhibition market forecast
› Steady growth is forecast (4% CAGR to                                                                          Overall market forecast 2018-2023, $b1
  2023), driven by stable underlying
  economies and consistent demand for face-                                                                                                       4%
                                                                                                                                                  CAGR

  to-face business interactions
› AMR International predict that face-to-face
  interactions enabled by exhibitions will
  remain a critical channel for buyers and                                                                                                                32.2              34.0             35.3
                                                                                                                        29.6             31.0
  sellers                                                                                             28.5

› They further predict that alternative online
  channels will remain complementary, and
  may become sources of enhanced visitor                                                              2018             2019              2020             2021             2022              2023
  and exhibitor experience.

         1   Market size represents the size of the 14 main geographic markets analysed by AMR International and the six SEA countries added in 2017
             Excludes ‘Rest of the World’
                                                                                                                                                     Introduction to Hyve Group plc – May 2020   / 11
             Source: AMR International, Globex 2019
2017 strategic review

                 Introduction to Hyve Group plc – May 2020   / 12
2017 strategic review

Historical context prior to TAG programme
Revenue decline and unsustainable margins                            Changing customer expectations

                                      -11%
                                      CAGR                           › Exhibitors demand Return on Investment
    £192m
                           £175m

                                             £136m           £134m   › Visitors demand Return on Time

                                                                     › Greater emphasis on learning and
                                                                       networking within a business community
     31%                     35%              36%             29%
     FY13                    FY14             FY15           FY16

                        Headline operating profit    Costs

                                                                                       Introduction to Hyve Group plc – May 2020   / 13
2017 strategic review

Portfolio challenges prior to TAG programme
                                                          Event performance vs underlying market
                                                                   Hyve Event Space Growth (%), 2014-16 CAGR

› The portfolio had additional                                                      100%
                                                                                     90%
                                                Outperforming

                                                                                                                                            Underlying Market Growth (%), 2014-15
  challenges beyond market conditions            the market
                                                                                     80%
                                                                                     70%
                                                                                     60%
                                                                                     50%
                                                                                     40%
› A number of events had                                                             30%
                                                                                     20%
  underperformed the market                                                          10%
                                                                                      0%
                                        -50.0     -40.0    -30.0     -20.0    -10.0 -10% 0.0   10.0    20.0      30.0     40.0      50.0
                                                                                    -20%

› There were some obvious stars                                                     -30%
                                                                                    -40%

  to offset these challenges                                                        -50%
                                                                                    -60%
                                                                                                               Underperforming
                                                                                    -70%
                                                                                    -80%
                                                                                                                 the market
                                                                                    -90%
                                                                                   -100%

                                                                                                Introduction to Hyve Group plc – May 2020                                           / 14
2017 strategic review

The May 2017 Portfolio: Events Ranked by Revenue

                              85%
                             Core Events Revenue

                                             Introduction to Hyve Group plc – May 2020   / 15
2017 strategic review

 Philosophies
              Market leading                   Customer insight
              events – ROI / ROT               and data

              Content-led –
                                               Customer service
              high on relevance

                                               Strong sales and
              Retention-led
                                               marketing
              business enabled
                                               performance
              by technology
                                               based culture

                                   Introduction to Hyve Group plc – May 2020   / 16
2017 strategic review

 Hyve view of the exhibitions industry
                                            Product-led

                                                Global Portfolio

                        Regional
                         Players
                                         Emerging Markets Specialists

                                    Developed Market Regional Specialists

                                      Disrupters of Existing Shows
                                   (show formats or industry niches)

                                                                            Introduction to Hyve Group plc – May 2020   / 17
2017 strategic review

Our vision
 “To create the world’s leading portfolio of
    content-driven, must-attend events
   delivering an outstanding experience
        and ROI for our customers.”

                                               Introduction to Hyve Group plc – May 2020   / 18
2017 strategic review

Transformation and Growth programme
                                       TAG Programme

             Create a                      Manage                             Product-led
        Scalable Platform                the Portfolio                        Acquisitions

                            Underpinned by a performance-led culture

                                                                       Introduction to Hyve Group plc – May 2020   / 19
Transformation delivered

                  Introduction to Hyve Group plc – May 2020   / 20
Transformation delivered

Scalable operating model created
                           Created best practice functions & teams

                           Invested in show operations

                           Built capability & talent

                           Drove a performance culture

                           Built fit-for-purpose IT infrastructure & systems

                                                                      Introduction to Hyve Group plc – May 2020   / 21
Transformation delivered

Strengthened KPIs from our Top 10 TAG events
   New customer service                                                        New high quality       Systematic lead
   team helps exhibitors                                                       content attracts      generation drives
     maximise success                                                            key visitors             growth

 Exhibitor NPS (FY16-19)                                               Visitor NPS (FY16-19)      New business (FY18-19)
increased from +3 to +14;                                           increased from +14 to +28;      increased by >25%
 industry average is -17*                                             industry average is +7**

           * UFI & Explori, Global Exhibitor Insights, November 2017 Edition
                                                                                                    Introduction to Hyve Group plc – May 2020   / 22
           **UFI & Explori, Global Visitor Insights, 2018/19 Edition
Transformation delivered

Managing the portfolio
                                 Higher                            Event Quality & Potential                             Lower
                                          Growth                   Mature                       Challenged                                   89 less profitable
                                          Market tailwind          Stable, mature market        Facing market or
                                                                                                                                            shows discontinued
                                                                                                competitive threat
                                                                                                                                             since start of TAG
           Large
           >£1.0m revenue                  Use full suite of         Pricing, show value         Manage pro-actively,
                                                                                                                             Top
                                           transformational          and content to drive        solve issues across        priority       Successful disposal of
                                           levers                    yield and retention         commercial, content                        TradeLink, ECMI and
                                                                                                 and operations                           ITE Expo (Russian non-
                                           Enable sales &                                                                                          core)
                                                                            Core
   Scale

                                                                                                                            Medium
                                           marketing to drive                                                               priority
           Medium                          volume growth
           £0.5m-£1.0m revenue                                                                                                             Continue to review all
                                           Invest in content and                                                                              options for less
                                                                                        Non-Core                             Low
                                           shows to drive great                                                             priority
                                                                                                                                             profitable shows
           Small                           customer experience               Onsite re-booking, sales commissions
Transformation delivered

Integration of FY18/19 acquisitions now complete
                                                     Reinvesting half of the synergies to drive future growth
                                                 Re-edit events to improve customer experience
                                                 Focus on key accounts
                            Integration          Grow international events to scale
                                                 Launch hosted buyers programme
                                                 Investigate new markets over the longer term
      Synergies
                                                 Sector expansion in Germany
                                                 Grow international events to scale in China
                                                 Launch hosted buyers programme
                                                 Investigate new markets over the longer term
                               Investment
                                  plans          Re-edit events and add new sectors
                                                 Visitor acquisition teams to target online and major chains
                                                                                                                                                  1
                                                 Focus on customer proposition between events

                                                 Operational integration with Africa Oil Week

           1 Moda was   an existing Hyve event                                                        Introduction to Hyve Group plc – May 2020   / 24
Transformation delivered

Targeted trajectory for FY18/19 acquisitions

                                                Investment
                                                   plans

Division                   Acquired events          FY19              FY20                                FY21
UK                         Ascential events   Inherited trajectory   Stabilise                            Grow

Global Brands              Ascential events   Inherited trajectory    Grow                                Grow

Global Brands              Mining Indaba      Inherited trajectory    Grow                                Grow

                                                                             Introduction to Hyve Group plc – May 2020   / 25
Transformation delivered

FY20 acquisitions
                                           ›      Acquisition of Shoptalk and Groceryshop: market leading events focused on e-commerce and food / grocery segments
       Acquisition of                      ›      Both shows in the US (Las Vegas), with opportunities for geo-cloned shows in Europe
       two leading,                        ›      Established and run by the founders of Money 20/20 and the management team is well known to Hyve
       high growth                         ›      2019E Revenue: $35.8m, CAGR 2016-2019E of 90%; EBITDA $12.2m(1)
          events                           ›      Strong visibility of revenues for FY20, with bookings for both Shoptalk and Groceryshop ahead of FY19 (2)
                                           ›      Key sponsors include Google, Facebook and Microsoft

                                           ›      Product-led acquisition, consistent with the Transformation and Growth (“TAG”) programme
        Compelling
                                           ›      Capitalising on high growth end markets
       strategic and                       ›      Market leading products with strong customer satisfaction, shown through strong NPS of +50 (Shoptalk) and +42 (Groceryshop)
          financial                        ›      Opportunity for Hyve to use best of breed model in hosted buyer and content creation
         rationale                         ›      Expected to be materially earnings enhancing in Hyve’s FY21(3) and ROIC(4) in excess of WACC within 3 years

                                           ›      Consideration and enterprise value of c. $145m (c. £108.8m(5)), equating to 11.9x 2019 adjusted EBITDA(1)
        Transaction                        ›      Funded through the refinanced debt facility and the placing of Hyve shares (10% of existing share capital)
         overview                          ›      Founders – Anil and Simran Aggarwal and certain vendors subscribed for $15m of Hyve shares
                                           ›      Leverage(6) expected to be below 2x by FY20 financial year end

           (1)   Estimated for year to 31 December 2019, although both events have been held and therefore revenue is an actual figure; unaudited based on diligenced management
                 account information. EBITDA has been prepared by the company on the basis of Shoptalk/Groceryshop management account information and validated by PwC. EBITDA
                 has been calculated to reflect a corporate rather than partnership structure
           (2)   Company-provided sales data as at December 2019                                                                                                                            Introduction to Hyve Group plc – May 2020   / 26
           (3)   Analysis has assumed an exchange rate of £1 : $1. 33
           (4)   ROIC defined as net operating profit after tax divided by total deal costs (being consideration paid, integration costs, fees, placing commissions and refinancing fees)
           (5)   Exchange rate of £1 : $1.33 as at 13 December 2019
Transformation delivered

Have delivered a strong portfolio of market-leading events
                                                                     Manage the portfolio
                                                                                                                               May 2017       May 2020
                                                                                                       No. of events                269          133            51%
                                                                                                       Revenue                  £134m3         £256m4           91%
                                                             89
                                                                                                       Revenue per event         £0.5m          £1.9m          280%

                                                                                                         Product-led acquisitions
                      269                                                                     65
                     events                                                                                        18

                                                                                                                                                     133
                                                                                                                                                    events

                  May 2017 1                                Closed                          Divested             Acquired 2                        May 2020

              1 Launch of TAG, May 2017
              2 Includes one new launch
              3 FY16 reported revenue
                                                                                                                              Introduction to Hyve Group plc – May 2020   / 27
              4 FY20 market consensus pre COVID-19 impact
Transformation delivered

A more balanced geographical footprint
    FY17 Revenue                                          Global
                                                                             FY19 Proforma Revenue1
                                                          Brands
                                                      12%
                                                                                   UK         20%
                                                                                                                                 Global
                                                                                                                        31%      Brands
                                                              16%     Asia
               Russia        47%                                                                              (incl. 12% US)

                                                                               Russia   25%
                                                            14%                                                       9%
                                                                   Central
                                                                   Asia                                       8%
                                                                                                                            Asia
                                                    11%                                             7%

                                                    ESE                                             ESE        Central Asia

           1   Including Shoptalk and Groceryshop                                                         Introduction to Hyve Group plc – May 2020   / 28
Transformation delivered

Returned the business to sustainable growth
                                    Revenue and headline operating profit

                                                                      TAG

                                          -11%                                       +18%           £221m
                                          CAGR                                       CAGR
                           £192m
                                   £175m                                                    £176m
                                                                             £153m
                                                  £136m       £134m

                            31%     35%             36%         29%           23%            22%      25%

                           FY13    FY14            FY15        FY16           FY17           FY18     FY19

                                                 Headline operating profit      Costs

                                                                                                    Introduction to Hyve Group plc – May 2020   / 29
Transformation delivered                                                    FY19
MosBuild
TAG improvements since FY16
› MosBuild moved to Crocus Expo,
  Russia’s largest venue, from 2019
› Much improved content
  programme with Perfect Home, VR                                           FY19
  design lab and MosBuild TV
› Volume up >50%
› Exhibitor NPS up from -7.0 to +8.3
› Visitor NPS up from +7.0 to +26.0

                                       Introduction to Hyve Group plc – May 2020   / 30
Transformation delivered

Breakbulk Europe
TAG improvements since FY16

› 37% more space sold                   FY16
› Visitor NPS improved from +8 to +28

› Revenue per exhibitor up 55%

› Overall revenue up 67%

                                                     Introduction
                                               Introduction       to Group
                                                            to Hyve  Hyve Group  plc – May 2019
                                                                           plc – December  2020   / 31
                                        FY19
Transformation delivered                                                                                 FY16*
Africa Oil Week
TAG improvements since FY17*

› Delegate NPS (FY18-19)** improved
  from +18 to +32
                                                                                                          FY20
› Paid delegates (FY17-19) up 33%

› Overall revenue (FY17-19) up 40%

           *Hyve took full ownership of AOW in May 2017, i.e. FY17
                                                                     Introduction to Hyve Group plc – May 2020   / 32
           **Delegate NPS figures first recorded in FY18
TAG financials

                 Introduction to Hyve Group plc – May 2020   / 33
TAG financials

One-off TAG programme investment
 Plan                FY17 £6-7m                             FY18 £8-10m                                         FY19 £4-6m

                                                                £20m
                                                                                                                                            FY20
Actual           FY17 £5.0m                       FY18 £7.0m                                  FY19 £4.2m                                  forecast
                                                                                                                                           £3.8m

                     One-off Costs Mix                                   Investment by Transformation Lever

                                                        Best Practice   Infrastructure &   Invest in Show   Performance Culture Capability & Talent
                     Capex   Opex - Exceptional                             Systems          Operations

                                                                                                   Introduction to Hyve Group plc – May 2020   / 34
TAG financials

Ahead of plan on all TAG investment targets
Target                                                        Original plan     Revised                         Status

Positive ROI                                                             FY20    FY19                 Delivered early

ROI > WACC                                                               FY21    FY20                           Ahead

Cash payback                                                             FY21    FY21                          Ahead1

             1   Original plan delivery expected H2 FY21; revised to H1 FY21              Introduction to Hyve Group plc – May 2020   / 35
TAG financials

“Create a scalable platform” targets ahead of plan
                                                                        1             Plan               Within 3 years (FY20)
          In-year net operating profit after tax (“NOPAT”)             Positive ROI
                                                                                      Update             Within 2 years (FY19)
                 Positive ROI
                  in FY 2019

                                                                        2             Plan               Within 4 years (FY21)
                                                                       ROI > WACC1
                                                                                      Update             Within 3 years (FY20)

                                                                       3              Plan               Within 4 years (FY21)
   FY17              FY18         FY19        FY20       FY21   FY22
                                                                       Cash Payback
                                   TAG plan     Update
                                                                                      Update            Within 3.5 years (FY21)

          1   Based on May 2017 WACC                                                         Introduction to Hyve Group plc – May 2020   / 36
TAG financials

Industry-leading growth after years of decline
                 £240m
                                                                                             £221m
                 £220m

                 £200m   £192m

                                 £175m                             £176m
Revenue          £180m

                 £160m                                   £153m

                 £140m
                                         £136m   £134m

                 £120m

                         FY13    FY14    FY15    FY16    FY17         FY18                    FY19

LFL growth / (decline)            -10%   -12%     -8%     +5%          +11%                    +7%

                                                                 Introduction to Hyve Group plc – May 2020   / 37
TAG financials

 Sustainable margins
                40%
                                                             TAG investment period
                                             36%
                                      35%
                35%
                                                                                      City consensus 1

                         31%

                30%                                  29%
                                                                                                                                             Reinvestment
Operating                                                                                      27%
profit                                                                               26%
margin
                                                                             25%
                25%
                                                            23%
                                                                   22%

                20%

                        FY13          FY14   FY15   FY16   FY17    FY18     FY19     FY20     FY21       FY22     FY23        FY24

            1   Pre COVID-19 impact                                                                        Introduction to Hyve Group plc – May 2020   / 38
TAG Financials

Net debt within guidance                                                                                                               Average cash
                 2.5
                                                                                                                                        conversion
                                                                     TAG corridor 1.5x – 2.0x                                            FY17-19
                                                                                                                                          > 100%
                                                                                2.0
                 2.0                                                                                          City consensus1

                                                                                                1.9

                 1.5

Net debt :                        1.4                                                                  1.4
EBITDA                                                   1.3

                 1.0
                                                                                                                               1.0

                 0.5

                               FY16                     FY17                    FY18            FY19   FY20                  FY21

            1   Pre Shoptalk/Groceryshop acquisitions and pre COVID-19 impact                                     Introduction to Hyve Group plc – May 2020   / 39
TAG financials

Operational delivery of TAG
                                                                               FY19    FY16                          Variance
                                                                           1
                             Average yield (per SQM) – TAG                     £252    £187                             +35%
                                                                           1
                 Yield       Average yield (per SQM) – Total                   £225    £183                             +23%
                             Yield growth versus inflation                     +3%     -13%                            +16pp

      Revenue                Onsite rebook                                     47%       0%                            >100%
      visibility             Forward bookings                                  62%2    53%3                             +9pp

       Sales                 Revenue per employee                              £177k   £95k                             +86%
performance                  Revenue per exhibitor
                                                                       4
                                                                               £7.4k   £6.0k                            +23%

            1 LFL event revenue / LFL sqm (excluding AOW conference)
            2 For FY20 at 1 Oct 2019
            3 For FY17 at 1 Oct 2016                                                   Introduction to Hyve Group plc – May 2020   / 40
            4 TAG events excluding AOW conference
TAG financials

On track to deliver our 3-year guidance pre COVID-19
                                     FY18   FY19                          FY201

Revenue growth

Margin growth

EPS growth

           1   Pre COVID-19 impact                 Introduction to Hyve Group plc – May 2020   / 41
FY19 results
(12 months to 30 September 2019)

                         Introduction to Hyve Group plc – May 2020   / 42
FY19 results

 FY19 highlights
                                   FY19      FY18
 Revenue                          £220.7m   £175.7m   LFL growth 7%
 Headline PBT                     £50.4m    £35.4m    LFL growth 16%
 Operating profit margin           25.3%     22.0%    Increase of 3.3pp
                        one-off   £4.2m     £7.0m
 TAG costs                                            Within guidance
                        ongoing   £8.0m     £7.5m
 Net debt                         £111.7m   £82.7m
FY19 results

Revenue bridge
                                                                    (£5.3m)
                                                                                   (£2.3m)
                                                                                                     £10.7m

                                             £47.9m

                        (£6.0m)

                                                                                                                               £220.7m

                                                          £m                             £m                   £m

         £175.7m                                                                 TRY     (1.4)   Russia       6.6
                                     Ascential/
                                                          62.5
                                     Mining Indaba                               RUB     (0.8)   AOW          1.2

                                     ITE Expo (Russia)/                          INR     (0.5)   Breakbulk    0.6
                                                        (14.6)
                                     Central Asia/Other                          Other   0.4     Other        2.3

               FY18   Net Biennial         Acquisitions           Launches &      FX Impact        Underlying                     FY19
                       & Timing            & Disposals           Cancellations                      Trading

                                                                                                 Introduction to Hyve Group plc – May 2020   / 44
FY19 results

Top 10 TAG events drove higher revenue growth

                                25%
                                                  Top 10 TAG

                                                  Rest of portfolio

        LFL growth                                             LFL growth                                Average yield                 Average yield
        Top 10 TAG                                             TOTAL                                     Top 10 TAG                    TOTAL
        13%                                                    7%                                        £309/sqm1                     £266/sqm1

               1   Total group revenue / total group sqm (excluding AOW and Mining Indaba conferences)                   Introduction to Hyve Group plc – May 2020   / 45
FY19 results

Headline PBT bridge
                                                                 (£0.5m)

                                                                                        (£4.2m)                      £4.7m
                                        £15.4m
                  (£0.4m)

                                                                                                                                                £50.4m
                                                                                                       £m
        £35.4m                                         £m
                                                                               Revenue Translational   (2.3)
                                Ascential/
                                                       17.6                    Cost Translational      1.5
                                Mining Indaba
                                                                               Translational           (0.8)
                                ITE Expo (Russia) /
                                                       (2.2)
                                Central Asia / Other                           Transactional (B/S)     (3.4)

          FY18   Net Biennial         Acquisitions              Launches &             FX Impact                  Underlying                     FY19
                  & Timing            & Disposals              Cancellations                                       Trading

                                                                                                               Introduction to Hyve Group plc – May 2020   / 46
FY19 results

Financial summary

               Strong LFL revenue
                                                           Step change towards
               growth; Top 10 TAG
                                                           sustainable operating
               events double-digit
                                                                  margins
                    growth
                                        Profit growth
                                     significantly above                              Excellent FY20
                                       revenue growth                                revenue visibility

                                                                                   Introduction to Hyve Group plc – May 2020   / 47
Appendices

             Introduction to Hyve Group plc – May 2020   / 48
Appendices

Revenue by sector
         Build & Interiors

         Retail                                              FY19 proforma1                                   FY17
         Food & Packaging
                                                                  4% 3%                                     6%
         E-commerce                                          4%             15%                     6%
         Education Technology
                                                        4%                                                                         28%
                                                                                           8%
         Fashion                                   6%
                                                                                   13%
         Manufacturing Industrial Technology
                                                  7%                                     10%
         Transport & Logistics

         Connect                                  7%                                      3%
                                                                                  12%
         Energy                                                                                7%                                  16%
                                                        7%
         Travel & Tourism
                                                                  7%      11%                            9%          7%
         Beauty & Healthcare

         Advanced Technologies

         1 Including   Shoptalk and Groceryshop                                                     Introduction to Hyve Group plc – May 2020   / 49
Appendices

Top 10 events by revenue
   December 2019                                                   May 2017 (launch of TAG)
   Event name         Region                                       Event name         Region
   Shoptalk           US                                           MosBuild           Russia
   Spring Fair        UK                                           WorldFood Moscow   Russia
   MosBuild           Russia                                       MITT               Russia                                        35%
                                                          45%
   BETT (London)      Global Brands                                Aquatherm Moscow   Russia
   WorldFood Moscow   Russia                                       TurkeyBuild        E/S Europe
   Autumn Fair        UK                                           Acetech Mumbai     Asia
   CWIEME Berlin      Global Brands                                MIOGE              Russia
   Mining Indaba      Global Brands                                RosUpack           Russia
                                      Top 10   Rest of portfolio                                             Top 10     Rest of portfolio
   Groceryshop        US                                           YugAgro            Russia
   MITT               Russia                                       Breakbulk Europe   Global Brands

                                                                                               Introduction to Hyve Group plc – May 2020    / 50
Appendices

Cost analysis                                                                                                                                          Total costs in FY19
                                                                                                                                      (excluding interest and tax, including depreciation)

                                                                                                                                                              £174m

                  Total cost base                                                Cost base by flexibility                                              Cost by type

                                      20%                                             30%                     25%
                                   overheads                                     variable costs            fixed costs                              40%                   35%
                                                                                                                                                 other costs               staff
                   80%
                   cost of
                  running                                                                           45%
                   events                                                                           semi-
                                                                                                   variable
                                                                                                    costs*
                                                                                                                                                               25%
                                                                                                                                                               venue

             *Semi-variable costs include costs that over time could be flexed to changes in revenue but wouldn’t in the short term
                                                                                                                                               Introduction to Hyve Group plc – May 2020   / 51
              (e.g. venues with minimum contractual commitment)
Appendices

Current debt profile
Refinance – December 2019
 Facility
                   Committed            Drawn         Repayments                                       Interest                                        Existing Financial Covenants
 £m
                                                      £17.5 November 20
                                                      £17.5 November 21
 Term                  100               100          £20.0 November 22                                                                                ›   Leverage Ratio of net debt to adjusted EBITDA ≤3x
                                                      £22.5 November 23                                LIBOR + Margin (1.90-2.90%)                     ›   Interest Cover Ratio of EBITDA to net finance charges ≥4x
                                                      £22.5 December 23                                determined by the Leverage Ratio                ›   Tested every quarter from 30 June 2020
                                                      Amounts can be repaid, redrawn or
 Revolver              150               150          rolled for periods of 1, 3, or 6 months
                                                      up to maturity

 Total                 250               250          Maturity : December 2023

Waiver – May 2020
 Waiver detail
 › Suspends the existing financial covenant tests for all periods up to and including March 2022
 › Defers the November 2020 and November 2021 repayments to maturity (December 2023)

 Waiver conditions
 › Replaces existing financial covenants with a minimum liquidity covenant: combined cash and undrawn facilities must be at least £30m or £40m (depending on the month), tested monthly
 › Existing financial covenants will still be reported every quarter but not tested
 › Interest margin increased to 3.40% but original ratchet levels still apply based on above financial covenant reporting every quarter
 › Insurance and disposal proceeds to be applied to any deferred repayments providing such deferred repayments are overdue from the original repayment date (maximum £35m)
 › Certain acquisition, disposal and dividend restrictions

 Normalisation
 › The Group may at any time in its sole discretion nominate to revert to the original terms by reinstating the existing financial covenant testing and repayment dates, and immediately settling any deferred repayments that are overdue from
    the original repayment date
 › All waiver conditions will be cancelled once normalisation occurs

                                                                                                                                                                                     Introduction to Hyve Group plc – May 2020                    / 52
Appendices

Consensus forecast pre COVID-191
                                                                 Consensus   Minimum                          Maximum
 2020
Turnover (£m)                                                      256.2      255.1                             257.2
Headline profit before tax (£m)                                    61.6       61.3                               62.1
Headline diluted EPS (pence)                                        5.5        5.4                                5.5
Net debt (£m)                                                      144.3      142.6                             147.0
2021
Turnover (£m)                                                      272.4      271.0                             274.9
Headline profit before tax (£m)                                    69.7       68.8                               71.3
Headline diluted EPS (pence)                                        6.1        6.0                                6.3
Net debt (£m)                                                      120.4      115.8                             124.2

         1 Based   on analyst forecast reports to 9 March 2020                       Introduction to Hyve Group plc – May 2020   / 53
Appendices

Shareholder structure as at 24 April 2020
                                         Country of Shareholder   % of Total Shares                No. of Shares (millions)
 RWC Partners                                     UK                   12.5                                  102.3
 BlackRock                                      UK, USA                 7.9                                   64.7
 Brandes Investment Partners                      USA                   7.9                                   64.5
 Fidelity Management & Research                 UK, USA                 7.0                                   56.9
 Amiral Gestion                                 France                  5.6                                   45.8
 Bestinver Asset Management                      Spain                  5.0                                   40.6
 Legal & General Investment Management            UK                    4.2                                   34.3
 Invesco                                        Canada                  4.1                                   33.5
 JO Hambro Capital Management                     UK                    3.6                                   28.8
 Franklin Templeton                               USA                   3.2                                   26.1
 Directors                                                              0.3                                    2.8
 Other institutions and individuals                                    38.7                                  315.5

 Total Shares in Issue                                                  100                                  815.8

                                                                                      Introduction to Hyve Group plc – May 2020   / 54
Appendices

 TAG milestones
                              FY 2017                                             FY 2018                                                                    FY 2019
  Create ‘best
  practice’ functions                            Design of the ‘Hyve way’                                                      Implementation of the ‘Hyve way’
  & teams
                                             Setup of Customer Success team               Implementation of value-based pricing methods
  Invest                                                                                                      Roll out of event ‘blueprint’
  in event
  operations                  Setup of dedicated Content team

                                                                                                                New event content deployed

                                      1st new hardware roll out                                                                                Launch of ‘one view’ back office systems
  Build a ‘fit for purpose’
  IT infrastructure                                                                                                   Launch of integrated sales and marketing systems
   & systems                             Systems design & development                                                         Systems deployed in phased waves

                               Review of performance structure
  Drive a
  performance                                           Development of Sales leadership
  culture
                                                                     Standardisation of Performance Management

  Build capability                      Recruitment of key organisational roles
  & talent                                                                                              Roll out of dedicated specific training programmes

                                                                                                                                              Introduction to Hyve Group plc – May 2020   / 55
Appendices

Product-led acquisitions
     Example Screening Criteria

                   Size                          M&A
             Distinct Customer                   funnel
             Value Proposition
    Structurally Attractive Market
           for Exhibitions
                                                     Phase 1                Phase 2              Phase 3                  Phase 4
       High Growth Underlying                        Quick screening        Thorough analysis    Due diligence            Transaction
               Market
                                     Objective       “be effective”         “identify pearls”    “don’t miss risk”        “fair deal”
       Organic Revenue Growth
          and Profit Margin          Activity        Screen maximum #       Assessment of        Strategic / market       Final price
         International Roll Out                      of shows...            concrete potential   DD                       negotiation
               Potential                             ... employing set of   for Hyve             Financial DD             Deal structuring
                                                     clear criteria                              Synergy estimate         (e.g. earnout)
                   ROIC
                                                                                                 Integration planning
              EPS Accretion

                                                                                                          Introduction to Hyve Group plc – May 2020   / 56
Appendices

Source of acquisitions
Acquisitions likely to come from the following sources:

                                                                                  Bolt-on market-
                                                      Owner-operated
                                                                               leading events which
                                                    founders looking for
                    Non-core assets                                           will accelerate our geo-
                                                    someone to take the
                  (e.g. Mining Indaba                                               clone strategy
                                                 business to the next level
                  acquisition by Hyve)                                             (e.g. Bett Brazil
                                  £143m1         (e.g. Shoptalk acquisition
                                                                                    acquisition by
                                 (of £158.6m2)            by Hyve)
                                   = 90% of                                      Ascential Events1)
                                 total revenue

         1 Now   owned by Hyve                                                     Introduction to Hyve Group plc – May 2020   / 57
Appendices

 Ascential deal strategic rationale

      Product-led                                                                                           Strong financial
                                                         Further value
portfolio with global and                                                                                 rationale; earnings
                                                       through synergies
 market leading brands                                                                                    enhancing in 2019

                                        £147m1                                       £143m1
                       Significant potential
                                       (of £220.7m2)
                                                                           A more balanced
                                                                                     (of £230.7m)
                      under our management
                                         = 67% of          £200m3          portfolio for
                                                                                  = 62%      the
                                                                                         of consensus
                         £143m  1      total revenue       (of £213.6m)
                          as Core2 events                    = 94% of
                                                                            enlarged group
                            (of £158.6m )
                              = 90% of                      consensus
                            total revenue

                                                                                            Introduction to Hyve Group plc – May 2020   / 58
Appendices

Mining Indaba acquisition
› Met the TAG acquisition criteria as the
  must-attend event in the African mining
  industry

› Strong strategic rationale and
  complementary to Africa Oil Week
› AOW and MI teams now merged to drive
  synergies
› Implementation of Hyve best practice will
  drive growth from FY20 onwards

                                              Introduction to Hyve Group plc – May 2020   / 59
Appendices

Shoptalk and Groceryshop acquisitions
Shoptalk has become the leading US e-commerce event and fast growing Groceryshop is already the leading grocery e-commerce event.
Established and managed by Anil and Simran Aggarwal, founders of Money 20/20.
  Shoptalk revenue, 2016-2019E ($m) (Dec-YE)(1)                                                                      Shoptalk profile
                                                                                                                        Shoptalk
                                                                                                   CAGR
        Shoptalk                                                                                (2016-2019)             › Launched in May 2016 in the US
        Groceryshop                                                                $35.8m                               › Focus on the growing e-commerce segment that is disrupting the $4
                                                                                                                            trillion(3) US retail industry – creating a need for content-rich, change-
        Shoptalk Europe                       +90%                                                  80%                     focussed events
                                                                                   $8.3m
                                                                                                 (2018-19)              › Proven scope for geo-clones following successful proof of concept through
                                                           $26.3m                                                           Shoptalk Europe in 2017
                                                           $4.6m                                                        Groceryshop
                                                                                   $27.5m                               › Launched in October 2018 in the US
                                  $15.6m                                                                                › Aimed at the $1tn(3) US food and grocery segment and its specific
                                                           $21.7m                                    74%                    characteristics (fresh supply chain, regulatory, etc.)
                                   $4.1m
                                                                                                                        Shoptalk focuses on developing innovative, content-led products supported by
                                                                                                                        bespoke technology and workflows developed to support its Hosted Meetings.
         $5.2m                    $11.5m
         $5.2m                                                                                              Selected key sponsors/delegates:                        Selected hosted retailers and brands:

         2016                       2017                    2018                    2019E
                                                               Adj. EBITDA:       $12.2m(2)

             (1) Estimated for year to 31 December 2019, although both events have been held and therefore revenue is an actual figure; unaudited based
                 on diligenced management account information
             (2) EBITDA has been prepared by the company on the basis of Shoptalk management account information and validated by PwC. EBITDA has         Introduction to Hyve Group plc – May 2020   / 60
                 been calculated to reflect a corporate rather than partnership structure
             (3) Source: Globaldata, estimated figures for 2019
Appendices

Spotlight on Shoptalk US
Shoptalk US has grown to its current scale based on three revenue streams: attendee revenue, sponsorship/exhibiting and hosted meetings

     $27.5m                                                    ›    c. 8,500 people attended Shoptalk 2019, of which 47% are paying attendees
                                                               ›    64% were Director-level or above (mostly split across retailers, brands and tech companies)
                                                               ›    Attendees attracted by the strength of the content programme and networking opportunities
                  Attendee
                  revenue                                      ›    Attendee NPS has increased from +30 in 2018 to +50 in 2019

                                                               ›    Shoptalk has developed an industry-leading hosted meetings offering, underpinned by highly automated
                                                                    technology
                  Hosted
                  meetings                                     ›    In 2019 c. 450 companies executed c. 8,000 meetings with c. 1,500 individuals from 500 hosted retailers and brands
                                                               ›    Management consider hosted meetings to be an area for development at the wider Hyve group providing the
                                                                    potential for further revenue opportunities across the group

                  Sponsorship /                                ›    c. 615 companies sponsor / exhibit(1) at Shoptalk – main objectives are to network, generate sales & leads and
                  exhibiting                                        showcase products
                                                               ›    Shoptalk takes a consultative approach to selling in order to best meet sponsors’ objectives – it is not just selling
                                                                    exhibition space
                                                               ›    Many also pay for hosted meetings and buy additional tickets for their teams to attend
      2019E(2)

         (1) Note: many companies do not exhibit but take a combination of hosted meetings and other sponsorship opportunities
         (2) Estimated for year to 31 December 2019, although both events have been held and therefore revenue is an actual figure; unaudited based on   Introduction to Hyve Group plc – May 2020   / 61
             diligenced management account information. EBITDA has been prepared by the company on the basis of Shoptalk management account
             information and validated by PwC. EBITDA has been calculated to reflect a corporate rather than partnership structure
Appendices

Addition of industry-leading capabilities from Shoptalk,
building on the TAG programme
Opportunity for Hyve to use the best of Shoptalk’s model

       Hosted meetings technology                                        Content                                  Community Development

›    Bespoke technology and workflows developed
     for Shoptalk to support Hosted Meetings         ›   Content team, with deep retail industry           ›   Community Development team engages the
›    Opportunity to use technology across other          knowledge and contacts, and original content          Retailers & Brands community to support the
     Hyve events                                         capabilities                                          overall proposition and feed the Hosted
›    Hyve acquired a licence as part of the          ›   Opportunity for Hyve to use best of breed model       Meetings programme
     consideration, in perpetuity for the software       in hosted buyer and content creation              ›   Opportunity for Hyve to learn to improve its
     with the right to use on other events                                                                     key buyer acquisition capabilities

                                                                                                                  Introduction to Hyve Group plc – May 2020   / 62
Appendices

Shoptalk hosted meetings
Shoptalk has developed an industry-leading hosted meetings offering, underpinned by highly automated technology

      Hosted Retailers and Brands                              Shoptalk Hosted Meetings Programme                                               Sponsors

  ›    >1,500 people from c. 500 retailer and                                                                               ›     >450 companies purchase meetings
       brand companies (Shoptalk)                                                                                                 (typically in blocks of 10)
  ›    Each person receives a free ticket and a                                                                             ›     Sponsors are usually technology vendors
       $750 travel stipend, in return for agreeing to                                                                             looking for lead generation
       up to 8 x 15 minute meetings with sponsors                                                                           ›     Sponsors select Retailers and Brands they
                                                        ›   c. 8,000 15-minute hosted meetings at Shoptalk 2019, in 4 x 1
  ›    Retailers and Brands select sponsors they                                                                                  are interested in, to prevent mismatches
                                                            hour slots
       are interested in, to prevent mismatches                                                                                   (double opt-in)
                                                        ›   Sponsors and retailers and Brands are matched using Shoptalk
       (double opt-in)                                      proprietary technology & workflows – this automates many
                                                            challenging and labour intensive tasks
                                                        ›   Shoptalk provides meeting space, support & guidance, onsite
                                                            logistics

                                                                                                                                Introduction to Hyve Group plc – May 2020   / 63
Appendices

Shoptalk & Groceryshop help accelerate an
omni-channel strategy
                               ›   Omni-channel combines face-to-face events with online content, networking and buying to provide
                                   customers with multiple touch points throughout the year

                               ›   Shoptalk Virtual launched last month with three formats: Virtual TableTalks, Conferences and Meetings
        Launched April 2020

                               ›   Shoptalk TableTalk
                                   Held over 50 events with over 200 participants from leading global consumer businesses
                                   Very positive feedback:
                                     o   “It was a great networking experience, and nice to talk to others while going through all this”
         Launch late spring
                                     o   “It was great to have real conversation instead of looking at a deck with data for an hour”
                                     o   “It gave great insights into how others are handling the situation”

                               ›   Shoptalk Virtual – over 10,000 people expressed interest from companies including Amazon, Best Buy,
                                   Facebook, Google, IBM, Infosys, Microsoft, Pinterest and Visa
        Launch later in 2020

                                                                                                                   Introduction to Hyve Group plc – May 2020   / 64
You can also read