Singapore Q4 2018 Cautious optimism amid potential economic headwinds for local economy - Edmund Tie

Page created by Bryan Carr
 
CONTINUE READING
Singapore Q4 2018 Cautious optimism amid potential economic headwinds for local economy - Edmund Tie
Real
                                               Estate
                                               Times

RESEARCH                             February 2019

Singapore Q4 2018
Cautious optimism amid potential economic
headwinds for local economy

Edmund Tie & Company Research                  www.etcsea.com
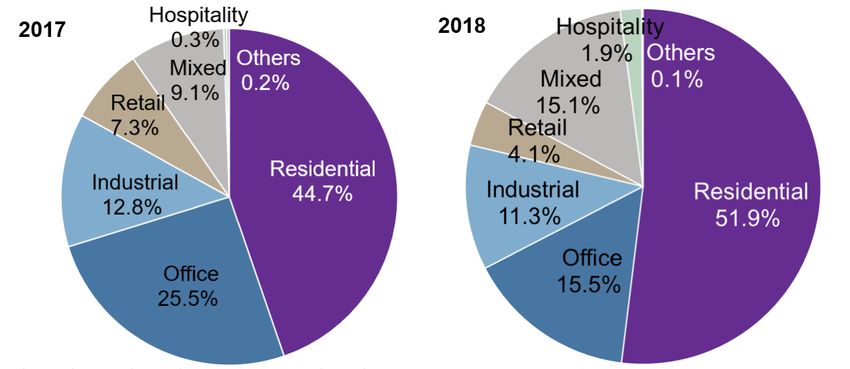
Singapore Q4 2018 Cautious optimism amid potential economic headwinds for local economy - Edmund Tie
Q4 2018 snapshot
According to advance estimates, Singapore’s economy grew by 3.3 per cent in 2018, easing from the
3.6 per cent in 2017. In 2018, the growth of the manufacturing sector moderated from 10.1 to 7.5 per
cent; the services sector remained flat at 2.8 per cent; and the construction sector contracted 3.4
per cent, albeit at a slower rate of -8.4 per cent in 2017. As such, the services sector is expected to
contribute a larger proportion of growth to Singapore’s economy in 2019.

                                                      Due to the lack of big-ticket investment deals,
       Investment sales largely fell to               investment sales declined by 6.2 per cent year-

            30.2bn
                                                      on-year (y-o-y). Investment sales in the residential

       $
                                                      sector still comprised the largest proportion at
                                                      51.9 per cent. However, residential transactions
                                                      fell significantly in H2 2018 with the introduction of
         in 2018 from $32.2bn in 2017                 cooling measures in July 2018.

Office                                                Industrial
Average monthly gross rents in the CBD                Average monthly gross rents of first- and upper-
increased by 6.8 per cent to $9.50 per square         storey factory spaces declined by 0.5 per
feet (psf) in 2018. The monthly gross rents of        cent to $1.80 psf and $1.35 psf respectively
offices in Marina Bay increased by 8.7 per cent       in 2018. The average gross rents of business
to $11.50 psf. Gross rents of Grade A buildings       parks increased by 2.1 per cent to $4.65 psf per
in Raffles Place also trended upwards by 4.2 per      month in 2018.
cent to $10.00 psf per month in 2018.

Retail                                                Residential
Average monthly gross rents of first-storey           Due to the moderated demand for homes in
space in Orchard/Scotts Road increased by             H2 2018 that is largely attributed to the cooling
1.5 per cent to $37.80 psf in 2018. Additionally,     measures, total private home sales in 2018
monthly gross rents of first-storey retail space in   fell by 10.6 per cent y-o-y to 21,657 units.
the suburban areas grew by 1.0 per cent to $30.80     Despite the cooling measures in H2 2018, average
psf in 2018. On the other hand, first-storey gross    resale prices for non-landed luxury and freehold
rents in the other city areas remained unchanged      condominiums in prime districts increased by 8.6
at $19.80 psf per month in 2018.                      and 7.8 per cent respectively in 2018. Average
                                                      monthly gross rents for non-landed homes in
                                                      prime and suburban areas stabilised, increasing
                                                      by up to 2.0 per cent in 2018.

E D M U N D T I E & C O M PA N Y R E S E A R C H                                                    1
The economy
Key highlights                                                                                                          Figure 2: PMI and NODX
                                                                                                                        54                                                                                                                            40%
• Based on advance estimates1, Singapore’s
  economy grew by 3.3 per cent in 2018 vis-à-                                                                           52                                                                                                                            20%
  vis 3.6 per cent in 2017.
                                                                                                                        50                                                                                                                            0%
• Most industries within the services sector
  anticipate more favourable or expansionary                                                                            48                                                                                                                            -20%
  business conditions from October 2018 to
  March 2019, except for real estate firms.                                                                             46                                                                                                                            -40%

                                                                                                                                                                                                                Aug-18
                                                                                                                                                                                                                         Sep-18
                                                                                                                                                          Feb-18
                                                                                                                                                                   Mar-18
                                                                                                                                                 Jan-18

                                                                                                                                                                                              Jun-18
                                                                                                                                                                            Apr-18

                                                                                                                                                                                                                                  Oct-18
                                                                                                                                                                                                       Jul-18
                                                                                                                                                                                     May-18
                                                                                                                               Nov-17
                                                                                                                                        Dec-17

                                                                                                                                                                                                                                           Nov-18
Market commentary
                                                                                                                                        PMI (LHS)                                    NODX growth (y-o-y) (RHS)
Based on advance estimates, Singapore’s                                                                                 Note: PMI and NODX for December 2018 were not released as at time of
                                                                                                                        publication.
economy grew by 3.3 per cent in 2018, lower
                                                                                                                          Source: Enterparise Singapore, SIPMM, Edmund Tie & Company Research
than the 3.6 per cent growth in 2017. In addition,
the expansion was 2.2 per cent y-o-y in Q4 2018,
compared to the growth of 2.3 per cent in Q3
2018 (Figure 1).                                                                                                        Figure 3: Business sentiments by sector October 2018 –
                                                                                                                        March 2019
Figure 1: GDP growth                                                                                                    Recreation, Community & Personal
                                                                                                                                     Services                                                                            +5
                                                                                                                 S$bn   Business Services (Excluding Real
                                                                                                                                                                                                                     +2
    5%                                                                                                            112                 Estate)
                                                                                                                  110                                     Real Estate                 -18
    4%
                                                                                                                  108                     Financial & Insurance                                                      +1
    3%                                                                                                            106
                                                                                                                  104        Information & Communications                                                                         +13
    2%
                                                                                                                  102
    1%                                                                                                            100            Food & Beverage Services                                                                                              +36
                                                                                                                  98                               Accommodation                                                                      +17
    0%
                                                                                                                  96
-1%                                                                                                               94                        Transport & Storage                                                          +3
                                                         Q1 17
         Q3 15
                 Q4 15
                         Q1 16
                                 Q2 16
                                         Q3 16
                                                 Q4 16

                                                                 Q2 17
                                                                         Q3 17
                                                                                 Q4 17
                                                                                         Q1 18
                                                                                                 Q2 18
                                                                                                         Q3 18

                                                                                                                                                          Retail Trade                                                                              +29
                                                                                                                                                 Wholesale Trade                                                     +2
                             GDP growth (y-o-y) (LHS)                                                      *
                             GDP growth (q-o-q) (LHS)                                                                                                                        -30 -20 -10                         0        10         20          30       40
                             GDP at 2010 prices (SA) (RHS)                                                                        Source: Singapore Department of Statistics, Edmund Tie & Company
                                            Source: MTI, Edmund Tie & Company Research                                                                                                     Research

1
    The advance GDP estimates for Q4 2018 are computed largely from data in the first two months of the quarter (i.e.
    October and November 2018). They are intended as an early indication of GDP growth in the quarter and are subject to
    revision when more comprehensive data becomes available.

E D M U N D T I E & C O M PA N Y R E S E A R C H                                                                                                                                                                                             2
Table 1: GDP at 2010 prices                                    The slowdown of Singapore’s economy in 2018
Advance estimates of 2018 GDP growth by sector:
                                                               was also reflected in the Purchasing Managers’
                        2017         2018          Change      Index (PMI) and the non-oil domestic exports
                                                               (NODX).
 Manufacturing         10.1%         7.5%
                                                               • The PMI declined to 51.1 in December 2018
 Construction          -8.4%        -3.4%          Improving     (Figure 2), the lowest since July 2017. Although
                                                                 a reading above 50-point indicates that the
 Services              2.8%         2.8%
                                                                 manufacturing sector is generally expanding,
 Overall               3.6%         3.3%                         the trend suggests a slowing expansionary
                                                                 rate. Furthermore, the electronics sector
                                                                 PMI fell below 50 (i.e. 49.9) in November and
• The manufacturing sector grew at a slower                      again marginally to 49.8 in December 2018,
  pace from 10.1 per cent in 2017 to 7.5 per                     recording two consecutive months of decline
  cent in 2018. This was largely driven by output                and the lowest reading since July 2016.
  expansion of the biomedical manufacturing                    • According to Enterprise Singapore (ES), the
  and electronics clusters outweighing the                       NODX fell by 2.6 per cent y-o-y in November
  output decline in the precision engineering                    2018 from a high base last year. This was
  cluster.                                                       a decline compared to 8.2 per cent y-o-y
• Growth of the services sector remained flat                    increase in October 2018. The decline in non-
  at 2.8 per cent in 2018 with growth mainly                     electronics outweighed growth in electronics
  supported by the finance and insurance,                        NODX. Consequently, ES is forecasting a
  business services and information, and                         NODX growth of 0.0 to 2.0 per cent in 2019
  communication sectors.                                         versus 5.5 to 6.0 per cent for 2018.
• The construction sector continued to
  contract, albeit at a slower rate primarily due              Outlook
  to weakness in public sector construction                    Based on the various growth forecasts of
  activities, although this is forecasted to                   Singapore’s GDP, PMI, NODX and business
  stabilise in 2019.                                           sentiments (services sector – Figure 3), the
• The Ministry of Trade and Industry (MTI)                     overall economic growth is expected to ease in
  forecast of GDP in 2019 has been revised                     2019 amid current economic headwinds such as
  downwards to 1.5 to 3.5 per cent vis-à-vis 3.0               the ongoing China-US trade war, slowing of the
  to 3.5 per cent in 2018.                                     global and Chinese economies, rising interest
                                                               rates and tightening of global financial conditions.

E D M U N D T I E & C O M PA N Y R E S E A R C H                                                           3
Investment sales
Key highlights                                                                   Market commentary
• After a record of $32.2bn in 2017’s investment                                 Investment sales in 2018 declined 6.2 per cent
  sales, the total value of investment sales declined                            y-o-y to $30.2bn, down from the peak of $32.2bn
  by 6.2 per cent y-o-y to $30.2bn in 2018.                                      in 2017 (Figure 4).
• Residential investment sales accounted for
  51.9 per cent of total investment sales at                                     Office
  $15.7bn and increased by 8.9 per cent y-o-y.                                   • Office investment sales in 2018 accounted
  However, the residential investment sales                                        for some 15.5 per cent or $4.7bn of total
  during H2 2018 fell drastically to $2.4bn due to                                 investment sales (Figure 5). This was a
  the cooling measures introduced in July 2018.                                    decrease of 43.1 per cent y-o-y.
• Among the various sectors, investment sales                                    • In H2 2018, some $3.6bn of transactions took
  of retail, office and industrial sectors recorded                                place compared to $1.1bn in H1 2018.
  y-o-y decreases.                                                               • Most of the significant transactions (>$250m)
                                                                                   were from foreign institutional investors.

Figure 4: Investment sales ($m)                                                  Figure 5: Proportion of investment sales by segment in
                                                                                 2017 and 2018
35,000
30,000
25,000
20,000
15,000
10,000
 5,000
      0
                                                                                                          Source: Edmund Tie & Company Research
          2009

                 2010

                        2011

                               2012

                                      2013

                                             2014

                                                     2015

                                                            2016

                                                                   2017

                                                                          2018

                         Q1      Q2      Q3         Q4
                                 Source: Edmund Tie & Company Research

E D M U N D T I E & C O M PA N Y R E S E A R C H                                                                                     4
Table 2: Key significant private investment deals in 2018

                                                   Tenure
  2018      Development name/address                                    Purchase price     Purchaser
                                                   (remaining tenure)

 Residential sites excluding GLS sites (>$500m)

                                                                        $980m              GuocoLand and
   Q1       Pacific Mansion                        Freehold
                                                                        ($1,987 psf ppr)   Hong Leong Investments
                                                                        $840.9m
   Q1       Park West                              99 years                                SingHaiyi Group
                                                                        ($850 psf ppr)
                                                                        $728m
   Q1       Pearl Bank Apartments                  99 years                                CapitaLand
                                                                        ($1,515 psf ppr)
                                                                        $610m
   Q1       Goodluck Garden                        Freehold                                Qingjian Realty
                                                                        ($1,110 psf ppr)
                                                                        $530m              Hoi Hup Realty and
   Q1       Brookvale Park                         999 years
                                                                        ($932 psf ppr)     Sunway Developments
                                                                        $906.9m
   Q2       Tulip Garden                           Freehold                                Yanlord Land and MCL Land
                                                                        ($1,790 psf ppr)

 Office (>$500m)

                                                   99 years             $516m
   Q2       Twenty Anson                                                                   AEW
                                                   (87 years)           ($2,503 psf)
                                                   99 years             $908m              OUE Commercial REIT
   Q3       OUE Downtown
                                                   (48 years)           ($1,713 psf)       (related party transaction)
                                                   99 years             $680m
   Q4       78 Shenton Way                                                                 PGIM Real Estate
                                                   (63 years)           ($1,900 psf)
            Ocean Financial Centre                 99 years             $537.3m
   Q4                                                                                      Allianz Real Estate
            (20.0 per cent stake)                  (91 years)           ($3,061 psf)
                                                   99 years             $710m
   Q4       Robinson 77                                                                    Gaw Capital Partners
                                                   (74 years)           ($2,300 psf)

 Industrial (>$200m)

            13 Sunview Way                         30 years             $295.1m
   Q2                                                                                      Keppel DC REIT
            (99.0 per cent stake)                  (23 years)           ($3,017 psf)
                                                   30+30 years          $585m              Logos
   Q3       20 Tuas South Avenue 14
                                                   (19+30 years)        ($450 psf)         (Sale and leaseback)
                                                   30+24 years          $255.3m
   Q3       6 Fishery Port Road                                                            Mapletree Logistics Trust
                                                   (22+24 years)        ($386 psf)
                                                   99 years             $262.2m
   Q4       18 Tai Seng Street                                                             Mapletree Industrial Trust
                                                   (79 years)           ($700 psf)

 Retail (>$200m)

                                                   999 years            $248m              Lian Beng Group and
   Q2       Sembawang Shopping Centre
                                                   (NA)                 ($1,727 psf)       Apricot Capital
            Westgate                               99 years             $789.6m            CapitaLand Mall Trust
   Q3
            (70.0 per cent stake)                  (91 years)           ($2,746 psf)       (related party transaction)

                                                                                           Source: Edmund Tie & Company Research

E D M U N D T I E & C O M PA N Y R E S E A R C H                                                                      5
Residential
As the residential market moderates                    • H1 2018 got off to a good start with some 40
                                                         residential collective sales settling for a total of
with the cooling measures and                            $10.4bn. In contrast, the number of collective
revised planning guidelines in place,                    sales came to almost a standstill in H2 2018
interests may shift to the non-                          with just six collective sales totalling $685m.
                                                         This was due to the implementation of cooling
residential market such as the office
                                                         measures on 6 July 2018, which imposes higher
sector, which is likely to outperform.                   initial costs and upfront payments for both
                                                         developers and buyers of residential properties.
                                                       • The most significant collective sale transaction
Industrial                                               in 2018 was the Pacific Mansion site, which
• Industrial investment sales in 2018 accounted          was sold for $980m at $1,987 psf ppr (Table
  for about 11.3 per cent or $3.4bn of total             2). This sale was the second highest on record
  investment sales. This shows a decrease of             and was only surpassed by the sale of Farrer
  16.9 per cent y-o-y.                                   Court for $1.34bn in 2007.
• In H2 2018, some $2.3bn of transactions took         • Whilst residential investment sales accounted
  place compared to $1.1bn in H1 2018.                   for the largest proportion of 51.9 per cent
• Most of the significant transactions (>$250m)          or $15.7bn of total investment sales in 2018
  were from local and foreign institutional              and grew 8.9 per cent y-o-y, this trend is
  investors.                                             not expected to continue in 2019 due to the
                                                         current cooling measures.
Retail
• Retail investment sales in 2018 accounted for
                                                       Outlook
  some 4.1 per cent or $1.2bn of total investment
  sales. This was a decrease of 47.7 per cent y-o-y.   Prospects for the investment market remain
• In 2018, there were only two significant             relatively stable to positive. Investors are
  transactions totalling $1.04bn, which were           expected to shift focus to income-generating
  from local institutional investors.                  assets especially the office sector which has
                                                       performed well in 2018 compared to the other
                                                       asset classes. Consequently, collective sales
                                                       will likely shift from residential to non-residential,
                                                       for instance, a few mixed used development
                                                       sites have been acquired and converted to
                                                       hospitality uses.

E D M U N D T I E & C O M PA N Y R E S E A R C H                                                     6
Office
Key highlights                                      Figure 6: Office rental indices
                                                    (Q1 2011=100)
• In 2018, the average CBD gross rents increased    120

  by 6.8 per cent to $9.50 psf per month.           110
                                                    100
• Average monthly gross rents in Marina Bay          90
  (Premium) improved by 8.7 per cent to $11.50       80
  psf in 2018.                                       70

                                                          Q4 2009

                                                                         Q4 2010

                                                                                         Q4 2011

                                                                                                         Q4 2012

                                                                                                                        Q4 2013

                                                                                                                                      Q4 2014

                                                                                                                                                    Q4 2015

                                                                                                                                                               Q4 2016

                                                                                                                                                                         Q4 2017

                                                                                                                                                                                   Q4 2018
• Average monthly gross rents for Grade A
  buildings in Raffles Place rose by 4.2 per cent
                                                      Marina Bay
  to $10.00 psf in 2018.
                                                      Raffles Place (Grade A)
• Average gross rents in Shenton Way/Robinson         Shenton Way/Robinson Rd/Cecil St/Anson Road/Tanjong Pagar (Grade B)

  Rd/Cecil St/Anson Road/Tanjong Pagar                                                                                  Source: Edmund Tie & Company Research
  (Grade B) increased by 7.7 per cent to $7.00
  psf per month in 2018.                            Figure 7: Office occupancy rates
                                                    100%
                                                     95%
Co-working space operators will                      90%

continue to expand their footprint                   85%
                                                     80%
and market share in the CBD.                         75%
                                                     70%
                                                               Q4 2016

                                                                               Q1 2017

                                                                                                   Q2 2017

                                                                                                                   Q3 2017

                                                                                                                                  Q4 2017

                                                                                                                                                 Q1 2018

                                                                                                                                                              Q2 2018

                                                                                                                                                                         Q3 2018

                                                                                                                                                                                   Q4 2018
                                                          Marina Bay
                                                          Raffles Place
                                                          Shenton Way/Robinson Rd/Cecil St/Anson Rd/Tanjong Pagar

                                                                                                                        Source: Edmund Tie & Company Research

                                                    Figure 8: Office development pipeline including projects
                                                    on awarded GLS sites, sq ft (million)
                                                    1.6

                                                    1.2

                                                    0.8

                                                    0.4

                                                    0.0
                                                                    Q4 2018                                  2019                               2020                     2021
                                                                    CBD                            City Fringe                                  Decentralised areas
                                                                                                             Source: URA, Edmund Tie & Company Research

E D M U N D T I E & C O M PA N Y R E S E A R C H                                                                                                                          7
Market commentary                                   • Average monthly gross rents in Shenton Way/
                                                      Robinson Rd/Cecil St/Anson Road/Tanjong
Rental growth for the office sector in the CBD        Pagar (Grade B) increased by 7.7 per cent
outperformed the other sectors, with average          to $7.00 psf in 2018. Rental growth was likely
gross rents increasing 6.8 per cent to $9.50 psf      driven by spillover effects from demand and
per month in 2018. (Figure 6). The growing market     rental rises for Premium and Grade A office
share of co-working space, and demand from            spaces, as lower rents for Grade B space
technology/FinTech firms largely contributed to       becomes more attractive to both potential
higher rents.                                         tenants and co-working space operators.
• Average monthly gross rents in Marina Bay
  (Premium) increased by 8.7 per cent in 2018       Outlook
  and grew by 1.9 per cent q-o-q to $11.50          Office rents in the CBD are expected to rise in
  psf in Q4 2018. This growth was supported         2019, albeit at a slower pace.
  by an improved occupancy rate of 90.7 per
  cent in 2018 vis-à-vis 78.6 per cent in 2017      • Approximately 704,000 sq ft and 734,000 sq ft
  (Figure 7). Key demand came from technology         of new islandwide office supply is forecasted
  companies, such as Facebook with 260,000 sq         to be completed in 2019 and 2020 respectively
  ft and Netflix with 40,000 sq ft in Marina One.     (Figure 8), with 148,000 sq ft in 2019 and
• Likewise, the average monthly gross rents of        514,000 sq ft in 2020 of new supply in the CBD.
  Grade A office buildings in Raffles Place rose      This is substantially lower than the annual
  by 4.2 per cent to $10.00 psf in 2018. This was     average net absorption rate of some 946,000
  underpinned by a relatively high occupancy          sq ft over the past three years from 2016 to
  rate of 96.0 per cent in 2018 and demand from       2018 in the CBD. Moreover, the majority of
  co-working operators that took up vacant            this new supply has been pre-committed. For
  spaces in older buildings as well as from           instance, 139 Cecil Street, a 85,000 sq ft space
  banking and finance, FinTech and technology         which is undergoing an upgrade and expected
  companies. Key notable leases include Dow           to be completed in 2019, is fully leased by co-
  Jones, JP Morgan and Cloudera.                      working operator Campfire Collective.
                                                    • With overall occupancy rates and rental rates
                                                      in the CBD expected to trend upwards in
                                                      2019, this will likely have a spillover effect on
                                                      office space located in the city fringe and
                                                      decentralised areas.

E D M U N D T I E & C O M PA N Y R E S E A R C H                                               8
Industrial
Key highlights                                                                                             Market commentary
• Average monthly gross rents for islandwide                                                               The overall performance of the industrial market
  first- and upper-storey multi-user factory                                                               in 2018 was somewhat mixed depending on the
  space declined marginally by 0.5 per cent to                                                             factory type and location.
  $1.80 psf and $1.35 psf respectively in 2018.
                                                                                                           • Average monthly gross rents of first- and upper-
• Average gross rents of islandwide high tech
                                                                                                             storey multi-user factory space eased by 0.5
  industrial space increased by 0.5 per cent to
                                                                                                             per cent to $1.80 psf and $1.35 psf respectively
  $2.90 psf per month in 2018.
                                                                                                             in 2018 (Figure 9). This slight rent reduction was
• Average monthly gross rents of islandwide                                                                  due to supply of 2.9m sq ft exceeding demand
  business parks grew by 2.1 per cent to $4.65                                                               of 915,000 sq ft for multiple-user factory space
  psf in 2018.                                                                                               for the period Q1 to Q3 2018. Additionally,
                                                                                                             occupancy rates for multiple-user factory
                                                                                                             space fell 1.0 percentage point y-o-y from 87.1
Continued demand for well-accessed                                                                           per cent in Q3 2017 to 86.1 per cent in Q3 2018
                                                                                                             (Figure 10). This trend was generally in line with
and city fringe areas for high tech
                                                                                                             the slowing PMI and NODX (Figure 2 - as at
industrial and business parks.                                                                               November 2018).

Figure 9: Industrial rental indices                                                                        Figure 10: Occupancy rates of private industrial space
                                                                                                           by type
(Q1 2011=100)
120                                                                                                        100%
110                                                                                                         95%
                                                                                                            90%
100
                                                                                                            85%
 90                                                                                                         80%
 80                                                                                                         75%
                                                                                                            70%
 70
                                                                                                                  Q3 2009

                                                                                                                            Q3 2010

                                                                                                                                      Q3 2011

                                                                                                                                                Q3 2012

                                                                                                                                                           Q3 2013

                                                                                                                                                                      Q3 2014

                                                                                                                                                                                Q3 2015

                                                                                                                                                                                          Q3 2016

                                                                                                                                                                                                    Q3 2017

                                                                                                                                                                                                              Q3 2018
      Q4 2009

                Q4 2010

                          Q4 2011

                                     Q4 2012

                                               Q4 2013

                                                         Q4 2014

                                                                   Q4 2015

                                                                             Q4 2016

                                                                                       Q4 2017

                                                                                                 Q4 2018

                                                                                                              Multiple-user factory space                            Single-user factory space
           First-storey             Upper-storey             Hi-tech         Business park
                                                                                                              Business park space                                    Warehouse space
                                               Source: Edmund Tie & Company Research
                                                                                                                                                          Source: Edmund Tie & Company Research

E D M U N D T I E & C O M PA N Y R E S E A R C H                                                                                                                                                    9
• In contrast, average monthly gross rents for                         Outlook
  high tech and business parks grew by 0.5 per
  cent to $2.90 psf and 2.1 per cent to $4.65                          From Q4 2018 to 2022, an estimated 22.2m sq
  psf respectively. Demand was strong coming                           ft of private industrial development space is
  from the science, IT and media industries. On                        expected to come online (Figure 11). However,
  a y-o-y basis, the occupancy rate of business                        approximately 68.0 per cent of this new supply
  parks rose by 0.9 percentage points to 85.8                          are owner-occupied i.e. comprising single-
  per cent in Q3 2018.                                                 user industrial developments; and extensions,
                                                                       additions and alterations to industrial properties.
Figure 11: Private industrial development pipeline                     • Industrial rents for multi-user factory space are
by type, million sq ft
                                                                         likely to face some downside risks, especially
16
14                                                                       in the manufacturing sector, which could be
12                                                                       negatively impacted by the ongoing US-China
10
                                                                         trade war as well as the slowing mainland
 8
 6                                                                       Chinese and global economies.
 4
 2
                                                                       • On the other hand, demand for high tech and
 0                                                                       business park space is expected to remain
      Q4 2018        2019         2020         2021         2022         positive, especially for those that are well
     Extensions, additions and alterations to industrial properties
     Warehouse developments                                              located with easy access to transportation
     Multiple-user industrial developments
     Single-user industrial developments                                 nodes and amenities and/or located in the city
     Business park developments                                          fringe area. Furthermore, with the expansion
                          Source: JTC, Edmund Tie & Company Research     of Google’s third data centre and Facebook
                                                                         investing $1.4bn to build its first data centre in
                                                                         Singapore, demand for data centres is likely
                                                                         to continue, with Singapore well-positioned
                                                                         as a regional hub to accommodate these
                                                                         specialised centres.

E D M U N D T I E & C O M PA N Y R E S E A R C H                                                                   10
Retail
Key highlights
• Average gross rents for prime first-storey retail   Lifestyle, experiential, diverse retail
  space in Orchard/Scotts Road increased 1.5          offerings and technology adaptation
  per cent y-o-y to $37.80 psf per month in 2018.     are key to attracting footfall.
• Average monthly gross rents for prime first-
  storey retail space in the Other City Areas
  remained flat at $19.80 psf in 2018.                Figure 12: Retail rental indices of prime first-storey space
• Average monthly gross rents for prime first-        (Q1 2011=100)
  storey retail space in the suburban areas grew      105

  by 1.0 per cent to $30.80 psf in 2018.              100
                                                       95
Market commentary                                      90
                                                       85
Retail rents generally stabilised in 2018, although
                                                       80
growth was not broad-based across Singapore.

                                                                                                                                                  Q4 2016
                                                            Q4 2009

                                                                         Q4 2010

                                                                                      Q4 2011

                                                                                                  Q4 2012

                                                                                                               Q4 2013

                                                                                                                           Q4 2014

                                                                                                                                       Q4 2015

                                                                                                                                                             Q4 2017

                                                                                                                                                                        Q4 2018
• Average monthly prime first-storey retail rents
  in Orchard/Scotts Road area increased                 Orchard/Scotts Road                                 Other City Areas                      Suburban Areas
  by 1.5 per cent to $37.80 psf in 2018 (Figure                                                                Source: Edmund Tie & Company Research
  12). This was generally supported by healthy
  occupancy rates of above 94.0 per cent (Figure
                                                      Figure 13: Retail occupancy rates by location
  13) and limited new supply in this subzone.
                                                      100%
  Notable entrants include fashion eyewear
  brand Mujosh in Wisma Atria and multi-label
                                                       95%
  concept store NomadX in Plaza Singapura,
  both opened in Q4 2018.
                                                       90%
• Average monthly gross rents of first-storey
  retail space in the Other City Areas remained
                                                       85%
  flat at $19.75 psf in 2018. Although there
                                                               Q3 2009

                                                                            Q3 2010

                                                                                        Q3 2011

                                                                                                    Q3 2012

                                                                                                                 Q3 2013

                                                                                                                             Q3 2014

                                                                                                                                        Q3 2015

                                                                                                                                                   Q3 2016

                                                                                                                                                              Q3 2017

                                                                                                                                                                         Q3 2018

  were many new entrants in this area, many
  businesses also closed down in 2018. For
                                                         Orchard/Scotts Road                                  Other city areas                    Suburban areas
  instance, SuperPark, an indoor activity park
  company from Finland, opened in Suntec                                                           Source: URA, Edmund Tie & Company Research

  City. Conversely, there were also many
  closures, especially for F&B and IT retailers,
  which include Emporium Shokuhin in Marina
  Square, all eight Costa Coffee outlets
  islandwide and Newstead Technologies which
  is under provisional liquidation with 10 outlets
  islandwide.

E D M U N D T I E & C O M PA N Y R E S E A R C H                                                                                                              11
• Average gross rents for prime first-storey retail   • Average gross rents for prime first-storey retail
  space in the suburban areas grew by 1.0 per           space in Orchard/Scotts Road are projected
  cent to $30.75 psf per month in 2018. Suburban        to improve slightly, supported by generally
  malls located near transportation nodes               high occupancy rates and limited new supply.
  performed well, attracting a diverse range of         However, it should be noted that tourism
  tenants, for example JD Sports opened its             receipts for shopping and F&B have fallen 15.0
  first store in Jurong Point; Spotlight opened its     per cent and 13.0 per cent y-o-y respectively
  second store in Westgate; online fashion retailer     in H1 2018 even though international visitor
  Love, Bonito opened its second store in Jem.          arrivals have increased 8.0 per cent over the
  On the contrary, hypermarket Giant has closed         same period.
  outlets in Junction 10 and Jalan Tenteram in        • Similarly, average gross rents for prime first-
  2018 with VivoCity pending in Q1 2019.                storey retail space in the Other City and
                                                        suburban areas are expected to remain stable
Outlook                                                 with some modest upside, as more than 1.3m
The retail sector in Singapore has been evolving        sq ft of new supply will be coming online in
and adapting with the growing presence of               2019 (Figure 14) namely the Funan Centre at
e-commerce, technology, as well as the ever-            325,000 sq ft and restoration of the existing
changing tastes, experiences and preferences            Raffles Hotel and shopping arcade at 200,000
of customers.                                           sq ft in the Other City Areas; and Project
                                                        Jewel at 579,000 sq ft in the suburban area.
For instance, from a technology perspective,            Additionally, Funan and Project Jewel have
the new OldTown White Coffee outlet at                  pre-committed rates of some 70.0 per cent
Suntec City features self-ordering kiosks to            and 90.0 per cent respectively. Other signs of
help identify regular customers and suggest             recovery include retail REITs reporting some
recommendations based on their past                     positive rent reversions in 2018, although it is
purchases. Other key trends include lifestyle           not broad-based.
and experiential retailers from the sports and
wellness sector including athleisure, such as         Figure 14: Retail development pipeline including projects
Vivre Activewear opening its third and largest        on awarded GLS sites, sq ft (million)

store in VivoCity, and sportswear giant Nike          1.6
opening a 10,800 sq ft store in the upcoming
Jewel Changi Airport.                                 1.2

With improving retail sentiments and steady           0.8
employment prospects, overall retail rents are
expected to remain stable.                            0.4

                                                      0.0
                                                             Q4 2018          2019        2020            2021
                                                        Orchard/Scotts Road    Other City Areas    Suburban Areas
                                                                           Source: URA, Edmund Tie & Company Research

E D M U N D T I E & C O M PA N Y R E S E A R C H                                                           12
Residential
Key highlights                                        Figure 15: Home sales (excluding executive condominiums)

• Private residential sales fell by 10.6 per y-o-y    40,000

  to 21,657 units in 2018.
                                                      30,000
                                                                                                           56.2%
• Average resale prices for both non-landed                            58.6%
                                                                                     60.3%
                                                                                               51.7%

  luxury homes and freehold properties in             20,000                                                           34.2%
                                                                                                                                                                   58.7%
                                                                                                                                                                               61.0%
  prime districts rose by 8.6 and 7.8 per cent                                                                                                         52.0%
                                                      10,000                                               43.8%                 45.0%      48.4%

  respectively, while non-landed leasehold                             41.4%         39.7%     48.3%                   65.8%
                                                                                                                                                                   41.3%       39.0%
                                                                                                                                 55.0%      51.6%      48.0%
  homes in suburban areas increased by 5.1 per                0

                                                                          2009

                                                                                     2010

                                                                                                  2011

                                                                                                            2012

                                                                                                                        2013

                                                                                                                                  2014

                                                                                                                                            2015

                                                                                                                                                       2016

                                                                                                                                                                   2017

                                                                                                                                                                               2018
  cent in 2018.
• Average resale prices of landed homes in both                             New Sales                                           Secondary Sales
  prime and non-prime districts grew around
                                                                                                                Source: URA REALIS as at 11 January 2019,
  5.0 per cent y-o-y on average.                                                                                         Edmund Tie & Company Research

• Average monthly gross rents of non-landed
  homes in both prime and suburban districts          Figure 16: Resale non-landed residential price index
  grew by around 2.0 and 0.3 per cent respectively.   (Q1 2011=100)
                                                       120
Market commentary                                      110
                                                       100
On 6 July 2018, the Government introduced
                                                        90
cooling measures that significantly increased
the initial outlay for developers, owner occupiers      80

and investors. Despite these cooling measures,          70
                                                             Q4 2009

                                                                           Q4 2010

                                                                                        Q4 2011

                                                                                                      Q4 2012

                                                                                                                    Q4 2013

                                                                                                                                Q4 2014

                                                                                                                                            Q4 2015

                                                                                                                                                        Q4 2016

                                                                                                                                                                     Q4 2017

                                                                                                                                                                                  Q4 2018
overall resale prices grew while sales volume
declined in 2018.
                                                             Luxury                       Prime freehold                                  Suburban leasehold
• The total number of private home sales fell
                                                                                                                   Source: Edmund Tie & Company Research
  by 10.6 per cent y-o-y to 21,657 units in 2018
  (Figure 15), driven by a 26.4 per cent decline
                                                      Figure 17: Monthly rents for non-landed homes ($ per unit)
  in sales volume in H2 2018 compared to H1
  2018. Proportionally, new sales unit fell by        $ per month
  a larger 15.6 per cent y-o-y to 8,440 units,        14,000
                                                      12,000
  compared to 7.1 per cent y-o-y decline for          10,000
                                                       8,000
  secondary sales in 2018.                             6,000
                                                       4,000
                                                       2,000
                                                           0
                                                                Q4 2009

                                                                              Q4 2010

                                                                                            Q4 2011

                                                                                                         Q4 2012

                                                                                                                      Q4 2013

                                                                                                                                  Q4 2014

                                                                                                                                             Q4 2015

                                                                                                                                                         Q4 2016

                                                                                                                                                                     Q4 2017

                                                                                                                                                                                  Q4 2018

                                                             Luxury                                                                Prime 2-bedroom
                                                             Prime 3-bedroom                                                       Non-prime 2-bedroom
                                                             Non-prime 3-bedroom

                                                                                                                   Source: Edmund Tie & Company Research

E D M U N D T I E & C O M PA N Y R E S E A R C H                                                                                                                    13
Outlook
Demand likely to stabilise, subject to             The cooling measures coupled with economic
strong economic fundamentals and                   uncertainties, are expected to subdue the
steady employment.                                 residential market, especially for en bloc sales,
                                                   as developers reassess their development
                                                   pipeline and sell down their upcoming new
• Likewise, average prices in H2 2018 flatlined    developments. With this wait-and-see approach,
  and/or contracted marginally with average        developers have also indicated that they are
  resale prices for non-landed luxury and          in no hurry to reduce prices amid a resilient
  freehold condominiums in prime districts         economy and steady employment market.
  climbing 8.6 and 7.8 per cent respectively       There are more than 55 to 60 planned launches
  in 2018 (Figure 16). These were much larger      in 2019 comprising more than 21,000 new private
  than the marginal 1.0 per cent growth in 2017.   units, excluding executive condominiums, with
  Price growth could possibly have been in         approximately 5,500 or 25.0 per cent in Core
  the double-digit range if not for the cooling    Central Region (CCR), 10,000 or 47.0 per cent in
  measures.                                        Outside Central Region (OCR) and 6,000 (28.0
• Average resale prices for non-landed             per cent) in Rest of Central Region (RCR). This
  leasehold properties in suburban areas rose      is substantially higher than the annual average
  by 5.1 per cent in 2018 vis-à-vis a decline of   take-up rate of 8,800 for new units over the past
  0.5 per cent in 2017, which was again largely    three years. With such a large offering, some
  attributed to the strong increase of resale      demand is expected to shift from the secondary
  prices in H1 2018.                               market to new sales.
• Overall, the average resale prices of landed
                                                   • Islandwide prices and rents are expected to
  homes properties in both prime and non-
                                                     remain flat with a small upside subject to stable
  prime districts grew around 5.0 per cent.
                                                     economic fundamentals and employment.
  Prices of landed homes remained relatively
                                                   • For the resale market, prices of older properties
  flat in H2 2018 due to the lack of new supply
                                                     may experience some downside risk, with
  for such properties.
                                                     lower demand and more competition from the
• Incidentally, the islandwide rental market
                                                     new launches.
  grew between 0.3 and 2.0 per cent (Figure 17)
  supported by improving vacancy rates and
  limited new completed stock. Key demand
  came from displaced homeowners and
  tenants from en bloc sale sites.

E D M U N D T I E & C O M PA N Y R E S E A R C H                                              14
CONTACTS                                  ONG Choon Fah
                                          Chief Executive Officer
                                          +65 6393 2318
                                          choonfah.ong@etcsea.com

PROFESSIONAL SERVICES
Valuation Advisory                        Property Tax Advisory &                    Hospitality                                Property Management
POH Kwee Eng                              Statutory Valuation                        HENG Hua Thong                             Philip LEOW
Executive Director                        NG Poh Chue                                Executive Director                         Executive Director
Regional Head of                          Executive Director                         Regional Head of                           +65 6417 9228
Valuation Advisory                        +65 6393 2515                              Investment Advisory                        philip.leow@etcsea.com
+65 6393 2312                             pohchue.ng@etcsea.com                      +65 6393 2398
kweeeng.poh@etcsea.com                                                               huathong.heng@etcsea.com                   KWOK Sai Kuai
                                                                                                                                Executive Director
Nicholas CHENG                            Research & Consulting                      TAY Hock Soon                              Regional Head of
Executive Director                                                                   Senior Director                            Property Management
                                          ONG Choon Fah
+65 6393 2317                                                                        +65 6887 0088                              +65 6417 9229
                                          Chief Executive Officer
nicholas.cheng@etcsea.com                                                            tayhs@treetops.com.sg                      saikuai.kwok@etcsea.com
                                          +65 6393 2318
                                          choonfah.ong@etcsea.com                                                               Paul WONG
                                                                                                                                Senior Director
                                                                                                                                +65 6417 9225
                                                                                                                                paul.wong@etcsea.com

AGENCY SERVICES                                                                                                                 REGIONAL OFFICES
Investment Advisory                       Auction & Sales                            Business Space & Retail                    Malaysia
Edmund TIE                                Nicholas CHENG                             CHUA Wei Lin                               Eddy WONG
Senior Advisor                            Executive Director                         Executive Director                         Managing Director
+65 6393 2386                             +65 6393 2317                              Regional Head of                           +603 2024 6380
edmund.tie@etcsea.com                     nicholas.cheng@etcsea.com                  Business Space                             eddy.wong@ntl.my
                                                                                     +65 6393 2326
YAM Kah Heng                              Joy TAN                                    weilin.chua@etcsea.com
Senior Advisor                            Senior Director
+65 6393 2368                             +65 6393 2505
kahheng.yam@etcsea.com                    joy.tan@etcsea.com                         China Desk                                 Thailand
HENG Hua Thong                                                                       HENG Hua Thong                             Punnee
Executive Director                        Residential                                Executive Director                         SRITANYALUCKSANA
Regional Head of                                                                     Regional Head of                           Chief Operating Officer
Investment Advisory                       Margaret THEAN                             Investment Advisory                        +66 2257 0499 ext 101
+65 6393 2398                             Executive Director                         +65 6393 2398                              punnee.s@etcthailand.co.th
huathong.heng@etcsea.com                  Regional Head of Residential               huathong.heng@etcsea.com
                                          +65 6393 2383
SWEE Shou Fern                            margaret.thean@etcsea.com                  YAM Kah Heng
Executive Director                                                                   Senior Advisor
+65 6393 2523                             Karen ONG                                  +65 6393 2368
shoufern.swee@etcsea.com                  Senior Director                            kahheng.yam@etcsea.com
                                          +65 6393 2366
TAN Chun Ming                             karen.ong@etcsea.com
Senior Director
+65 6393 2360
chunming.tan@etcsea.com

  Authors:                                ONG Choon Fah                              LEONG Kin Mun                              Isabelle SETO
                                          Chief Executive Officer                    Assistant Manager                          Senior Research Analyst
                                          +65 6393 2318                              +65 6393 2548                              +65 6393 2382
                                          choonfah.ong@etcsea.com                    kinmun.leong@etcsea.com                    isabelle.seto@etcsea.com

Disclaimer: The information contained in this document and all accompanying presentations (the “Materials”) are approximates only, is subject to change without
prior notice, and is provided solely for general information purposes only. While all reasonable skill and care has been taken in the production of the Materials,
Edmund Tie & Company (the “Company”) make no representations or warranties, express or implied, regarding the completeness, accuracy, correctness,
reliability, suitability, or availability of the Materials, and the Company is under no obligation to subsequently correct it. You should not rely on the Materials
as a basis for making any legal, business, or any other decisions. Where you rely on the Materials, you do so at your own risk and shall hold the Company,
its employees, subsidiaries, related corporations, associates, and affiliates harmless to you to and any third parties to the fullest extent permitted by law for any
losses, damages, or harm arising directly or indirectly from your reliance on the Materials, including any liability arising out of or in connection with any fault or
negligence. Any disclosure, use, copying, dissemination, or circulation of the Materials is strictly prohibited, unless you have obtained prior consent from the
Company, and have credited the Company for the Materials.                                                                            © Edmund Tie & Company 2018
Edmund Tie & Company (SEA) Pte Ltd
5 Shenton Way, #13-05 UIC Building, Singapore 068808 • Phone: +65 6293 3228 • Fax: +65 6298 9328 • Email: mail.sg@etcsea.com
You can also read