DEVELOPMENT OF PD/TIO2 POROUS LAYERS BY PULSED LASER DEPOSITION FOR SURFACE ACOUSTIC WAVE H2 GAS SENSOR - MDPI
←
→
Page content transcription
If your browser does not render page correctly, please read the page content below
nanomaterials

Article
Development of Pd/TiO2 Porous Layers by Pulsed
Laser Deposition for Surface Acoustic Wave H2
Gas Sensor
Izabela Constantinoiu and Cristian Viespe *
 National Institute for Laser, Plasma and Radiation Physics, Laser Department, Atomistilor #409,
 077125 Magurele, Romania; izabela.constantinoiu@inflpr.ro
 * Correspondence: cristian.viespe@inflpr.ro

 Received: 3 April 2020; Accepted: 14 April 2020; Published: 15 April 2020

 Abstract: The influence of sensitive porous films obtained by pulsed laser deposition (PLD) on the
 response of surface acoustic wave (SAW) sensors on hydrogen at room temperature (RT) was studied.
 Monolayer films of TiO2 and bilayer films of Pd/TiO2 were deposited on the quartz substrates of
 SAW sensors. By varying the oxygen and argon pressure in the PLD deposition chamber, different
 morphologies of the sensitive films were obtained, which were analyzed based on scanning electron
 microscopy (SEM) images. SAW sensors were realized with different porosity degrees, and these
 were tested at different hydrogen concentrations. It has been confirmed that the high porosity of
 the film and the bilayer structure leads to a higher frequency shift and allow the possibility to make
 tests at lower concentrations. Thus, the best sensor, Pd-1500/TiO2 -600, with the deposition pressure
 of 600 mTorr for TiO2 and 1500 mTorr for Pd, had a frequency shift of 1.8 kHz at 2% hydrogen
 concentration, a sensitivity of 0.10 Hz/ppm and a limit of detection (LOD) of 1210 ppm. SAW sensors
 based on such porous films allow the detection of hydrogen but also of other gases at RT, and by PLD
 method such sensitive porous and nanostructured films can be easily developed.

 Keywords: pulsed laser deposition (PLD); surface acoustic wave (SAW); hydrogen sensor; porous
 morphology; bilayer films; Pd/TiO2 ; titanium dioxide; palladium

1. Introduction
     The final properties of the materials are strongly influenced by their morphology. Thus, it is very
important for each type of application to study an optimum morphology, so as to obtain its best results.
This is also a significant aspect in the field of gas sensors. Besides stability, in this domain, a large
area of interactions between the sensitive material and gas is desired. In other words, nanostructured
porous materials are ideal for obtaining the highest sensitivity for gas sensors because they possess
high surface to volume ratio, fast charge diffusion and large penetration depth [1,2].
     Pulsed laser deposition (PLD) [3], radio frequency (RF) magnetron sputtering deposition [4],
sol-gel method [5], chemical vapor deposition [6], etc. are synthesis methods by which nanostructured
materials with different morphologies can be obtained. Among various techniques, PLD has the
advantages of high deposition rate, maintaining the stoichiometry of the target, wide choice of materials
and a relatively high reproducibility [7,8]. This technique has some unique features: the control of
stoichiometry, the possibility to use thermally stable substrates, the capability to grow nanostructures
in the presence of a gas [8]. These advantages come from the ability to control the parameters as
laser power, pulse frequency, substrate temperature, rate deposition, pressure deposition, the distance
between target and substrate, etc. [7,9]. In order to obtain various morphology and properties of the
materials through the PLD technique, the deposition pressure is an important parameter influencing this
feature [3,10,11]. As the depositing pressure increases, the porosity of the material also increases [12].

Nanomaterials 2020, 10, 760; doi:10.3390/nano10040760                        www.mdpi.com/journal/nanomaterials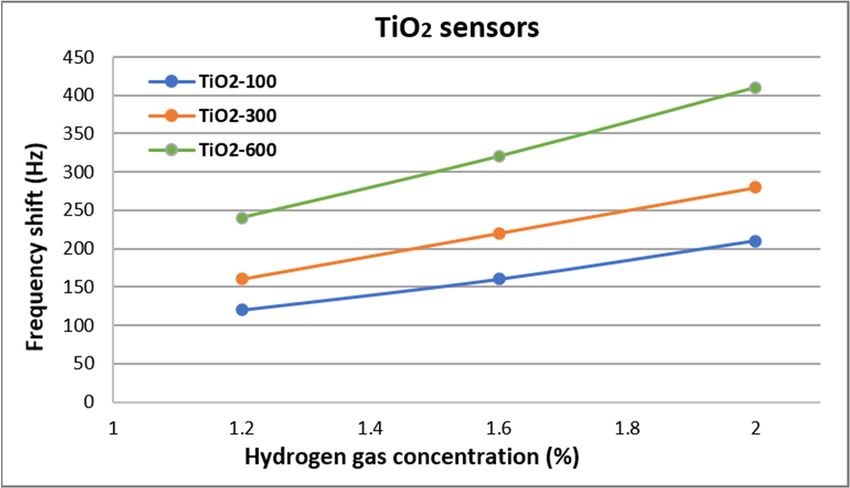
Nanomaterials 2020, 10, 760                                                                        2 of 10

      Surface acoustic wave (SAW) gas sensors operate on the principle of turning an electrical input
signal into a mechanical wave [13]. The occurrence of gas molecules at the sensor sensitive film, leads
to a perturbation of surface acoustic wave propagation. This phenomenon is due to changes in the
mass or acoustoelectric properties of the sensitive layer in the presence of the gas [14]. This type of
sensors has attracted attention through their features as small size, low cost, ease of fabrication, fast
response, remarkable sensitivity, satisfactory stability, wireless operation [15,16]. SAW sensors have
been developed for the detection of hydrogen [15,17] volatile organic compounds [18], ammonia [16],
hydrogen sulfide [1], explosives [19], toxic gases [20], etc.
      Because hydrogen is a potential candidate to replace fossil fuel for sustainable transportation
by providing clean, convenient, reliable, customer and affordable energy [21], the development of
hydrogen sensors is required. Whereas, hydrogen is an odorless, colorless and vastly combustible gas:
flammable between 4%–75% in air, with high diffusion coefficient in air (0.60 cm2 /s), and low ignition
energy (0.002 mJ), the failure to detect it in time can lead to an explosion [22,23]. Over time, several
types of hydrogen sensing sensors have been developed, including chemiresistive gas sensors [24],
SAW sensors [12], metal-oxide semiconductor gas sensors [23]. Different types of sensing materials
have been used for hydrogen detection: metal oxide thin films (ZnO, TiO2 , WO3 , SnO2 , In2 O3 ) [25,26],
metal thin films (Pd, Pt) [27], multilayer of metal oxides and metals (Pd/WO3 , Pd/V2 O5 , Pd/SnO2 ,
Pd/ZnO) [12,23,28,29], composite materials [30], nanowires [31]. Some of these types of sensors have the
ability to detect hydrogen at temperatures above 200 ◦ C, which is inappropriate for hydrogen detection
because the risk of the explosion becomes higher especially at high hydrogen concentrations [30].
      In this paper, we will focus on how the morphology of two of these commonly used materials in
the field of hydrogen sensors, namely TiO2 and Pd, influence the response of SAW sensors at different
hydrogen concentrations at room temperature (RT).
      TiO2 is one of the most popular hydrogen sensing materials, with remarkable results when it
was used with different metals. Up to now, for detection at RT, TiO2 based sensors have results by
surface modification with metals like Pd [32,33]. Because of the capacity to absorb large quantities
of hydrogen (0.56 wt % at 293 K) and its low activation energy, Pd is widely used in hydrogen gas
sensors [34]. It works as a catalyst by dissociating the hydrogen molecules in hydrogen atoms and by
minimizing the activation energy between the surfaces of metal oxide and hydrogen gas [28].
      For the detection at RT of hydrogen with SAW sensors, by the deposition method of PLD, sensitive
films of TiO2 and Pd/TiO2 with different morphologies were developed. SAW sensors tests have
demonstrated sensitivity at RT and the influence of porous morphology on improving sensor responses.

2. Materials and Methods

2.1. Film Deposition and Characterization
     For film deposition, a Nd-YAG laser (EKSPLA NL301HT, Ekspla, Vilnius, Lithuania) with an
emission wavelength of 355 nm and a 5 ns pulse duration at a repetition rate of 10 Hz was used.
The energy per pulse was about 71 mJ and by focusing the laser beam onto the target, an energy density
of about 25 J/cm2 was obtained.
     The depositions were made on the quartz SAW sensor substrates. To limit the deposition only
in the sensitive area of the sensor, we used a mask that protected the interdigital transducers (IDTs).
The substrate and the target were placed parallel in the deposition chamber, and the target was
controlled by computer x–y tables to ensure the ablation on a certain surface. The distance between the
target and the substrate was 40 mm, and the deposition took place without heating the substrate. The
depositions were made in the presence of two gases (oxygen and argon) whose pressure and gas flow
were controlled through a system attached to the deposition facility. This system consists of a throttle
valve (MKS 253B) controlled by a pressure controller (MKS 600) on a vane vacuum pump (Agilent
Varian-DS602, Leini, Italy) and a mass-flow controller (MKS multigas 647) on the gas bottles.
Nanomaterials 2020, 10, 760 3 of 10
The sensitivity films for SAW sensors were deposited from two targets: TiO2 and Pd, in two forms:
monolayer (only TiO2 ) and multilayer (Pd and TiO2 ). In addition to the type of film, the pressure of
the gas in chamber deposition was also variated to establish the optimum morphology required in
SAW sensors. Table 1 shows the deposition pressures used to achieve the six sensors developed in this
work. As can be seen, for the three sensors with bilayers, the oxygen pressure of TiO2 deposition was
maintained at 600 mTorr. This was determined after analyzing scanning electron microscopy (SEM)
images and the results of the sensors tests at different hydrogen concentrations.
The morphology of the sensitive layers and bilayers was studied by SEM (FEI QUANTA).
Table 1. Sensors and the pressure deposition of the sensitive films.
Deposition Pressure (mTorr)
Sensor Name Composition of the Sensitive Layer
O2 Ar
TiO2 -100 100 -
TiO2 -300 TiO2 300 -
TiO2 -600 600 -
Pd-100/TiO2 -600 600 100
Pd-1200/TiO2 -600 Pd/TiO2 600 1200
Pd-1500/TiO2 -600 600 1500
2.2. Sensor Structure and Testing
The SAW sensors used are based on quartz substrates, with ST-X-cut and with a parallelogram
geometry with 45◦ angle, to reduce the influence of the SAW unwanted reflections. The advantage of the
quartz substrate is good stability at RT [12]. It is a delay line type sensor, having an oscillating frequency
of ~69 MHz [35]. The dimensions of the sensor substrate are: 38 mm long, 10 mm wide, 0.5 mm thick.
Using the photolithographic technique, the gold IDTs were deposited onto 10 nm thick chromium
layers, which has the role of ensuring the gold adhesion to the quartz substrate. The configuration
of the IDTs is ‘double-comb’ and consists of 50 straight pairs with 45.2 µm wavelength and 2500 µm
acoustic aperture. The active surface of the sensor deposited by PLD between IDTs is 10 × 10 mm2 .
The set-up used for sensors tests is composed of a DHPVA-200 FEMTO amplifier (Messtechnik
GmbH, Berlin, Germany) with a CNT-91 Pendullum frequency counter (Spectracom Corp, Rochester,
NY, USA) connected to a computer software, Time View 3.
The sensors were tested at different hydrogen concentrations. To obtain these concentrations,
it was used mass flow controllers (Figure 1 [29]) to homogenize the hydrogen gas mixture (2%-H2
and 98% synthetic
Nanomaterials 2020,air)
10, xwith pureREVIEW
FOR PEER synthetic air. The value of the total gas flow rate was maintained
4 of 11 at
0.5 L/min in all determinations.
1. Experimental
FigureFigure setup
1. Experimental forfor
setup surface
surfaceacoustic wave(SAW)
acoustic wave (SAW)sensor
sensor frequency
frequency shiftshift measurements
measurements
for hydrogen detection [29].
for hydrogen detection [29].
3. Results and Discussion
3.1. Film Morphology
The different pressures under which the TiO2 films were deposited led to the obtaining of
obviously different film morphologies, as it can be seen in Figures 2 and 3. If at 100 mTorr the film isFigure 1.
Nanomaterials Experimental
2020, 10, 760 setup for surface acoustic wave (SAW) sensor frequency shift measurements4 of 10
for hydrogen detection [29].
3. Results
3. Resultsand
andDiscussion
Discussion
3.1. Film Morphology
3.1. Film Morphology
The different pressures under which the TiO films were deposited led to the obtaining of obviously
The different pressures under which the 2TiO2 films were deposited led to the obtaining of
different film morphologies, as it can be seen in Figures 2 and 3. If at 100 mTorr the film is almost
obviously different film morphologies, as it can be seen in Figures 2 and 3. If at 100 mTorr the film is
dense (Figure 2a,b), above 900 mTorr, the films become very porous with a tendency of exfoliation on
almost dense (Figure 2a,b), above 900 mTorr, the films become very porous with a tendency of
the substrate (Figure 3). The explanation of this phenomenon lies in the delay effect produced on the
exfoliation on the substrate (Figure 3). The explanation of this phenomenon lies in the delay effect
species ablated by the collision between them and the gas molecules, which lead to the decrease of
produced on the species ablated by the collision between them and the gas molecules, which lead to
their kinetic energy and cluster nucleation [29,36]. Such porous morphology results in superior sensor
the decrease of their kinetic energy and cluster nucleation [29,36]. Such porous morphology results
results, even at RT determinations.
in superior sensor results, even at RT determinations.
Figure 2. Scanning electron microscopy (SEM) images of TiO films at (a) and (b) −100 mTorr, (c) and
Figure 2.
Nanomaterials Scanning
2020, electron
10, x FOR microscopy (SEM) images of TiO22 films at (a) and (b) −100 mTorr, (c) and5 of 11
PEER REVIEW
(d) −300 mTorr, (e) and (f) −600 mTorr.
(d) −300 mTorr, (e) and (f) −600 mTorr.
Figure 3. SEM images of TiO films at (a) and (b) −900 mTorr, (c) and (d) −1800 mTorr.
Figure 3. SEM images of TiO22 films at (a) and (b) −900 mTorr, (c) and (d) −1800 mTorr.
Because at pressures above 900 mTorr the TiO2 films are no longer stable on the surfaces of
Because at pressures above 900 mTorr the TiO2 films are no longer stable on the surfaces of the
the substrates, for the sensor’s sensitive films only the first three deposition pressures were chosen:
substrates, for the sensor’s sensitive films only the first three deposition pressures were chosen: 100
100 mTorr, 300 mTorr and 600 mTorr. Considering that at 100 mTorr, the film is not porous and for the
mTorr, 300 mTorr and 600 mTorr. Considering that at 100 mTorr, the film is not porous and for the
other two pressures there are different degrees of porosity, it will be possible to analyses through the
other two pressures there are different degrees of porosity, it will be possible to analyses through the
sensor's results how this parameter influences the improvement of the sensitivity of the hydrogen
SAW sensors at RT.
The behavior of Pd at different pressures of PLD deposition was analyzed, in order to obtain
multilayer films. The study that determined how the variation of gas pressure influences the
morphology of Pd films was performed over a wider range of pressures: 100–2700 mTorr. As can beNanomaterials 2020, 10, 760 5 of 10
sensor’s results how this parameter influences the improvement of the sensitivity of the hydrogen
SAW sensors at RT.
The behavior of Pd at different pressures of PLD deposition was analyzed, in order to obtain
multilayer films. The study that determined how the variation of gas pressure influences the
morphology of Pd films was performed over a wider range of pressures: 100–2700 mTorr. As can
be seen in the SEM images (Figures 4 and 5), at 100 mTorr (Figure 4a,b), the film is dense. Going to
300 mTorr (Figure 4c,d), small cracks appear on the surface of the film and increasing the pressure to
600 mTorr, (Figure 4e,f) respectively 900 mTorr (Figure 5a,b), the size of cracks obviously increases.
At 1200 mTorr (Figure 5c,d), it is observed the formation of well-determined nanoparticles groups,
with approximately equal shapes and sizes. After 1500 mTorr (Figure 5e,f), the morphology of the
films changes visibly, having a ’fluffy’ morphology, with a relatively high porosity. At 1800 mTorr and
2700 mTorr, it was observed that the films deposited, although they were very porous, they were not
uniform and continuous, and these aspects eliminated from beginning the possibility of their use on
the sensor. Taking into account the characteristics observed above, but also the need to highlight the
influence of the porosity of the films on the quality of the sensor responses, for the manufacturing of
Nanomaterials 2020, 10, x FOR PEER REVIEW 6 of 11
the sensors, three
Nanomaterials 2020,deposition pressures
10, x FOR PEER REVIEW were chosen: 100, 1200 and 1500 mTorr. 6 of 11
Figure 4. SEM
4. SEM imagesofofthe
images the Pd films atat(a)
(a)and (b)(b)
−100 mTorr,
−100 (c) and
(c) (d) −300
(d)mTorr, (e) and (f)
−300 mTorr,
Figure
Figure 4. SEM images of the Pd
Pd films
films at (a) and
and (b) −100 mTorr,
mTorr, (c) and and
(d) −300 mTorr, (e) and
(e) and (f)
−600 mTorr.
(f) −600
−600mTorr.
mTorr.
Figure 5. SEM
Figure images
5. SEM imagesofofthe
the Pd
Pd films at(a)
films at (a)and
and(b)(b) −900
−900 mTorr,
mTorr, (c) (d)
(c) and (d) −1200
and−1200 mTorr, mTorr, (e) and
(e) and (f)
Figure
(f) −1500 5. SEM images of the Pd films at (a) and (b) −900 mTorr, (c) and (d) −1200 mTorr, (e) and (f)
−1500mTorr.
mTorr.
−1500 mTorr.
3.2. Sensor Properties
3.2. Sensor Properties
Both monolayer and bilayer SAW sensors have been tested at different hydrogen concentrations
Both monolayer and bilayer SAW sensors have been tested at different hydrogen concentrations
at RT. The results of the frequency shifts obtained are presented in Figures 6 and 7. Sensors tests were
at RT. The results of the frequency shifts obtained are presented in Figures 6 and 7. Sensors tests were
performed up to a maximum concentration of 2%, for safety reasons (hydrogen is explosive at a
performed up to a maximum concentration of 2%, for safety reasons (hydrogen is explosive at a
minimum concentration of 4%).
minimum concentration of 4%).Nanomaterials 2020, 10, 760 6 of 10
3.2. Sensor Properties
Both monolayer and bilayer SAW sensors have been tested at different hydrogen concentrations
at RT. The results of the frequency shifts obtained are presented in Figures 6 and 7. Sensors tests
were performed up to a maximum concentration of 2%, for safety reasons (hydrogen is explosive at a
minimum concentration of 4%).
Nanomaterials 2020, 10, x FOR PEER REVIEW 7 of 11
Figure
6.6.Frequency
Frequencyshift
shiftof
ofthe
the TiO
TiO22 sensors at different hydrogen concentrations.
Figure 2 sensors at different hydrogen concentrations.
Figure
7.7.Frequency
Frequencyshift
shiftof
ofthe
the Pd/TiO
Pd/TiO22 sensors at different hydrogen concentrations.
Figure 2 sensors at different hydrogen concentrations.
Regardingthe
Regarding thesensors with TiO
sensors with TiO222sensitive
sensitive films, it can
films, be seen
it can in Figure
be seen 6 that 6the
in Figure frequency
that shift
the frequency
increases with the increases of hydrogen concentration. As discussed above, the
shift increases with the increases of hydrogen concentration. As discussed above, the films deposited films deposited at
different pressures have different morphology and this aspect is reflected in the
at different pressures have different morphology and this aspect is reflected in the sensor responses. sensor responses.
TheThe sensor
sensor with
with TiOTiO 22 sensitive film deposited at 100 mTorr (TiO22-100) was dense and it had the
2 sensitive film deposited at 100 mTorr (TiO2 -100) was dense and it had the weakest
weakest response. As
response. As the deposition the deposition
pressure pressure
increasesincreases to 600thus
to 600 mTorr, mTorr, thus increasing
increasing the porosity
the porosity of the of
film,
the film, the frequency shift of the sensor tested under the same conditions
the frequency shift of the sensor tested under the same conditions and at the same concentrations and at the same
concentrations doubles. Thus, it can be stated that the porous morphology of the TiO2 sensitive film
doubles. Thus, it can be stated that the porous morphology of the TiO2 sensitive 2film allows that
allows that hydrogen gas molecules penetrate in greater quantity the volume of the film. The mass
hydrogen gas molecules penetrate in greater quantity the volume of the film. The mass accumulation
accumulation takes place through a mechanism that influences the film properties from an electrical
takes place through a mechanism that influences the film properties from an electrical point of view.
point of view. Negatively charged oxygen species are adsorbed on the surface of the nanostructured
Negatively charged oxygen species are adsorbed on the surface of the nanostructured TiO2 film and
TiO22 film and they react with hydrogen reducing gas, suppling electrons in the conduction band and
leading to a decrease in electric resistance [30]. Considering that these reactions take place on the
surface of the film, the larger the surface of the film, the better the sensor results.
Taking into account that for sensors with sensitive TiO22 films, the best result was obtained for
the one deposited at 600 mTorr, for this one, the study was continued in order to improve the
sensitivity.Nanomaterials 2020, 10, 760 7 of 10
they react with hydrogen reducing gas, suppling electrons in the conduction band and leading to a
decrease in electric resistance [30]. Considering that these reactions take place on the surface of the
film, the larger the surface of the film, the better the sensor results.
Taking into account that for sensors with sensitive TiO2 films, the best result was obtained for the
one deposited at 600 mTorr, for this one, the study was continued in order to improve the sensitivity.
Through the acusto-electrical interactions, the surface acoustic wave is very sensitive at
changes in electrical conductivity [37], and these interactions could be enhanced in bilayers [12].
The acusto-electrical effect comes from the interaction of electrical potential that accompanies the
SAW propagation with the mobile charges in the sensing film [12]. The variation of the electrical
conductivity can lead both to a decrease and to an increase of the center frequency [38]. It is known
that mass accumulation of the gas leads to a decrease in the center frequency of the SAW sensor. [29].
Considering that hydrogen is a reducing gas which by reaction with the species adsorbed of oxygen
releases electrons into TiO2 film, the conductivity increases, and the center frequency decreases. This is
the mechanism that applies to the sensors studied in this work.
Thus, to improve the sensitivity of the TiO2 -600 sensor at RT, a bilayer of TiO2 and Pd was
used. Because Pd has the ability to dissociate hydrogen molecules into H+ ions and electrons, the
acusto-electrical effect between it and the TiO2 film is more pronounced. At the same time, the
development of this process on a larger surface also leads to the improvement of the sensitivity of the
sensors. This was demonstrated by sensor tests, as it is shown in Figure 7. All sensors with bilayer
films (Pd/TiO2 ) showed an obvious improvement (about 3–4 times higher) of the sensitivity towards
the sensors with TiO2 films. The measurements could be made up to a minimum concentration of
0.2%, compared to 1.2% at the sensors with TiO2 films. For all measurements, the sensors indicated
reversibility by returning to the initial frequency after hydrogen removal. Three different morphologies
of Pd were chosen to observe how the porosity of the film influences the sensor response (these were
discussed at 2.1 depending on the PLD deposition pressure). As expected, for the dense Pd film, the
sensor results were weaker, but better than TiO2 only sensor. With increasing Pd pressure deposition,
the sensor response is noticeably better and about 4 times higher than the TiO2 only sensors. This is
due to the porosity of the films, both TiO2 and Pd. Having a porous morphology, in the Pd films the
process of dissociation of the hydrogen molecules takes place on a larger surface, and the penetrations
of the H+ ions in TiO2 is faster. In this way, the mass effect and the acusto-electric effect are combined
and lead to obtaining a sensor with good sensitivity at RT. It was observed that these aspects also
influence the response times of the sensors, which varied between 15–45 s for hydrogen concentrations
between 0.2 and 2%.
Table 2 presents the sensitivity and limit of detection (LOD) of the SAW sensors investigated in this
work. Sensitivity is defined as the frequency shift in Hz per unit analyte concentration in ppm, and was
determined from an average sensitivity values of the determinations at each gas concentration [13,29].
LOD is defined as three times the noise level divided by the sensitivity [13,30]. The noise level was
estimated at 40 Hz. It can be seen that the best results were obtained by the sensor that had the highest
porosity (Pd-1500/TiO2 -600).
Table 2. Sensitivity and limit of detection (LOD) of the sensors. Legend: ∆f-frequency change;
c-hydrogen concentration, n-noise level.
Sensitivity (∆f/c) LOD (3 × n)/(∆f/c)
Sensor
(Hz/ppm) (ppm)
TiO2 -100 0.01 11807
TiO2 -300 0.01 8765
TiO2 -600 0.02 5951
Pd-100/TiO2 -600 0.02 4224
Pd-1200/TiO2 -600 0.07 1661
Pd-1500/TiO2 -600 0.10 1210Nanomaterials 2020, 10, 760 8 of 10
4. Conclusions
The films of TiO2 , Pd and Pd/TiO2 were deposited by PLD method at different oxygen and argon
pressures in chamber deposition. For each pressure deposition used and depending on the material,
different morphologies of the films were obtained, which were analyzed by SEM images. It has been
found that with increasing deposition pressure, the morphology of the films gains a higher porosity.
SAW sensors were realized at different degrees of porosity, and the tests at RT indicated that the best
results were obtained through the bilayer film sensor (Pd-1500/TiO2 -600), deposited at the highest
pressures: 600 mTorr for TiO2 and 1500 mTorr. This sensor had a frequency shift of 1.8 kHz at 2%
hydrogen concentration, a sensitivity of 0.10 Hz/ppm and a limit of detection (LOD) of 1210 ppm.
For SAW gas sensors, porosity and multilayer films are properties that allow detection at RT, and
PLD is a method that allows them to be obtained in an easy way, by varying the gas pressure in the
deposition chamber.
Author Contributions: Contributed to writing—original draft preparation, I.C.; contributed to sensor development
and experiment design and detection measurements, C.V.; contributed to sample morphological analysis, I.C.;
conceptualization, writing—review and editing, and methodology were contributed to by C.V. and I.C. All authors
have read and agreed to the published version of the manuscript.
Funding: This work was supported by a grant of the Romanian Ministry of Education and Research,
CCCDI-UEFISCDI, project number PN-III-P1-1.2-PCCDI-2017-0172/15PCCDI and Romanian National Nucleu
Program LAPLAS VI—contract n. 16N/2019.
Acknowledgments: The authors want to thank Dana Miu for her feedback regarding this work.
Conflicts of Interest: The authors declare no conflict of interest.
References
1. Luo, W.; Fu, Q.; Zhou, D.; Deng, J.; Liu, H.; Yan, G. A surface acoustic wave H2S gas sensor employing
nanocrystalline SnO2 thin film. Sens. Actuators B Chem. 2013, 176, 746–752. [CrossRef]
2. Chen, H.-I.; Cheng, Y.-C.; Chang, C.-H.; Chen, W.-C.; Liu, I.-P.; Lin, K.-W.; Liu, W.-C. Hydrogen sensing
performance of a Pd nanoparticle/Pdfilm/GaN-based diode. Sens. Actuator B Chem. 2017, 247, 514–519.
[CrossRef]
3. Kunti, A.; Chowdhury, M.; Sharma, S.; Gupta, M.; Chaudhary, R. Influence of O 2 pressure on structural,
morphological and optical properties of TiO 2 -SiO 2 composite thin films prepared by pulsed laser deposition.
Thin Solid Films 2017, 629, 79–89. [CrossRef]
4. Zhou, W.; Zhang, L.; Ouyang, C.; Wu, J.; Huang, Z.; Xu, X. Micro structural, electrical and optical properties
of highly (220) oriented spinel Mn–Co–Ni–O film grown by radio frequency magnetron sputtering. Appl.
Surf. Sci. 2014, 311, 443–447. [CrossRef]
5. Han, Z.; Ren, J.; Zhou, J.; Zhang, S.; Zhang, Z.; Yang, L.; Yin, C. Multilayer porous Pd-WO3 composite thin
films prepared by sol-gel process for hydrogen sensing. Int. J. Hydrog. Energy 2020, 45, 7223–7233. [CrossRef]
6. Qadri, M.U.; Annanouch, F.E.; Aguiló, M.; Díaz, F.; Borull, J.F.; Pujol, M.C.; Llobet, E. Metal Decorated WO3
Nanoneedles Fabricated by Aerosol Assisted Chemical Vapor Deposition for Optical Gas Sensing. J. Nanosci.
Nanotechnol. 2016, 16, 10125–10132. [CrossRef]
7. Di, W.; Liu, F.; Lin, T.; Kong, H.; Meng, C.; Zhang, W.; Chen, Y.; Hou, Y. Influence of oxygen partial pressure on
structural and electrical properties of Mn1.56Co0.96Ni0.48O4 thin films deposited by pulsed laser deposition.
Appl. Surf. Sci. 2018, 447, 287–291. [CrossRef]
8. Meng, L.; Wang, Z.; Yang, L.; Ren, W.; Liu, W.; Zhang, Z.; Yang, T.; Dos Santos, M. A detailed study on the
Fe-doped TiO2 thin films induced by pulsed laser deposition route. Appl. Surf. Sci. 2019, 474, 211–217.
[CrossRef]
9. Zhang, Z.; Wong, L.M.; Zhang, Z.; Wu, Z.; Wang, S.; Chi, D.; Hong, R.; Yang, W. Pulse laser deposition of
epitaxial TiO2thin films forhigh-performance ultraviolet photodetectors. Appl. Surf. Sci. 2015, 355, 398–402.
[CrossRef]
10. Jiao, S.; Zhang, Y.; Duan, Z.; Wang, T.; Tang, Y.; Zhao, X.; Sun, D.; Shi, W.; Wanga, F. Influence of oxygen
pressure on the electrical properties of Mn-doped Bi0.5Na0.5TiO3BaTiO3 thin films by pulsed laser deposition.
Ceram. Int. 2019, 45, 13518–13522. [CrossRef]Nanomaterials 2020, 10, 760 9 of 10
11. Nyenge, R.; Swart, H.; Ntwaeaborwa, O.M. The influence of substrate temperature and deposition pressure
on pulsed laser deposited thin films of CaS:Eu2+ phosphors. Phys. B Condens. Matter 2016, 480, 186–190.
[CrossRef]
12. Miu, D.; Bîrjega, R.; Viespe, C. Surface Acoustic Wave Hydrogen Sensors Based on Nanostructured Pd/WO3
Bilayers. Sensors 2018, 18, 3636. [CrossRef]
13. Ballantine, D.S.; White, R.M.; Martin, S.J.; Ricco, A.J.; Zellers, E.T.; Frye, G.C.; Wohtjen, H. Acoustic Wave
Sensors, Theory, Design, and Physico-Chemical Applications; Academic Press: San Diego, CA, USA, 1997.
14. Ricco, A.J.; Martin, S.J.; Zipperian, T.E. Surface Acoustic Wave gas sensor based on film conductivity changes.
Sens. Actuator 1985, 8, 319–333. [CrossRef]
15. Wang, W.; Liu, X.; Mei, S.; Jia, Y.; Liu, M.; Xue, X.; Yang, D. Development of a Pd/Cu nanowires coated SAW
hydrogen gas sensor with fast response and recovery. Sens. Actuators B Chem. 2019, 287, 157–164. [CrossRef]
16. Constantinoiu, I.; Miu, D.; Viespe, C. Surface Acoustic Wave Sensors for Ammonia Detection at Room
Temperature based on SnO2/Co3O4 Bilayers. J. Sens. 2019, 2019. [CrossRef]
17. Constantinoiu, I.; Viespe, C. Hydrogen Detection with SAW Polymer/Quantum Dots Sensitive Films. Sensors
2019, 19, 4481. [CrossRef] [PubMed]
18. Constantinoiu, I.; Viespe, C. Detection of Volatile Organic Compounds Using Surface Acoustic Wave Sensor
Based on Nnaoparticles Incorporated in Polymer. Coatings 2019, 9, 373. [CrossRef]
19. Raj, V.B.; Singh, H.; Nimal, A.; Sharma, M.; Gupta, V. Oxide thin films (ZnO, TeO2, SnO2, and TiO2) based
surface acoustic wave (SAW) E-nose for the detection of chemical warfare agents. Sens. Actuator B Chem.
2013, 178, 636–647. [CrossRef]
20. Dinca, V.; Viespe, C.; Brajnicov, S.; Constantinoiu, I.; Moldovan, A.; Bonciu, A.; Toader, C.N.; Ginghina, R.E.;
Grigoriu, N.; Dinescu, M.; et al. MAPLE Assembled Acetylcholonesterase-Polyethylenimine Hybrid and
Multilayered Interfaces for Toxic Gases Detection. Sensors 2018, 18, 4265. [CrossRef]
21. Acar, C.; Dincer, I. The potential role of hydrogen as a sustainable transportation fuel to combat global
warming. Int. J. Hydrog. Energy 2020, 45, 3396–3406. [CrossRef]
22. Kumar, A.; Kumar, A.; Chandra, R. Fabrication of porous silicon filled Pd/SiC nanocauliflower thin films for
high performance H2 gas sensor. Sens. Actuator B Chem. 2018, 264, 10–19. [CrossRef]
23. Zhang, S.; Yin, C.; Yang, L.; Zhang, Z.; Han, Z. Investigation of the H2 sensing properties of multilayer
mesoporous pure and Pd-doped SnO2 thin film. Sens. Actuator B Chem. 2019, 283, 399–406. [CrossRef]
24. Prakash, R.; Kumar, A.; Kaur, D. Pd capped W2N nano porous thin films for remarkable room temperature
hydrogen gas sensing performance. Sens. Actuator B Chem. 2018, 277, 665–672. [CrossRef]
25. Devkota, J.; Ohodnicki, P.R.; Greve, D.W. SAW Sensors for Chemical Vapours and Gases. Sensors 2017, 17,
801. [CrossRef] [PubMed]
26. Zhou, X.; Zhang, H.; Wang, Z.; Xia, X.; Bao, Y.; Homewood, K.; Shao, G.; Huang, Z.; Gao, Y. Improved
hydrogen sensing of (004) oriented anatase TiO2 thin films through post annealing. Int. J. Hydrog. Energy
2019, 44, 20606–20615. [CrossRef]
27. Öztürk, S.; Kılınç, N. Pd thin films on flexible substrate for hydrogen sensor. J. Alloy. Compd. 2016, 674,
179–184. [CrossRef]
28. Sanger, A.; Kumar, A.; Kumar, A.; Jaiswal, J.; Chandra, R. A fast response/recovery of hydrophobic
Pd/V2O5thin films forhydrogen gas sensing. Sens. Actuator B Chem. 2016, 236, 16–26. [CrossRef]
29. Viespe, C.; Miu, D. Surface Acoustic Wave Sensor with Pd/ZnO Bilayer Structure for Room Temperature
Hydrogen Detection. Sensors 2017, 17, 1529. [CrossRef]
30. Srivastava, S.; Kumar, S.; Singh, V.; Singh, M.; Vijay, Y. Synthesis and characterization of TiO2 doped
polyaniline composites for hydrogen gas sensing. Int. J. Hydrog. Energy 2011, 36, 6343–6355. [CrossRef]
31. Marcu, A.; Nicolae, I.; Viespe, C. Active surface geometrical control of noise in nanowire-SAW sensors. Sens.
Actuator B Chem. 2016, 231, 469–473. [CrossRef]
32. Mao, S.; Zhou, H.; Wu, S.; Yang, J.; Li, Z.; Wei, X.; Wang, X.; Wang, Z.; Li, J. High performance hydrogen
sensor based on Pd/TiO2 composite film. Int. J. Hydrogen Energy 2018, 43, 22727–22732. [CrossRef]
33. Wei, X.B.; Yang, X.H.; Wu, T.; Pang, H.Y.; Lv, G.D.; Wu, S.H.; Li, S.B.; Chen, Z. A novel composite hydrogen
sensor based on Pd nanoclusters/TiO2 nanotube arrays. IOP Conf. Ser. Mater. Sci. Eng. 2017, 167, 12041.
[CrossRef]
34. Deepti; Kumarc, H.; Tripathi, A.; Dey, A.B.; Gupta, M.; Krishna, R.; Avasthi, D.K. Improved hydrogen sensing
behaviour in ion-irradiated Pd-Au alloy thin films. Sens. Actuators B Chem. 2019, 301, 127006. [CrossRef]Nanomaterials 2020, 10, 760 10 of 10
35. Marcu, A.; Viespe, C. Surface Acoustic Wave Sensors for Hydrogen and Deuterium Detection. Sensors 2017,
17, 1417. [CrossRef]
36. Riabinina, D.; Irissou, E.; Le Drogoff, B.; Chaker, M.; Guay, D. Influence of pressure on the Pt nanoparticle
growth modes during pulsed laser ablation. J. Appl. Phys. 2010, 108, 034322. [CrossRef]
37. Jakubik, W.; Powroznik, P.; Wrotniak, J.; Krzywiecki, M. Theoretical analysis of custom electrical sensitivity in
SAW gas sensors with single and bi-layer structures. Sens. Actuator B Chem. 2016, 236, 1069–1074. [CrossRef]
38. Fan, H.; Ge, H.; Zhang, S.; Zhang, H.; Zhu, J. Optimization of sensitivity induced by surface conductivity
and sorbed mass in SAW gas sensors. Sens. Actuator B. Chem. 2012, 161, 114–123. [CrossRef]
© 2020 by the authors. Licensee MDPI, Basel, Switzerland. This article is an open access
article distributed under the terms and conditions of the Creative Commons Attribution
(CC BY) license (http://creativecommons.org/licenses/by/4.0/).You can also read