Investor & Analyst Meet 2021 - GAIL (India) Ltd. June 10, 2021, New Delhi - GAIL ( India)
←
→
Page content transcription
If your browser does not render page correctly, please read the page content below

GAIL (India) Ltd.

Investor & Analyst Meet 2021
         June 10, 2021, New Delhi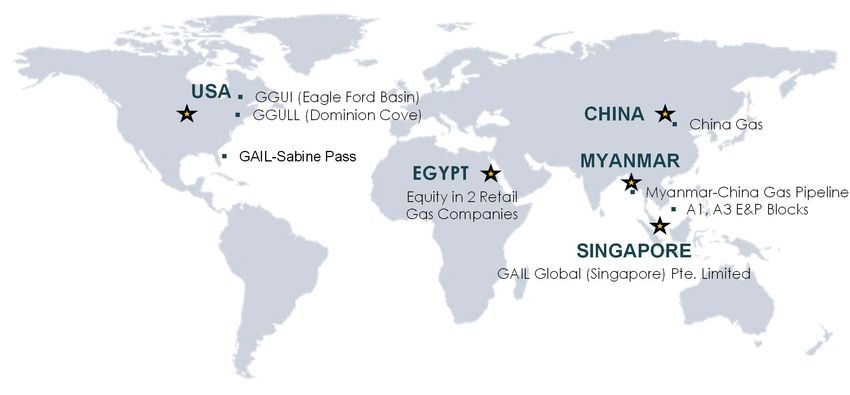
Safe Harbor Statement
This presentation has been prepared by GAIL (India) Ltd (Company or GAIL) solely for providing
information about the Company.

The information contained in this presentation is only current as of its date. Certain statements made
in this presentation may not be based on historical information or facts and may be "forward-looking
statements", including those relating to the Company’s general business plans and strategy, its future
financial condition and growth prospects, and future developments in its industry and its competitive
and regulatory environment. Actual results may differ materially from these forward-looking
statements due to a number of factors, including future changes or developments in the Company’s
business, its competitive environment, information technology and political, economic, legal and
social conditions in India.

This communication is for general information purposes only, without regard to specific objectives,
financial situations and needs of any particular person. Company do not accept any liability
whatsoever, direct or indirect, that may arise from the use of the information herein.

The Company may alter, modify or otherwise change in any manner the content of this presentation,
without obligation to notify any person of such revision or changes

                                                                                                 2
Company Mission & Vision

                                                  Be the leader in
Enhancing quality of                              natural gas value-
life through   clean                              chain and beyond,
                            Mission   Vision
energy and beyond                                 with global presence,
                                                  creating value for
                                                  stakeholders     with
                                                  environmental
                                                  responsibility
Table of Contents
1   Company Overview

2   Performance Highlights

3   Industry Outlook & Strategy
Company Overview

                   5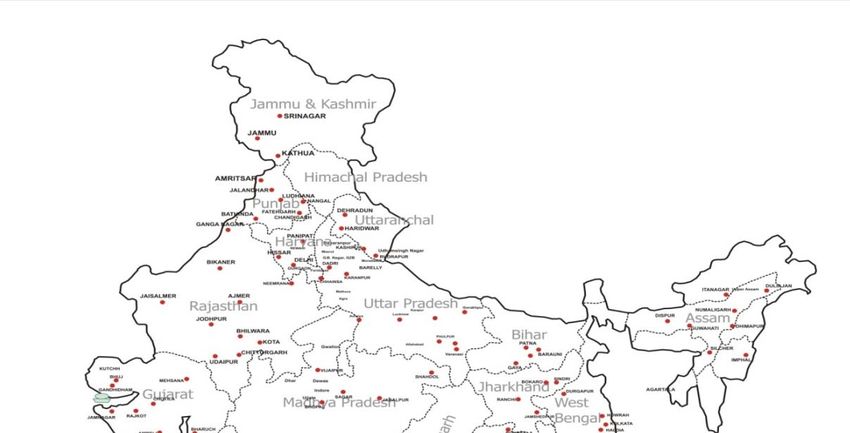
0 0 0 0 0
1 2 3 4 4
Major Business Portfolio
Gas Transmission Petrochemicals Liquid
E&P Renewables
& Marketing Hydrocarbons
Over 13,389 KM ~14% domestic Five LHC Participation in 118 MW of Wind
of Gas Network market share Processing Plants 12 Blocks Power Capacity
Long Term Capacity of 810 1.4 MTPA of Presence in US & 12.26 MW of
Portfolio of ~14 KTA at Pata & Capacity Myanmar Solar Power
MMTPA 280 KTA at BCPL 3.8 MMTPA of LPG Capacity
Transmission
Capacity
Global Presence
USA GGUI (Eagle Ford Basin)
GGULL (Dominion Cove) CHINA China Gas
GAIL-Sabine Pass MYANMAR
EGYPT
Equity in 2 Retail Myanmar-China Gas Pipeline
Gas Companies A1, A3 E&P Blocks
SINGAPORE
GAIL Global (Singapore) Pte. Limited
Sustainable Development In 2021, Vaghodia became the first GAIL location to get Silver rating by CII GreenCo. GAIL embarked upon the journey of adoption of Green Co Rating in FY19-20. GAIL won the leaders award at the ‘Frost and Sullivan and TERI’s Sustainability Awards’ held in 2020. GAIL also won the Investor Relation Award under the category of ESG disclosures in 2021. A pilot project of urban afforestation using the Miyawaki techniques has been initiated to address the issue of Pollution, Carbon sink development, and Restoration of biodiversity. GAIL is exploring various opportunities in Production and Marketing of Compressed Biogas from Organic waste. Under the same light, GAIL and Ranchi Municipal Corporation (RMC) have signed a concession agreement in March 2021 for setting up CBG Plant
Shareholding Pattern
Others, 7.47%
GDR, 0.71%
Market Capitalization as on 31st Mar’21 : ` 60,189 crore
PRESIDENT OF
INDIA, 51.45%
180 7
160 6
FPI, 15.52%
Share volume (in Millions)
140
Price (in Rs/Share)
5
120
Paid up Equity
100 4
` 4,440.39 crore
LIC, 8.87%
80 3
60
FINANCIAL
2
INSTITUTIONS/BA
40
NKS, 0.16% 20 1
0 0
MUTUAL
IOC, 2.45%
FUNDS/UTI, 8.46% ONGC, 4.91%
Volume Share Price
Year FY17 FY18 FY19 FY20 FY21 GAIL bought back ~ 6.98 crore shares at a price of Rs. 150 during FY 2020‐21
Dividend Shareholding of President of India came down from 51.76 % to 51.45 % as on
Pay-out Ratio 43.82 35.05 30.01 43.60 45.76 31st of March’21 on account of Buyback
(%)
Source: BSE Website; Note: Shareholding pattern & other data as on 31st Mar 2021 as per BSE website;
.
Corporate Social Responsibility (CSR)
MAJOR HIGHLIGHTS
1. GAIL UJJAWAL (Education Centric Initiatives):
180 meritorious & marginalized students received residential coaching at GAIL
Utkarsh centres for admission into IITs/NITs and other Engineering colleges.
2. GAIL KAUSHAL (Skill Initiatives):
More than 600 candidates trained at GAIL Institute of Skills at Nagaram
(Rajahmundry) and Guna (MP) in skill trades related to Hydro Carbon,
Automotive, telecom, etc.
Provided support towards collaborative project with MoP&NG and PSEs on
contribution to Skill Development Institutes (SDIs) at Rae Bareli, Bhubaneshwar
and Vishakhapatnam.
3. GAIL AROGYA (Health & Sanitation Initiatives):
59 Mobile Medical Units (MMUs) operated across 42 districts in 13 States of India,
in from remote rural pockets of the country.
TB Eradication programme: Support provided for eradication of TB in villages
GAIL CSR endeavours are embodied under GAIL around Auraiya & Firozabad districts in Uttar Pradesh and in villages around
Barpeta & Darrang districts in Assam.
Hriday Umbrella. Distribution of 913 assistive aids and devices to more than 600 Divyangjans
through camps at Auraiya (UP) and Haridwar (Uttarakhand)
GAIL has achieved spends of Rs. 145.22 crs (2.05%), 4. OTHER FOCUS AREAS:
against mandated 2% (Rs. 141.91 crs.).
Disaster management related activities: Financial support of Rs. 56.09 crores
towards alleviation of COVID-19 pandemic through various initiatives, viz.
contribution to PM CARES Fund, distribution of ration kits, PPE kits/sanitizers/masks,
etc. to district administration and hospitals, medical equipment like ventilators to
Govt. Hospitals, awareness activitiesBattle Against Covid ‐19
Projects/contributions worth Rs. 80 cr. for relief activities related to COVID-19
Contributed Rs. 50 cr. towards PM CARES FUND
Various projects worth Rs. 30 cr. Undertaken (oxygen cylinder, concentrators, PSA plants etc.)
Super Specialty ICU unit set up with GAIL’s CSR Support in Dakshina Kannada, Karnataka
Support extended for setting up Quarantine Ward set in Rajahmundry, Andhra Pradesh
Various activities were undertaken near GAIL’s major work centres in NCR (Delhi), UP (Auraiya, Varanasi), MP (Guna,
Jhabua), Gujarat (Gandhar, Vadodara), AP (East Godavari), Jharkhand (Ranchi, Bokaro, Giridih, Chatra, etc), Kerala
(Kannur, Palakkad), Puducherry, Karnataka (Dharwad, Bangalore), Rajasthan(Jaipur) etc.
More than Nearly More than More than Around
14,000 15,000 50,000 3,00,000 48,000
ration kits distributed PPE kits distributed sanitizer bottles distributed masks distributed gloves provided to frontline
health workers
Medical equipment such as ventilators, multi parameter monitoring equipment, pulse oximeters, etc. provided to HospitalsBattle Against Covid ‐19 Support extended for providing COVID vaccine related cold chain equipment for Madhya Pradesh [23 nos. Deep freezer (small) & 01 No Refrigerated Truck] and Tripura [16 nos. Ice Lined Refrigerators (small)] Under the initiative of MoPNG, GAIL is setting up PSA oxygen plants in 12 government hospitals across 4 states of Uttar Pradesh (Auraiya, Prayagraj, Ayodhya, Lakhimpur Khiri, Kasganj), Karnataka (Tumkur, Chikkaballapur), Rajasthan (Dholpur) and Madhya Pradesh (Guna, Panna, Sidhi and Bhind) at a cost of approx. Rs. 10 crores Under the initiative of MoPNG, GAIL has been designated to procure 25,000 set of Oxygen cylinders, regulators, high flow nasal cannula and non-rebreather masks; GAIL’s share being aproxx. Rs. 8 crores GAIL is also participating in the initiative of providing 1000 Oxygen concentrators at a cost Rs. 6.5 crores which is being carried out jointly with other Oil and Gas PSUs GAIL is supporting import of liquid medical oxygen, by aiding hiring of ISO containers for transport of liquid oxygen (LOX) Vaccination drive organized across GAIL for vaccination of employees, their family members & contract workers Provided financial Assistance towards the educational, medical needs & other relief measures to the wards of the deceased GAIL employees
Performance Highlights

                         13
Major Highlights for FY 2020‐21 Hon'ble PM dedicated Kochi-Mangaluru Section of KKMBPL on 5th January’21 & Dobhi- Durgapur Section of JHBDPL at Durgapur to the nation on 7th February ‘21 Received NIL Comments from CAG for the Accounts of FY 2019-20 (11th year in a row) Received Investor Relation (IR) Awards from IR Society under ESG Category GAIL won the 2nd Position under the category Manufacturing Public Mega & GAIL Jaipur won 1st Position under Category Transmission and logistics in 17th National Awards for Excellence in Cost Management – 2019 organized by ICMAI GAIL honoured with Golden Peacock Award Excellence in Corporate Governance-National category Direct Tax disputes for 21 years have been applied for settlement under Vivad se Vishwas Scheme
Major Highlights for FY 2020‐21 Cont..
Interim Dividend for FY 2020-21 is Rs. 5 per share amounting to Rs. 2,238 crore

GAIL successfully closed the Buyback of equity shares worth 2.5% of Net worth at ~ Rs. 1,274
crore (Incl. Tax)

Capex for FY 2020-21 ~ Rs. 7,000 crore, Part of JHBDPL Project (Dobhi- Durgapur Main Line) &
KKMBPL Ph-II capitalized

Share swap between GAIL and NTPC completed whereby GAIL has exited from RGPPL and
GAIL's shareholding in KLL has increased to 92.15 %.

Cumulative Capital Grant received till FY21 stood at Rs. 4,337 crore out of Rs. 5,176 crore

Credit Rating – Domestic ‘AAA’, International ‘Baa3’ (Moody’s), BBB- with (-)ve outlook (Fitch)-
Equivalent to sovereign rating of India.
Physical Performance
                 Gas Volume Trend                                                   Gas Marketing Mix                     Gas Transmission Mix
                                                      (MMSCMD)

            105              107          108        104
100                                97           96                                                                                      1%
                                                            89                                   10%
                                                                                                  FY21
      81          85                                                                                                                  8%
                                                                                           9%                                    8%
                                                                                                                                0%              38%
                                                                                          10%      FY21    48%                         FY21
                                                                                           0%

                                                                                            23%                                  45%

FY17         FY18       FY19     FY20                FY21
                                                                             APM/NAPM           RLNG      PMT      Spot   Mid Term      Overseas Sales
       Gas Transmission     Gas Marketing

       Petrochemicals Sales                                 Liquid Hydrocarbons Sales                                 LPG Transmission
                                                                                                                                                  (TMT)

                                                                  1,276   1,329   1,263
                                           871                                             1,138                                                 4,163
                       735         737                 1,082                                                          3,721   3,975     3,909
           674                                                                                              3,362
 577

FY17       FY18    FY19            FY20    FY21            FY17   FY18    FY19    FY20     FY21             FY17      FY18    FY19      FY20      FY21
Gas Sourcing & Sector Wise Supply
FY 2019‐20 FY 2020‐21
(Total 84.60 MMSCMD, % share) (Total 80.28 MMSCMD, % share)
35.41 MMSCMD
42.62 MMSCMD
42% 47%
58% 53%
49.19 MMSCMD 37.66 MMSCMD
38% 42%
23% 20%
19% 20% 17% 21%
21.22 24
4.12
1.8 8.27 2
2 9
15.18 14.33 15
10.57 9.11 10 11 7
Fertilisers Power CGD for CNG & PNG Others* Fertilisers Power CGD for CNG & PNG Others*
Domestic RLNG %age Share
Imported Gas primarily consists of Long Term RLNG, Mid Term RLNG and Spot
Major sources for domestic gas are ONGC (APM & MDP),Ravva, Ravva satellite, CBM etc.
Highest demand of Natural Gas from Fertilizer, Power & CGD companies
* Others include Steel, Refineries, Sponge Iron, Petrochemicals, GAIL Internal consumption etc. 17Financial Performance (Standalone)
(in Rs. crore)
Turnover (Gross) Gross Margin (PBDIT)
74,808 71,730 10,774 9,887
56,529 8,649 8,450
48,789 53,690 7,287
FY17 FY18 FY19 FY20 FY21 FY17 FY18 FY19 FY20 FY21
Profit Before Tax (PBT) Profit After Tax (PAT)
9,085 6,621
7,943 6,026
6,958 6,386 4,618 4,890
5,411
3,503
FY17 FY18 FY19 FY20 FY21 FY17 FY18 FY19 FY20 FY21Balance Sheet as on 31st March 2021
( in Rs./crore)
Assets Equity & Liabilities
73,310 73,310
Non Current Current Equity Liabilities
Assets Assets 46,611 26,699
63,657 9,653
Equity Share Non Current Current
PPE 33,375 Other Equity
Capital Liabilities Liabilities
42,171
CWIP 11,903 4,440 15,482 11,217
Investments 9,255
Others 9,124 Retained Earnings 36,889
General Reserves, BRR etc. 2,155
Transition Reserve & OCI 3,127
Capital Employed Net Worth* Loan Outstanding$
` 56,973 crore ` 43,379 crore ` 5,991 crore
* as per companies’ Act, $ Incl. Short term loanKey Financial Ratios
PAT to Net Worth (in %) Return on Capital Employed Debt to Equity Ratio
( in %)
18
15 16 15 15 0.16
13 13 0.14
11 11 11
0.09
0.06
0.03
FY17 FY18 FY19 FY20 FY21 FY17 FY18 FY19 FY20 FY21 FY17 FY18 FY19 FY20 FY21
Earning Per Share (in Rs./Share) Share Price (in Rs./Share) Market Capitalization (in Rs./crore)
164 174
14 15 141 136 74,102 78,319
11 63,669 60,189
10
8 77 34,525
FY17 FY18 FY19 FY20 FY21 FY17 FY18 FY19 FY20 FY21 FY17 FY18 FY19 FY20 FY21Financial Performance (Consolidated Basis)
(in ` crore)
Turnover (Gross) Gross Margin (PBDIT)
12,818
75,912 72,414 11,657
10,079
57,208 8,758
49,237 54,556 7,237
FY17 FY18 FY19 FY20 FY21 FY17 FY18 FY19 FY20 FY21
Profit Before Tax Profit after Tax
9,422
9,831 10,429 6,546 6,136
6,936 7,725 4,799
5,183 3,368
FY17 FY18 FY19 FY20 FY21 FY17 FY18 FY19 FY20 FY21Capital Expenditure Profile
FY 2020‐21 FY 2021‐22E (in ` crore)
~ 7,000 Cr. ~ 6,600 Cr.
500, 8%
1,285 , 18%
750, 11%
200, 3%
200, 3%
764, 11%
200, 3%
93, 1%
119, 2%
262, 4%
4457, 64%
4750, 72%
Pipeline City Gas Distribution (Equity) Petrochemical E&P Equity Investments Operational Capex
* capital expenditure include plan, non‐plan and operational capexIndustry Outlook
Natural Gas Segment
23Global Energy Consumption ‐ Comparison
Figures rounded off
Region Oil Natural Gas Coal Nuclear Energy Hydro electric Renewables
World 33.1% 24.2% 27.0% 4.3% 6.4% 5.0%
Asia Pacific 27.8% 12.2% 47.5% 2.2% 6.2% 4.2%
China 19.7% 7.8% 57.6% 2.2% 8.0% 4.7%
India 30.1% 6.3% 54.7% 1.2% 4.2% 3.5%
India & China are in the process of diversifying the primary energy mix and increasing share of
cleaner natural gas & renewables
(Source: BP Statistical World energy Review, 2020)Global energy demand growth from emerging
economies
Currently, China biggest driver of global energy consumption (24%) followed by US (17%), EU (12%), Middle
East (6.65), India (5.9%) & Russia (5.2%)
Going Forward :-
• India is expected to be largest source of energy demand growth out to 2050.
• India’s primary energy consumption is expected to grow by more than 100%.
• Energy Intensive industrial activities may get relocated from the developed world & China to India &
other emerging economies in Asia Pacific.
Global trend is towards a lower carbon fuel mix, higher carbon prices and supportive policy & investor
environment.
The role of natural gas will be crucial as a source of (near) zero-carbon energy with possibility to produce
blue and green hydrogen
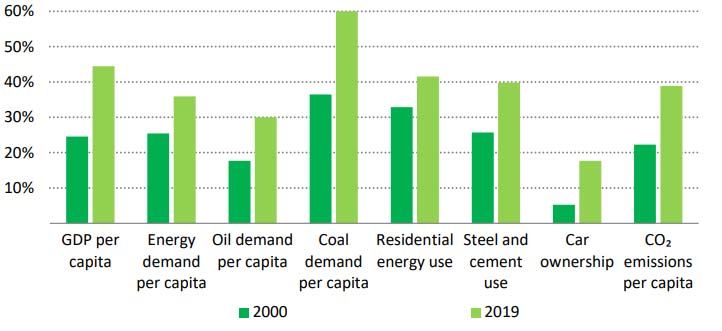
Source: BP Energy Outlook 2020, BP Statistical Review 2020Energy demand growth – Indian context
Selective Indicators for India Key Indicators as a % of Global Average
• Energy consumption has more than doubled since 2000, propelled upwards by a growing population
and a continuous period of rapid economic growth. Covid-19 impact expected to be mitigated Q4
2021 onwards.
• Over 80% of India’s energy needs are still met by three fuels: coal, oil and solid biomass
• Despite low per capita CO2 emissions, India is the third‐largest global emitter of CO2
• In line with global trends, share of natural gas and renewable to increase in India’s primary energy
basket from the current level of 6.31% and 3.55% respectively
Source: India Energy Outlook 2021, IEAIndia is among the top 13 gas consuming countries globally
1 BCM = 2.74 MMSCMD
Gas Consumption
Top 15 Gas consuming countries globally in (in BCM) Growth Share of gas in PE Pipeline Length
2020 2008‐19 (%) (KM)
2008 2019
1 US 628.9 846.6 2.7% 32.2% 500,000
2 Russian Federation 422.7 444.3 0.7% 53.7% 180,000
3 China 81.9 307.3 13.2% 7.8% 105,000
4 Iran 125.8 223.6 5.9% 65.2% 22,000
5 Canada 89.3 120.3 2.8% 30.5% 110,000
6 Saudi Arabia 76.4 113.6 3.9% 37.1% 4,000
7 Japan 99.1 108.1 1.6% 20.8% 4,500
8 Mexico 60.0 90.7 3.9% 42.3% 16,000
9 Germany 89.5 88.7 ‐0.4% 24.3% 28,000
10 United Kingdom 97.8 78.8 ‐2.1% 36.2% 30,000
11 United Arab Emirates 58.0 76.0 2.5% 56.6% 4,000
12 Italy 80.9 70.8 ‐1.5% 40.0% 22,000
13 India 40.0 59.7 3.8% 6.3% 18,200
14 Egypt 39.3 58.9 4.2% 54.6% 8,000
15 South Korea 37.3 56.0 4.5% 16.3% 4,000
Source: BP Statistical Review 2020Natural gas consumption – Historical & Present
Natural Gas Consumption in India (MMSCMD)
In MMSCMD
200
176 175
180 162 167 166
157 153 Others, 31.91, 19%
160 143 141 143
140 127 Fertilizer, 48.72, 30%
120 109
95
100 90 85 85 87 88 Petrochemical, 8.42, 5% Sectoral
79 83 76
80 68 75 93 90 Breakup
51 58
60 49 48 49 FY21
40 Refinery, 21.67, 13%
20
0 Power, 29.69, 18%
FY12 FY13 FY14 FY15 FY16 FY17 FY18 FY19 FY20 FY21 CGD, 25.29, 15%
Net Domestic Production Total consumption LNG Imports
• GoI targeted increase of Gas share to 15% in Primary Energy mix
• Gas along with Renewables has an important role in achieving commitment of emission intensity
reduction under COP 21
• Gas can play the role of bridge fuel and grid balancing to balance upcoming renewable capacity
additions
Source: PPAC (NG consumption includes IC of upstream producers aggregated in Others)Structural Reforms towards a Gas Based Economy
Enhancing domestic gas production
Pricing guidelines for domestic gas
Marketing & Pricing freedom - difficult & new fields (HPHT)
Discovered Small Field
Coal Bed Methane
Developing gas infrastructure
Completion of National Gas Grid
North East Gas grid (IGGL) through SPV model
Capital grant to incentivize development in difficult areas
Building new LNG import facilities
Development of CGD networks
Promoting Bio-CNG (SATAT) as a new source of supply
Improving Market Access
Gas Trading Exchange (GTE)
E-bidding platform
Transport System Operator (TSO) envisaged to manage Common Carrier Capacity
Possible Rationalization of tariff to benefit consumers & operators
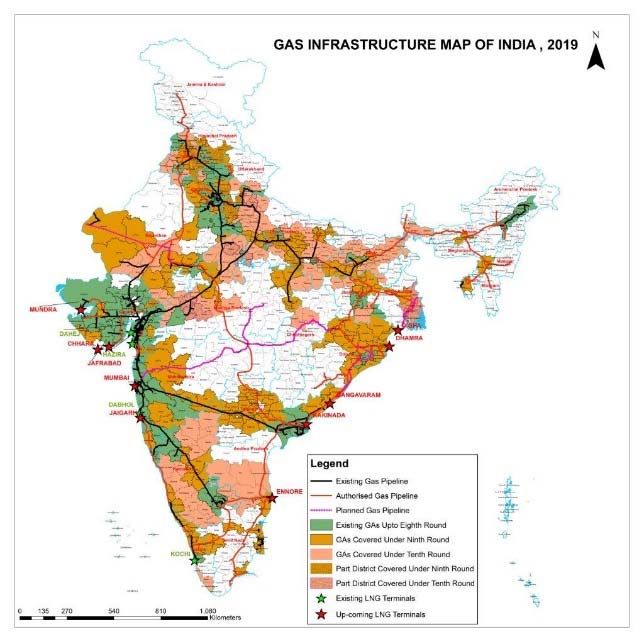
Tax related aspects under considerationOne Nation‐One Grid ‐ Infrastructure Expansion on‐
going
Ladakh UT
J & K UT
LNG Terminals (2014)
Existing Pipelines (2014)
New Pipelines laid (2019)
New LNG Terminals (2019)
Under Construction P/L
Approved P/L
North East Grid (SPV)
Envisaged
Upcoming terminals
(length of pipelines in km)CGD is focus area to grow in coming years
CGD in India after 9th & 10th Round (March 21)
• 41 Entities ‐ 407 Districts ‐ 232 GAs
• Expansion is under progress to cover 70% of population and 53%
of geographic area
• Target to provide 42 million additional DPNG connections and
8000 CNG stations by 2030 (9th & 10th Round MWP)
• 5000 compressed Bio‐gas (CBG) production plants also envisaged
under SATAT.
GAIL’s presence in CGD
• Executing 20 CGD GAs (6 – JHBDPL, 14 – GAIL Gas)
• Presence in 61 GAs through JVs/Subsidiaries
• 52.58% (13.03 MMSCMD) of Gas supplied to CGD industries in FY
2020 ‐ 21
• Operating 1689 out of 3101 CNG Stations (55%)
• Operating 65% of total 78.20 lakhs domestic PNG connections
Source : PNGRBPetrochemical Segment
32Petrochemical Business Outlook
Indian Petrochemicals industry likely to reach $ 250 billion by 2025
India’s per capita consumption of plastics is just 11 kg vs. China per capita consumption of 45 kg.
World average per capita consumption of Plastics is ~30 Kg with US consuming as high as 109 Kg per capita
Future Polymer demand growth is estimated ~6-7% p.a: Upside for Plastics in general and GAIL in particular
India’s per capita consumption is one of the lowest in Asia
India has big potential to grow & many opportunities
Major Highlights of GAIL’s Petrochemical Business in FY 2020‐21
Sold 1177 KTA of polymers (871 KTA ‐ GAIL & 306 KTA ‐ BCPL)
Exports of polymers ‐ 11,155 MTs during the year. (GAIL‐ 9,225 MTs & BCPL – 1,930 MTs)
Other Initiatives
Skill Development Program on “Plastic Product Manufacturing” with CIPET
Productivity Enhancement Program at customer premises
Growth drivers coupled with Capacity addition will result in growth in Top line as well as Bottom line for
GAIL.
Source: Study by Assocham & Industry EstimatesPetrochemical Business Outlook
Indian HDPE & LLDPE Demand v/s Capacity
HDPE+LLDPE Actual Projections
(in KTA) 2019‐20 2020‐21 2021‐22
Indian HDPE & LLDPE
Demand
HDPE (1) 2,530 2,690 2,860 demand is higher than
LLDPE (2) 2,391 2,631 2,876 capacity and gap is expected
HDPE + LLDPE 4,921 5.321 5,736
to increase further.
Capacity*
HDPE + LLDPE 5,210 5,210 5,370
Source : CPMA
PE demand grew at around 7‐8%
Indian PE consumption to Surpassed its Capacity in 2020‐21 but will be in deficit in 2021‐22
HMEL’s PE plant (1,250 KTA) is likely to be commissioned by 2022‐23
Future demand drivers for 7% growth in PE
• Packaging Industry
• Ecommerce driving packaging
• Automobile /Construction Industry
• Agriculture Industry
Source: Study by CPMA & Industry EstimatesOur Touch Points
For Institutional Investors For Retail Investors
& Analysts
Shri R K Jain, Shri A K Jha,
Executive Director (Finance & Accounts) Company Secretary
E-mail ID: rk.jain@gail.co.in E-mail ID: ak.jha2@gail.co.in
GAIL (India) Ltd.
16, Bhikaiji Cama Place, R.K. Puram, New Delhi-110066
www.gailonline.com
35You can also read