Current chance of unprecedented monsoon rainfall over India using dynamical ensemble simulations
←
→
Page content transcription
If your browser does not render page correctly, please read the page content below
Environmental Research Letters

LETTER • OPEN ACCESS

Current chance of unprecedented monsoon rainfall over India using
dynamical ensemble simulations
To cite this article: Shipra Jain et al 2020 Environ. Res. Lett. 15 094095

View the article online for updates and enhancements.

                                 This content was downloaded from IP address 176.9.8.24 on 28/09/2020 at 15:01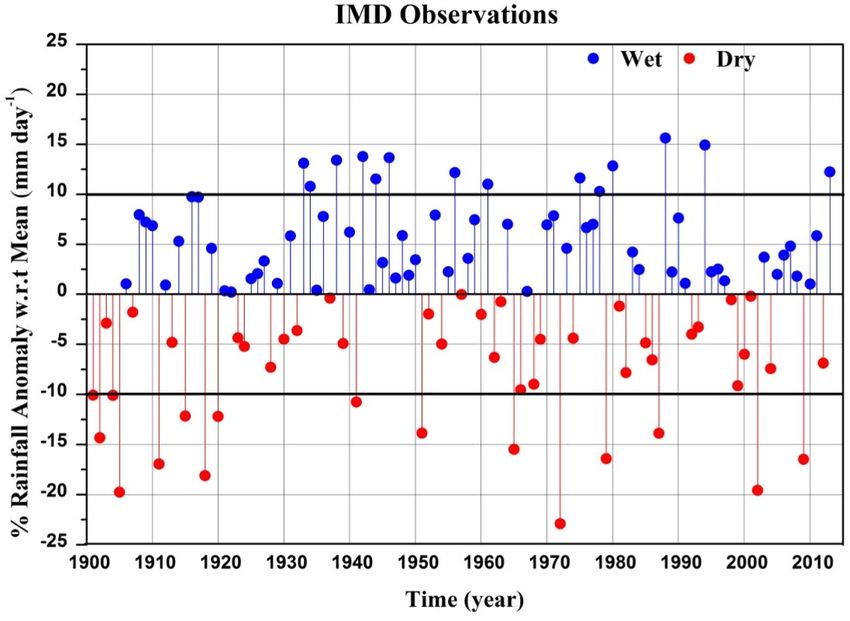
Environ. Res. Lett. 15 (2020) 094095 https://doi.org/10.1088/1748-9326/ab7b98
Environmental Research Letters
LETTER
Current chance of unprecedented monsoon rainfall over India
OPEN ACCESS
using dynamical ensemble simulations
RECEIVED
23 August 2019 Shipra Jain1,2, Adam A Scaife3,4, Nick Dunstone3, Doug Smith3 and Saroj K Mishra1
REVISED 1
17 February 2020 Centre for Atmospheric Sciences, Indian Institute of Technology Delhi, Hauz Khas, Delhi, India
2
School of Geosciences, University of Edinburgh, Edinburgh EH9 3FF, United Kingdom
ACCEPTED FOR PUBLICATION 3
2 March 2020
Met Office Hadley Centre, Fitz Roy Road, Exeter EX1 3PB, Devon, United Kingdom
4
College of Engineering, Mathematics and Physical Sciences, University of Exeter, Exeter, Devon, United Kingdom
PUBLISHED
3 September 2020 E-mail: shipra.npl@gmail.com
Keywords: Climate Historical Forecasts Project, seasonal hindcasts, extreme rainfall, seasonal predictions, multimodel ensemble
Original content from
this work may be used
under the terms of the
Creative Commons
Attribution 4.0 licence.
Abstract
Any further distribution In the past, India has suffered severe socio-economic losses due to recurring floods and droughts
of this work must
maintain attribution to
during boreal summer (June–August). In this analysis, we estimate the chance of extreme summer
the author(s) and the title rainfall, i.e. flood and drought over India for the present climate using the UNprecedented
of the work, journal
citation and DOI. Simulated Extremes using ENsembles (UNSEEN) method. This is the first application of the
method to the hindcasts from multiple coupled atmosphere-ocean models. We first test individual
models against the observed rainfall record over India and select models that are statistically
indistinguishable from observations. We then calculate the chances of floods, droughts and
unprecedented rainfall using 1669 realizations of summer precipitation from the selected set of
models. It is found that the chance of drought is larger than the chance of flood in the present
climate. There is a clear El Niño (La Niña) signal in dry (wet) summers and the occurrence of more
frequent and intense droughts than floods in both models and observations is partly due to El Niño
Southern Oscillation phase asymmetry. The chances of record-breaking drought and flood are
1.6% and 2.6%, respectively. There is also an estimated chance that a 30% rainfall deficit could
occur around once in two centuries, which is far beyond the record deficit over India.
1. Introduction in ensembles made for seasonal forecasting, here we
improve on the chances of extreme drought and flood
The human population of India is increasing at a than can be made from observations [see 2–5].
much faster rate than many other nations [1]. Sev- The Indian summer monsoon rainfall shows
eral sectors, such as food and agriculture, water large year-to-year fluctuations. Over the last cen-
and energy supply, employment, etc, are facing an tury or so (1901–2013), around 25% were drought
increase in demand due to this rapid increase in pop- or flood years, where droughts/floods are defined as
ulation. These sectors are directly or indirectly related the June–August (JJA) rainfall exceeding ±10% of
to the rainfall received over India during the sum- the long-term mean climatological rainfall over India
mer monsoon season (June–September) and there- (figure 1). For instance, 2002 and 2009 were both
fore there is a growing interest in the current chances severe drought years, with the JJA rainfall ~19% and
of extreme summer rainfall. Estimates of the chance ~16% below normal, respectively. The 2002 drought
of extreme rainfall can be of enormous help to the was the third largest over the last century and the
government to reform the policies that are affected impact of this drought was severe [6]. India faced
by the variations in rainfall and cater to the needs of phenomenal losses in agriculture and economy that
the increasing population. These estimates could be affected the lives of millions of people. The year 2002,
made using observations. However, the observations though extreme, was not unprecedented and there-
are just a single realization of the past evolution of the fore perhaps the possibility of this event could have
Indian summer monsoon and are therefore limited been anticipated in advance, but its probability would
to just one value per summer, giving high statistical be hard to estimate from observations as it is close to
uncertainty. By using perturbed model simulations the lowest recorded rainfall. Note that natural internal
© 2020 The Author(s). Published by IOP Publishing Ltd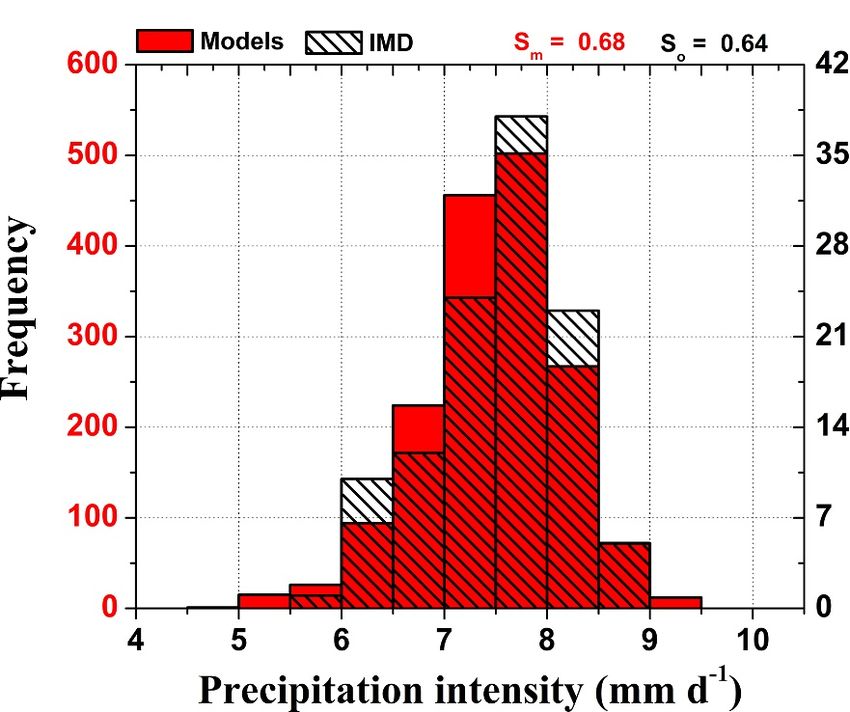
Environ. Res. Lett. 15 (2020) 094095 S Jain et al
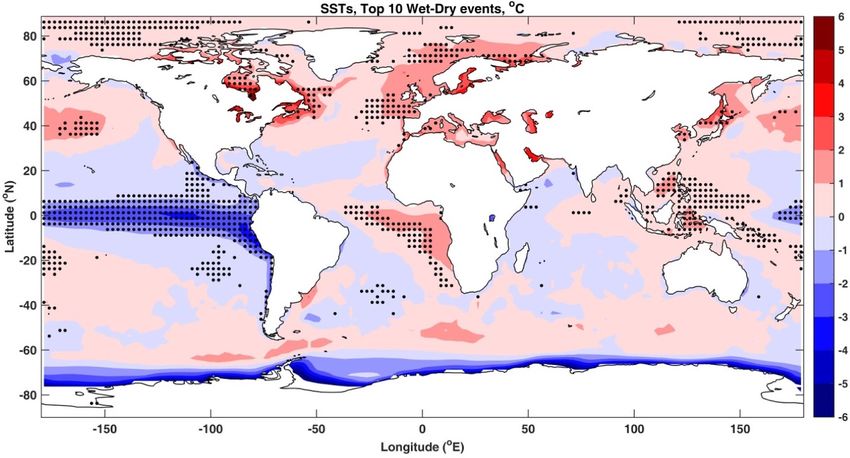
Figure 1. Observed Indian monsoon rainfall. Time series of the % rainfall anomaly with respect to the long-term climatological
mean rainfall for JJA using India Meteorological Department (IMD) observations.
variability is inherently present in all observations and method is that the dynamical circulation associated
cannot be ruled out as a cause of this drought [7]. In with the extreme events can be studied. For example,
principle, if a model simulates realistic rainfall and Thompson et al [3] showed that extreme hot sum-
has internal variability similar to the observations, mers over south-east China are either associated with
it should be possible to use large ensemble simula- the westward shift in western North Pacific subtrop-
tions to better determine the chances of such extreme ical high or the occurrence of a circumglobal sta-
events and the chances of events that are outside the tionary wave (Silk Road pattern), or both. This illus-
current range of the observed record. trates another advantage of the use of ensembles over
In this paper, we examine the possibility of extrapolating the observations outside their range;
drought or flood for any given summer using using model realizations allows unobserved dynam-
UNSEEN (UNprecedented Simulated Extremes using ical states and their remote teleconnections associated
ENsembles). The UNSEEN method, proposed by with the unprecedented events to be identified. Note
Thompson et al [4], is a statistical framework under that we estimate the chance of extremes by sampling
which the chance of unprecedented rainfall extremes the internal variability in current climate using a
can be estimated using a large ensemble of initial- large ensemble of simulations with current climate
ized climate simulations to sample a broad range of forcings.
internal variability. Thompson et al [4] have used this We estimate the chance of drought or flood for
method to estimate the chance of rainfall exceeding any given summer over India using the precipita-
the present record rainfall over the United Kingdom tion outputs from an ensemble of models, avail-
(UK) and showed that for any given winter, there able through the Climate Historical Forecast Project
is a 7% chance that the rainfall would exceed the (CHFP) [12]. It is worth noting that though this
observed record rainfall in at least one month over method has been applied to an ensemble of sim-
south-east England. Thompson et al [3] have also ulations from a single model, none of the studies
used this method to understand the chance of unpre- so far has applied it using a multi-model ensemble
cedented hot months in south east China and found (MME) or applied it to the Indian monsoon. Using
that for each summer, there is a 10% chance of an multiple models allows us to (a) increase the num-
unprecedented hot month. ber of samples compared to any single model or
Many studies have shown that the large inter- observations and (b) examine the driving dynam-
annual variations and occurrence of extremes in ical and meteorological conditions leading to extreme
temperature or precipitation may also arise due events in similarly forced models. The total number
to the dynamical circulation [e.g. 3,8,9] in addi- of summer rainfall realizations that are used to cre-
tion to the dynamical and thermodynamical for- ate the MME is 1669, which is more than an order of
cings [e.g. 10,11]. An advantage of the UNSEEN magnitude greater than the full observational record
2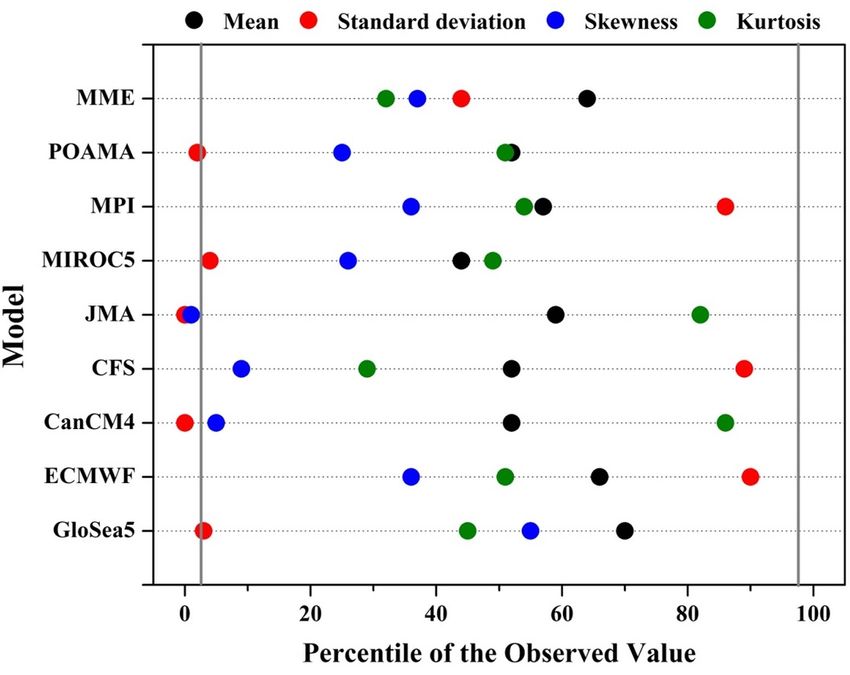
Environ. Res. Lett. 15 (2020) 094095                                                                                         S Jain et al

Table 1. Details of the rainfall data used in this study. The models that pass the UNSEEN fidelity test are highlighted in bold. The MME
is from models that pass the test.

                                                                        Ensemble       Total (model)
Model/Source        Centre, Country             Period, years           members            years          Reference

GloSea5,            MetOffice, UK               1992–2012, 21                24               504         MacLachlan et al (2015)
ECMWF-S4            ECMWF, UK                   1981–2010, 30                15               450         Molteni et al (2011)
CanCM4              CCCma, Canada               1979–2008, 30                10               300         Von Salzen et al (2013)
CFS                 NOAA, USA                   1981–2007, 27                 7               189         Saha et al (2006)
JMA-CGCM2           MRI-JMA, Japan              1981–2010, 30                10               300         Takaya et al (2017)
MIROC5              CCSR, Japan                 1980–2011, 32                 8               256         Watanabe et al (2010)
                                                                                                          Imada et al (2015)
MPI-LR              MPI-ESM, Germany            1982–2011, 30                 9               270         Baehr et al (2015)
POAMA               CAWCR, Australia            1980–2009, 30                30               900         Cottrill et al (2013)
MME                 Multiple sources            1980–2012, 33                63              1669         shown above in bold
IMD                 India Meteorological        1901–2013, 113                1               113         Pai et al (2013)
(observations)      Department, India

(1901–2013) available over India. We first examine                    JJA and JJAS seasonal rainfall is 0.91). The JJA rain-
individual model performance in simulating the JJA                    fall anomalies exceeding ±10% of the long-term cli-
rainfall over India using the observations from the                   matological mean rainfall are considered as floods or
IMD. The models that pass our fidelity tests are then                 droughts [7]. For the current observational record
used to create a large multimodel ensemble, to estim-                 (1901–2013), the long term JJA climatological mean
ate the chance of flood or drought.                                   rainfall is ~7.503 mm day−1 . The record flood year
                                                                      was 1988 with JJA rainfall exceeding ~16% and the
2. Data                                                               record drought year was 1972 with JJA rainfall show-
                                                                      ing ~23% rainfall deficit with respect to observed
Observational rainfall is taken from the IMD                          climatological mean (figure 1). The rainfall values
0.25◦ × 0.25◦ daily gridded rainfall product [13],                    exceeding the current flood and drought record are
which is one of the longest observed rainfall data sets               referred as unprecedented.
over India. Pai et al [13] have compared these data                        The monthly Niño 3.4 index (centred-base
with four existing daily gridded data sets over India                 period) is obtained from the Climate Prediction
and found strong consistencies between the interan-                   Centre, National Oceanic and Atmospheric Admin-
nual variations and extreme seasonal mean rainfall in                 istration (NOAA). The definition of centred base
all the data sets.                                                    period is provided on the NOAA website. The
     The monthly mean hindcasts are taken from the                    data that support the findings of this study are
CHFP [12], which is a multimodel seasonal hindcast                    openly available at http://chfps.cima.fcen.uba.ar/ and
database established by the World Climate Research                    www.cpc.ncep.noaa.gov/data/indices/.
Programme (WCRP). The hindcasts, which are ini-
tialized around 1 May, have been used in this ana-                    3. Model fidelity
lysis. The precipitation and sea-surface temperature
(SST) outputs from eight different models are used                    Before using these models to study rainfall extremes,
for their corresponding hindcast periods (table 1).                   it is important to first assess whether they repres-
The GloSea5 hindcasts from the Seasonal-to-Decadal                    ent observed rainfall variability realistically or not.
climate Prediction for the improvement of European                    As standard in seasonal prediction, the precipitation
Climate Services (SPECS) database are available for                   time series from each model is first bias corrected
a longer hindcast period with a greater number of                     using the IMD observations for the corresponding
ensemble members compared to the CHFP and there-                      hindcast period. The bias correction is applied to
fore this larger data set has been used in this ana-                  each ensemble member, using the climatological dif-
lysis. The IMD data is available for the land region at               ference between the ensemble mean and observed
quarter degree resolution, whereas the model outputs                  rainfall for each model. The bias-corrected precipit-
are only available at 2.5◦ over both land and ocean.                  ation time series are then re-sampled to form 10 000
For the models’ area average, first the IMD data is res-              representative time series (of the same length) for
caled to 2.5◦ (resolution of the models) and the grid-                each model. Re-sampling for each individual model
points thus obtained are used to mask the model out-                  is done by randomly selecting an ensemble mem-
puts and calculate area averages. All results presented               ber precipitation from each year’s ensemble. The
in this paper are area averages for land only.                        representative time series are then used to obtain
     The seasonal average is taken from 1 June to 31                  the distributions of mean, standard deviation, skew-
August (JJA) for each year for both models and obser-                 ness and kurtosis for each model using all ensemble
vations (note that the correlation between observed                   members and all years. We also explain the fidelity

                                                       3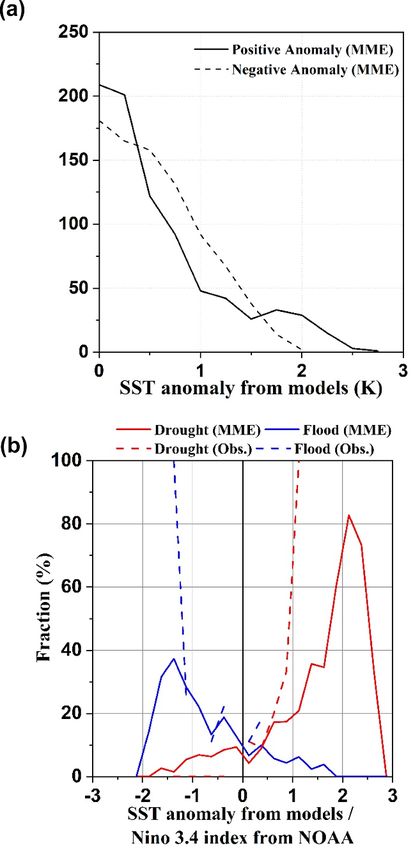
Environ. Res. Lett. 15 (2020) 094095                                                                                       S Jain et al

   Figure 2. Fidelity of ensemble predictions of Indian monsoon rainfall. Observed mean, standard deviation, skewness and kurtosis
   as a percentile of the model distribution for each model. Grey lines denote the percentile values at ±2.5%. Observed values are
   calculated using the full observational record, i.e. 1901–2013. Models that pass the tests (MPI, MIROC5, CFS, ECMWF and
   GloSea5) are used to calculate the metrics for the MME.

   Figure 3. Distribution of Indian monsoon rainfall in models and observations. Distribution of seasonal mean (JJA) bias-corrected
   precipitation (land only) for MME (red) and IMD observations (black). Sm and So show the standard deviation for MME and
   observations, respectively.

test for individual models using an example of                      bias correction. The 10 000 representative time series
the CFS model. First, the climatological difference                 of the same length (i.e. 27 years for the CFS model) are
between IMD and CFS ensemble mean precipitation                     created by randomly selecting one ensemble mem-
is calculated for the period 1981–2007. The mean                    ber precipitation for each year from 1981–2007. These
precipitation difference thus obtained is removed                   representative time series are then used to obtain the
from each ensemble member precipitation for the                     four statistical metrics given above.

                                                      4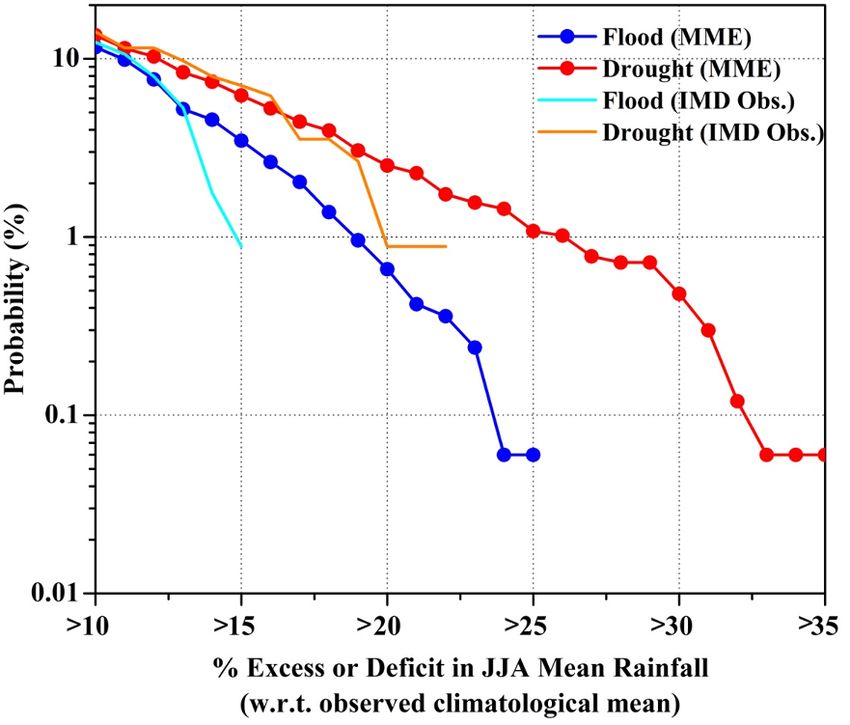
Environ. Res. Lett. 15 (2020) 094095                                                                                          S Jain et al

   Figure 4. Chances of extreme Indian monsoon rainfall. Probability (%) versus excess or deficit in bias-corrected JJA mean
   precipitation (%) with respect to the observed climatological mean rainfall. Orange, and light blue lines show the observed
   probabilities for drought and flood, respectively, for the IMD observational record (1901–2013). Probabilities are given on a
   log scale.

    Similar metrics are obtained for the IMD obser-                   illustrate that the MME and observed distributions
vations. Note that there is no significant trend in                   are statistically indistinguishable.
observed JJA mean rainfall or 11-year running stand-
ard deviation and therefore for IMD observations we                   4. Estimated chance of floods and
use the full-length observational record (1901–2013).                 droughts
The percentile of the observed value in the model dis-
tribution is identified and marked for all four tests                 The chances of flood and drought during a given sum-
(figure 2). The models for which the observation per-                 mer are now estimated from the MME. The probab-
centile lies within the 95% confidence interval (shown                ility versus percentage excess (or deficit) in rainfall
by grey lines in figure 2 at 2.5%–97.5%) of the model                 with respect to the observed JJA climatological mean
distribution for all four metrics are then taken to                   is shown in figure 4. The observed JJA mean rainfall
be statistically indistinguishable from the observa-                  is calculated for the full observational period (1901–
tions. Models whose distributions do not contain the                  2013). The flood and drought events are defined as
observed values are rejected. Figure 2 shows that five                the rainfall anomalies greater or less than 10% of the
models, MPI, MIROC5, CFS, ECMWF and GloSea5,                          observed mean [7] and therefore, in figure 4, we only
pass the tests for all measures, whereas the other                    show the probabilities for model rainfall exceeding
remaining models fail the test for skewness or stand-                 ±10%. The probabilities of the flood (light blue line)
ard deviation or both and therefore are not used. The                 and drought (orange line) in the observational record
MME is created using the precipitation output from                    are also shown. The chances of flood or drought are
these five models. For the MME, the re-sampling is                    much better sampled by the MME than the more lim-
done for the longest hindcast period possible, i.e.                   ited observed record and therefore give a smooth and
1980–2012. The percentile of the observed value for                   more statistically stable estimate of extreme rainfall
the selected MME is noted and shown at the top                        well beyond the level possible with observations. The
of figure 2. The MME is indistinguishable from the                    observations under-sample the probability of extreme
observations for all four metrics.                                    floods and droughts. The smaller ensemble from any
    Figure 3 shows the distribution of JJA mean pre-                  single model may also underestimate the chance of
cipitation from IMD observations (black hatched)                      high-intensity extremes and therefore we use the large
and the MME (red solid). Due to the much larger                       MME to sample the largest possible range of vari-
sample size of the MME, which is more than an order                   ability with these data. The MME indicates that the
of magnitude larger than the full observational record                chance of exceeding the worst drought (>23% defi-
length, the MME distribution is smoother than the                     cit) observed over the last century is ~1.6% and the
observed distribution and it samples extremes bey-                    chance of a record-breaking flood (>16% excess) is
ond the range of the observations. Figures 2 and 3                    2.6%. The data also suggest that there is even a chance

                                                       5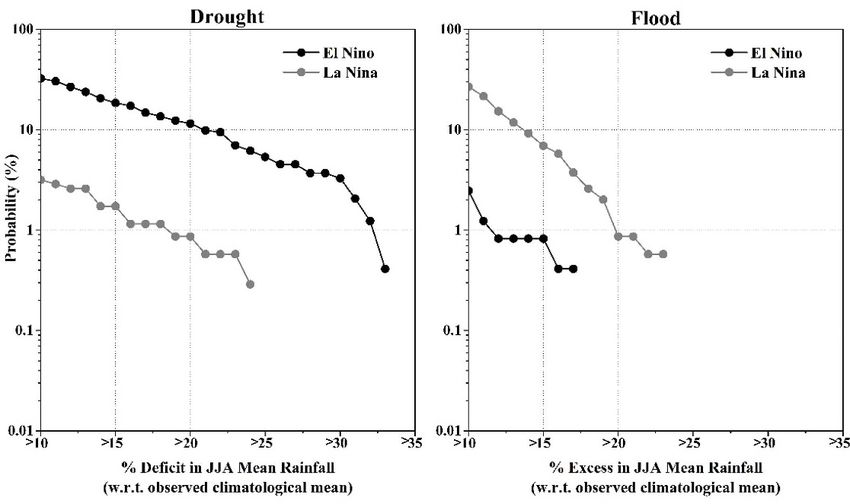
Environ. Res. Lett. 15 (2020) 094095                                                                                         S Jain et al

   Figure 5. Link between SSTs and extreme Indian summer monsoon rainfall. Difference in SSTs for the top ten extreme wet and
   dry summers in multimodel ensemble. Stippling denotes the differences that are significant at 95% confidence level using the
   two-tailed student’s t-test.

   Figure 6. Effect of ENSO on Indian monsoon rainfall. Probability (%) of drought (flood) versus deficit (excess) in bias-corrected
   JJA mean precipitation (%) with respect to the observed climatological mean rainfall for the MME. Black line is for El Niño years
   and grey is for La Niña years. Probabilities are given on a log scale.

of a 30% deficit of summer rainfall with a probabil-                 Indian summer monsoon [14–21]. To understand the
ity of once in two centuries (probability 0.5%). Such                dynamical conditions leading to the extreme rain-
a drought would be well beyond anything seen over                    fall events, we examine the global JJA SSTs for the
the last century and would have an unprecedented                     ten wettest and ten driest summers in the MME.
impact.                                                              The difference between the SSTs for composite wet
                                                                     and dry summers clearly shows the influence of
5. Dynamical conditions                                              ENSO on the rainfall extremes (figure 5). Lower SSTs
                                                                     over the tropical Pacific during wet summers indic-
The seasonal mean rainfall over India is known to                    ates the association of La Niña (El Niño) with the
be influenced by large-scale dynamical phenomena                     wet (dry) summers over India [22]. This shows that
in the oceans such as El Niño Southern Oscillation                   despite the reported non-stationarity of the observed
(ENSO) and the Indian Ocean Dipole (IOD), which                      ENSO-monsoon relationship over the last few dec-
drives some of the interannual variability of the                    ades [23], ENSO provides a clear impact on the

                                                       6
Environ. Res. Lett. 15 (2020) 094095 S Jain et al
chance of drought and flood in the Indian summer
monsoon.
Figure 4 suggests that as well as being stronger,
droughts are also more probable than floods in both
models and observations, and careful inspection of
figure 3 confirms this negative skewness. The prob-
abilities of drought (flood) with % deficit (excess)
in rainfall as estimated from the MME are shown
in figure 6 for El Niño and La Niña years separ-
ately. The ENSO years here are identified using the
Nino 3.4 index from NOAA. The model years with
Nino 3.4 index higher than +0.5 are identified as
El Niño and lower than −0.5 are identified as La
Niña. During the strong El Niño years, most ensemble
members for any given model show a large reduction
in JJA mean rainfall [see also 22], indicating higher
chance of drought, whereas the opposite is noted dur-
ing La Niña. Figure 6 also shows that the probabil-
ity of severe droughts during El Niño is higher than
floods during La Niña. By sub-sampling further, the
asymmetry between the drought and flood chance
can be partly attributed to the asymmetry in the
ENSO itself. Figure 7(a) shows the frequency of JJA
SST anomalies over the Nino 3.4 region (5◦ N–5◦ S,
170◦ W–120◦ W) from the models. Figure 7(a) con-
firms the asymmetry between El Niño and La Niña
events in models with El Niño events reaching greater
magnitude more frequently than La Niña events for
SST anomalies exceeding 1.6 K. Such asymmetry and
its possible causes were also demonstrated by Liang
et al [24].
The influence of ENSO on Indian summer mon-
soon rainfall increases with the amplitude of ENSO
anomaly and given that El Niño frequently reaches
larger amplitude than La Niña, a larger chance of Figure 7. SST and rainfall intensity. (a) SST anomaly (K)
frequency over the Nino 3.4 region from models. SST
drought is expected than flood. This can also be con- anomalies for each model are calculated using the ensemble
cluded from figure 7(b), which shows the chance of mean SST from that model (b) % fraction of flood and
flood and drought over India as a function of SST drought over India as a function of SST anomaly.
Precipitation (bias-corrected) anomalies for each model are
anomalies over the Nino 3.4 region from the MME. calculated with respect to ensemble mean precipitation
For each SST anomaly range, starting from −3.00 to (bias corrected) for that model. Flood is >10% and drought
isEnviron. Res. Lett. 15 (2020) 094095 S Jain et al
to create a large multimodel ensemble to estimate References
the chance of flood and drought in the present cli-
mate. Our results show that there is a 12% chance [1] United Nations, Department of Economic and Social Affairs,
Population Division 2019 World Population Prospects 2019
of flood and 14% chance of drought for any given Online Edition (https://population.un.org/wpp/
summer over India and the observations underestim- Publications/)
ate the chances of high-intensity flood or droughts. [2] Kent C, Pope E, Thompson V, Lewis K, Scaife A A and
We also examine the dynamical conditions in the Dunstone N 2017 Using climate model simulations to assess
the current climate risk to maize production Environ. Res.
most extreme wet and dry summers and detect a clear Lett. 12 054012
ENSO signal. Droughts are more likely than floods [3] Thompson V, Dunstone N J, Scaife A A, Smith D M,
due to the ENSO phase asymmetry and this asym- Hardiman S C, Ren H L, Lu B and Belcher S E 2019 Risk and
metry in summer-monsoon rainfall becomes more dynamics of unprecedented hot months in South East China
Clim. Dyn. 52 2585–96
severe as the intensity of the ENSO events increases. [4] Thompson V, Dunstone N J, Scaife A A, Smith D M,
The chance of an unprecedented drought in the cur- Slingo J M, Brown S and Belcher S E 2017 High risk of
rent climate is ~1.6% and unprecedented flood is unprecedented UK rainfall in the current climate Nat.
2.6%. ENSO is predictable at seasonal lead times and Commun. 8 107
[5] Van den Brink H W, Konnen G P, Opsteegh J D, van
so while our samples represent the large internal vari- Oldenborgh G J and Burgers G 2005 Estimating return
ability of the atmosphere, our results are conditional periods of extreme events from ECMWF seasonal forecast
on recent ENSO variability being representative of ensembles Int. J. Climatol. 25 1345–54
the current climate. Finally, there is also a chance of [6] Bhat G S 2006 The Indian drought of 2002—a sub-seasonal
phenomenon? Q. J. R. Meteorol. Soc. 132 2583–602
record-breaking drought with a 30% deficit, which [7] Gadgil S, Srinivasan J, Nanjundiah R S, Kumar K K, Munot
is expected to occur around once every two centur- A A and Kumar K R 2002 On forecasting the Indian summer
ies. The socio-economic impact of such a drought monsoon: the intriguing season of 2002 Curr. Sci.
on India would be well beyond anything that has 83 394–403 (https://www.jstor.org/stable/24106837)
[8] Yeh S W et al 2018 The record-breaking heat wave in South
occurred over the last century. Korea and its physical mechanism Mon. Weather Rev. 146
1463–74
[9] Yeo S R et al 2019 Two types of heat wave in Korea associated
with atmospheric circulation pattern J. Geophys. Res. 124
Acknowledgments 7498–511
[10] Deser C, Terray L and Phillips A S 2016 Forced and internal
The authors acknowledge the WCRP/CLIVAR Work- components of winter air temperature trends over North
America during the past 50 years: mechanisms and
ing Group on Seasonal to Interannual Prediction implications J. Clim. 29 2237–58
for establishing CHFP and the Centro de Investiga- [11] Merrifield A, Lehner F, Xie S P and Deser C 2017 Removing
ciones del Mar y la Atmosfera (CIMA) for provid- circulation effects to assess central US land-atmosphere
ing the model outputs (http://chfps.cima.fcen.uba.ar/ interactions in the CESM large ensemble Geophys. Res. Lett.
44 9938–46
DS). We also thank the modelling centres for mak- [12] Tompkins A M et al 2017 The climate-system historical
ing model outputs available through CHFP. The forecast project: providing open access to seasonal forecast
GloSea5 data are obtained from the SPECS database ensembles from centers around the globe Bull. Am. Meteorol.
and the Nino 3.4 index is taken from NOAA. AS has Soc. 98 2293–301
[13] Pai D S, Sridhar L, Rajeevan M, Sreejith O P, Satbhai N S
contributed equally as first author. SJ and SKM are and Mukhopadhyay B 2014 Development of a new high
supported by the DST Centre of Excellence in Cli- spatial resolution (0.25 × 0.25) long period (1901–2010)
mate Modeling, Indian Institute of Technology Delhi. daily gridded rainfall data set over India and its comparison
AS was supported by the Weather and Climate Sci- with existing data sets over the region Mausam 65 1–18
[14] Behera S K and Ratnam J V 2018 Quasi-asymmetric
ence for Service Partnership (WCSSP) India, a col- response of the Indian summer monsoon rainfall to opposite
laborative initiative between the Met Office, suppor- phases of the IOD Sci. Rep. 8 123
ted by the UK Government’s Newton Fund, and the [15] Goswami B N 1998 Interannual variations of Indian summer
Indian Ministry of Earth Sciences (MoES). SJ is grate- monsoon in a GCM: external conditions versus internal
feedbacks J. Clim. 11 501–22
ful to Prof Ruth Doherty for her support in the com- [16] Ju J and Slingo J 1995 The Asian summer monsoon and
pletion of this work. We also thank the two reviewers ENSO Q. J. R. Meteorol. Soc. 121 1133–68
and the editorial board member for providing their [17] Nigam S 1994 On the dynamical basis for the Asian
comments on this manuscript. summer monsoon rainfall-El Niño relationship J. Clim.
7 1750–71
[18] Saji N H, Goswami B N, Vinayachandran P N and Yamagata
ORCID iDs T 1999 A dipole mode in the tropical Indian Ocean Nature
401 360
Shipra Jain https://orcid.org/0000-0002-6715- [19] Walker G T 1924 Correlations in seasonal variations of
5096 weather. I. A further study of world weather Mem. Indian
Meteor. Dept 24 275–332
Doug Smith https://orcid.org/0000-0001-5708- [20] Webster P J and Yang S 1992 Monsoon and ENSO: selectively
694X interactive systems Q. J. R. Meteorol. Soc. 118 877–926
8Environ. Res. Lett. 15 (2020) 094095 S Jain et al
[21] Webster P J 1987 The elementary Monsoon Monsoons ed J S [23] Kumar K K, Rajagopalan B and Cane M A 1999 On the
Fein and P L Stephens (New York: Wiley) pp 3–32 weakening relationship between the Indian monsoon and
[22] Jain S, Scaife A A and Mitra A K 2019 Skill of Indian summer ENSO Science 284 2156–9
monsoon rainfall prediction in multiple seasonal prediction [24] Liang J, Yang X Q and Sun D Z 2017 Factors determining the
systems Clim. Dyn. 52 5291–301 asymmetry of ENSO J. Clim. 30 6097–106
9You can also read