Intensification of single cell storms prior to lightning onset - CentAUR
←
→
Page content transcription
If your browser does not render page correctly, please read the page content below
Intensification of single cell storms prior to lightning onset Article Published Version Creative Commons: Attribution 4.0 (CCBY) Open Access Courtier, B. M., Stein, T. H. M., Harrison, R. G., Hanley, K. E. and Wilkinson, J. M. (2019) Intensification of single cell storms prior to lightning onset. Atmospheric Science Letters, 20 (4). e873. ISSN 1530261X doi: https://doi.org/10.1002/asl.873 Available at http://centaur.reading.ac.uk/81227/ It is advisable to refer to the publisher’s version if you intend to cite from the work. See Guidance on citing . To link to this article DOI: http://dx.doi.org/10.1002/asl.873 Publisher: Wiley All outputs in CentAUR are protected by Intellectual Property Rights law, including copyright law. Copyright and IPR is retained by the creators or other copyright holders. Terms and conditions for use of this material are defined in the End User Agreement . www.reading.ac.uk/centaur CentAUR Central Archive at the University of Reading
Reading’s research outputs online
Received: 7 September 2018        Revised: 22 November 2018      Accepted: 23 November 2018
DOI: 10.1002/asl.873

RESEARCH ARTICLE

Intensification of single cell storms prior to lightning onset
Benjamin M. Courtier1                      | Thorwald H. M. Stein1 | R. Giles Harrison1 | Kirsty E. Hanley2 |
Jonathan M. Wilkinson3

1
University of Reading, Reading, UK
2
MetOffice@Reading, Reading, UK
                                                       Single cell storms in the United Kingdom can produce lightning, despite apparently
3
Met Office, Exeter, UK
                                                       only having developed to towering cumulus rather than cumulonimbus. Such mar-
Correspondence
                                                       ginal thunderstorms still present severe weather hazards but are difficult to identify
Benjamin Courtier, Department of Meteorology,          and predict and therefore provide a warning. Observations from the Met Office
University of Reading, RG6 6BB Reading, UK.            radar mosaic and ATDNet (Arrival Time Difference Network) show that these sin-
Email: benjamin.courtier@pgr.reading.ac.uk
                                                       gle cell storms demonstrate a characteristic increase in the area of high reflectivity
Funding information
                                                       storm core during the 15 min prior to the first lightning. By using the Met Office
Natural Environment Research Council, Grant/
Award Number: NE/L002566/1                             Unified Model to investigate reflectivity development in modelled storms, a micro-
                                                       physical explanation for the observed reflectivity increase is identified. During a
                                                       rapid reflectivity increase, the updraft area at the melting layer, the peak updraft
                                                       velocity and the storm graupel mass increase. The three quantities examined are
                                                       linked to each other and to the generation of charge within the storm. The produc-
                                                       tion of graupel is promoted by the increase in updraft area and charge separation is
                                                       enhanced by the faster peak updraft velocity. This explains some of the physical
                                                       differences between single cell storms that produce lightning and apparently similar
                                                       storm systems which do not. It also provides a new basis with which to predict
                                                       lightning hazard for marginal storms.

                                                       KEYWORDS

                                                       radar, Thunderstorm evolution

1 | INTRODUCTION                                                                        lightning and to predict when storms might become electri-
                                                                                        cally active.
Within the Untied Kingdom, marginal storms are developed                                    Numerous studies have examined multicellular thunder-
single cell convective storms that either produce a small                               storms (e.g., Carey and Rutledge, 1996; 1998; Bruning
number of lightning strikes or produce no lightning them-                               et al., 2007) or mesoscale convective systems (e.g., Cifelli
selves but appear similar to storms that do produce lightning.                          et al., 2002; Wang and Liao, 2006; Ely et al., 2008) in the
Therefore, marginal thunderstorms can be difficult to iden-                             United States or tropical regions and some have studied
tify early in their lifetime, before they produce lightning.                            lightning in supercells (e.g., Wiens et al., 2005; Stough
However, these marginal thunderstorms can still be destruc-                             et al., 2017) or within tropical cyclones (e.g., Lyons and
tive, for example Elsom et al. (2016) report that the first                             Keen, 1994; Black and Hallett, 1999; Cecil et al., 2002).
lightning strikes from a short-lived thunderstorm killed two                            There have, however, been comparatively few studies on
men near the peak of Pen-y-fan in Wales. On days with mar-                              simple single cell thunderstorms (e.g., Dye et al., 1986). Sin-
ginal storms, therefore, it is especially important to accu-                            gle cell thunderstorms should be the simplest version of con-
rately predict which storms will and will not produce                                   vection as there are no influences on a storm and its

This is an open access article under the terms of the Creative Commons Attribution License, which permits use, distribution and reproduction in any medium,
provided the original work is properly cited.
© 2019 The Authors. Atmospheric Science Letters published by John Wiley & Sons Ltd on behalf of the Royal Meteorological Society.
Atmos Sci Lett. 2019;20:e873.                                                                                              wileyonlinelibrary.com/journal/asl2   1 of 7
https://doi.org/10.1002/asl.873
2 of 7 COURTIER ET AL.
structure from competing storm cores and updrafts. It is two strikes, while some storms that initially appear similar to
hoped that observations of single cell storms will be infor- the lightning producing storms, produce no lightning at all.
mative for and applicable to more complex convection. The difference between the storms that produce a small num-
The primary process by which thunderstorms initially ber of lightning strikes and those that appear similar in track
become charged is broadly accepted to be through relative intensity and length but with no lightning presents a chal-
diffusional growth (Baker et al., 1987; Saunders, 2008; lenge to forecast.
Emersic and Saunders, 2010), which is a version of the non- In order to investigate the differences between “low
inductive charging (NIC) process. Dash et al. (2001) explain lightning” and “no lightning” convective storms, the Met
that differences in the growth of ice crystals and graupel Office radar network was used in conjunction with the Met
cause differences in the magnitude and the sign of charge Office Arrival Time Difference Network lightning observa-
contained at the surface of the particles. When ice crystals tions to examine storms (especially the mixed phase region)
and graupel particles collide, resulting in a small amount of prior to their producing lightning. Subsequently, model data
melted ice, charge can freely flow through the liquid equalis- from the Met Office UKV model was used to analyse
ing across the temporarily joined particles. As the particles the physical causes and consequences of the observed
separate again the liquid (and thus charge) is separated intensifications.
equally across the two particles creating a net unequal charge
in both particles.
Previous studies examining the onset of lightning using 2 | D A T A A ND M E T HO D
radar data have focused on reflectivity at certain isotherms
(see Mosier et al., 2011, table 1). However, frequently, thun- The domain is focused on the south of the United Kingdom
derstorms in the United Kingdom do not reach these high (specifically the Heathrow domain from Scovell and Al-
levels of intensity even when electrically active. Indeed, in Sakka, 2016). This is the part of the United Kingdom that
the United Kingdom, lightning can be observed in thunder- most frequently experiences thunderstorms (Cecil et al.,
storms with a maximum reflectivity of less than 40 dBZ. 2014). Two days of observations (August 6, 2012 and
These low reflectivity thunderstorms mean that the thresh- August 31, 2017) are used in total in this analysis.
olds referenced in Mosier et al. (2011) would regularly not
capture the onset of lightning. 2.1 | Radar composite
This less intense nature of the convection in the United
The Met Office 3D radar composite is compiled from the
Kingdom leads to weaker updrafts and to less graupel rou-
15 operational C-band radars in the Met Office network. It
tinely present in the convective clouds, and therefore fewer
has a 1 km resolution in the horizontal and 500 m resolution
electrified storms. This is exemplified by the storm tracks
in the vertical, extending to an altitude of 12 km (Scovell
and lightning strikes shown in Figure 1. There is only one
and Al-Sakka, 2016). Especially across the south of the
storm which produces more than 10 lightning strikes over its
lifetime. Instead, the majority of the storms produce one or United Kingdom, the coverage of this radar network is com-
prehensive with as many as four radars observing individual
pixels. The mosaic has a temporal resolution of 5 min allow-
ing for the representation of the evolution of thunderstorms.
Currently the only radar parameter included in the composite
is radar reflectivity. The composite was used to track storms
(see section 2.2) and storm cores and to examine the 3D
structure of lightning producing storms.
2.2 | Storm tracking
To allow for tracking of storms within the 3D mosaic, the
composite was condensed to a 2D composite. Each column
was represented by the 75th percentile of reflectivity above
2.5 km. As shown in Figure 2, using the 75th percentile
reduces the variability inherent to the maximum value in a
column while retaining the relevant information about the
most intense parts of the storm. Also the 75th percentile
retains information about the storm even if the convection is
FIGURE 1 The accumulated rainfall from the radar composite on August
relatively shallow, whereas the median must have a storm of
31, 2017 from 1200 to 1300, black crosses show the location of lightning at least 6 km depth before showing a signal. Ignoring the
strikes data below 2.5 km eliminates the potentially misleadingCOURTIER ET AL. 3 of 7
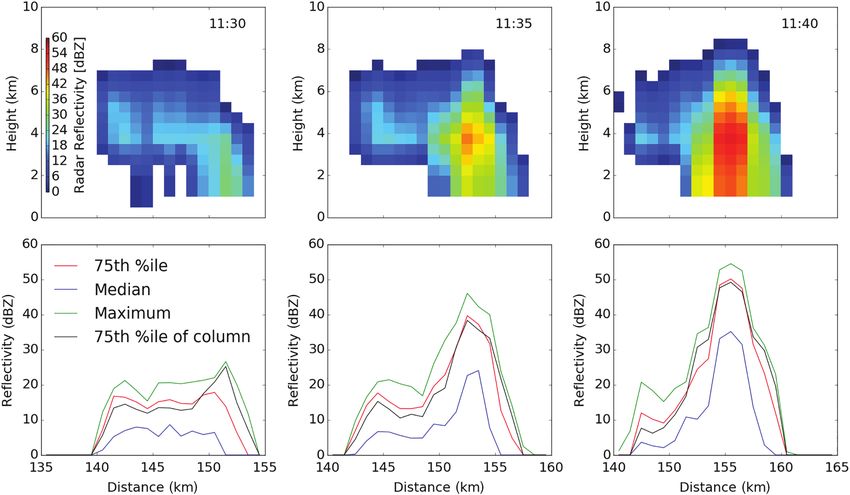
FIGURE 2 Top row shows radar cross sections through the most intense area of a single cell thunderstorm at the times indicated on August 6, 2012. Bottom
row shows methods of reducing the cross section to individual points. The median, maximum and 75th percentile (in red) only consider data above 2.5 km
(2.5–12 km) whereas the 75th percentile of column (in black) uses the entire column of data (0–12 km)
intensification of the melting layer (e.g., at 153 km in the 2.3 | Lightning data
top right panel of Figure 2) which contains little information The lightning data were also provided by the Met Office, via
about the microphysics of a thunderstorm (Mattos et al., the Arrival Time Difference Network (ATDNet). This is a
2016). It can be seen in Figure 2 that the more convective VLF detection network based on locating vertically
(1135 and 1140) timestamps have a smaller difference polarised sferics in the 10–14 kHz range (Lee, 1989). The
between the entire column method (the black line) and the polarisation gives the network less sensitivity to intra-cloud
above the melting layer method (the red line) than the more (IC) or cloud–cloud (CC) strikes compared to cloud to
stratiform timestamp (1130). ground (CG) strikes which tend to have stronger signals in
Storms were tracked in this 2D composite using the
the vertical.
tracking method from Stein et al. (2015); in this case the Lightning strikes were co-located with the radar compos-
storm edge was defined as the 5 dBZ contour (using the ite using latitude and longitude to match to the Cartesian
75th percentile above 2.5 km) and the minimum storm area radar grid, each strike was situated in a gridbox by finding
was 5 km2. In addition to the 5 dBZ contour to mark the the nearest grid box centre. Lightning strikes that occurred
cloud edge, a 25 dBZ contour was used to mark a storm core within a storm area and within the previous 5 min (to match
and used to calculate a storm core area. The storms were the radar interval) were associated with that storm. If a strike
then limited to single cell storms in order to reduce the could not be co-located with a storm or if, due to its location
impact of multiple storm cores interacting and thereby con- error (location error is specified for each individual strike, it
fusing the interpretation of the microphysics within the is typically 1–3 km), a strike was co-located with multiple
storm.
storms, the strike was discarded and ignored.
The lower limit for the storm size was chosen as no
storms with an area smaller than 9 km2 were observed to
produce a lightning strike (see Supporting Information S1). 2.4 | Model data
The 5 dBZ contour was chosen arbitrarily as a small enough The UKV is the Met Office convection-permitting imple-
reflectivity to include all of the cloud information while not mentation of the Unified Model (UM), run operationally
including noise. The 25 dBZ contour for the storm core over the United Kingdom (Tang et al., 2013). It is a variable
maximised the skill of using the intensification of the storm resolution model with a horizontal grid-length of 1.5 km in
core to predict lightning (see Supporting Information S2). the interior, extending to 4 km at the edges, with variable4 of 7 COURTIER ET AL.
height levels and a time step of 1 min. As a convection per- Half the number of storms that intensified before the onset
mitting model it includes microphysics relevant to convec- of lightning did so by 10–25 km2.
tion such as having three cloud ice species: crystals, As the only radar parameter available within the compos-
aggregates and graupel. The model can also output forward ite at the time of writing was radar reflectivity, more detailed
modelled radar reflectivity as an output diagnostic; this microphysical information than that already shown could not
enables the model output to be used in the storm tracking be obtained from observations. Therefore the Met Office
method used above for the radar observations. convection permitting UKV model was used to investigate
For the UKV simulations used here, the model was run the microphysics. The forward modelled reflectivity that is
with the 0400 UTC operational analysis as initial conditions, output from the UKV was compatible with the tracking algo-
with lateral boundary conditions provided by the 0000 UTC rithm used for the radar data, and so the same algorithm was
global model forecast. The model was run for 16 hr. The used to track storms in the model.
model data used were forward modelled reflectivity, graupel From the model, these isolated storms were found to
mass mixing ratio and vertical wind speed. These were all undergo a similar rapid intensification. Figure 4a shows the
output on the native model grid, with a 15-min temporal evolution of the storm core, from radar observations, until it
resolution. undergoes a rapid intensification (an increase of 10 km2 in
The radar shows lighter rain rates over larger areas and storm core area in 15 min or less), rather than until a light-
less intense heavy rain rates than the model. The model also ning strike as in Figure 3. There is some overlap between the
appears to be more clustered than the observations (see Sup- lines in Figures 3 and 4a, 34 of the 55 lines in Figure 3 are
porting Information S3). also included in 4a together with 37 other intensifying
storms. The intensification of the storm core was used, as
this measure could be replicated in the model (shown in
3 | RE SUL TS Figure 4b). The two means in Figure 4b, while slightly offset
in absolute storm core area, show similar increases in core
Figure 3 shows the area of the storm core prior to the first area within the final 15 min of the plots. The model plot
lightning strike of a storm. Each line represents the evolution shows an increase in core area from a mean of 7.6 km2 to a
of a separate thunderstorm core from first detection until the mean of 23.5 km2, within 15 min. The observations show an
time of first lightning strike (at time 0). The chart includes increase in core area from a mean of 3.2 km2 to a mean of
55 single cell thunderstorms, across 2 days of thunderstorm 17.4 km2 in 15 min, although the majority of this change
activity. Of these thunderstorms, only three had no change occurs within the final 5 min of the intensification. The
or a decrease in storm core area before the lightning strike. range of magnitudes of the intensifications was smaller than
Each of these three storms had no storm core per our defini- that in Figure 3, because by definition the intensifications
tion and maintained no core until producing lightning. Of were larger than 10 km2. About 95 and 90% of the intensifi-
the storms that increased in core are 39 out of 52 increased cations were between 10 and 25 km2 for the radar observa-
by 10 km2 or more, the most explosive storm increased from tions and model, respectively.
a core area of 6 km2 to a core area of 58 km2 in just 25 min. In Figure 4a the mean area of storm core in both panels
follows a similar path. The difference in temporal resolution
between the observations and the model means that the
observations appear to have more variability than the model
and appear to intensify slightly later than the model. How-
ever, the magnitude of the intensification is very similar
within the final 15 min and the final core area is approxi-
mately similar in both the model and the observations.
Therefore we, now investigate the simulated microphysical
properties to understand potential physical mechanisms
occurring during the observed intensifications.
Within the model, the graupel mass, the updraft area
greater than 1 m/s at the melting layer and maximum updraft
velocity in the storm core were measured before and after
the model intensifications. The differences across the intensi-
fication for all parameters were plotted in boxplots in
Figure 5. Each boxplot shows that approximately 75% of the
FIGURE 3 Lines showing the increase in storm core area for all single cell
storms increase in their respective parameter across an inten-
thunderstorms in the time before the onset of lightning at time 0, the bold sification. Each boxplot also shows that the distributions are
line shows the mean slightly positively skewed. Although in each parameter theCOURTIER ET AL. 5 of 7
FIGURE 4 Lines showing the storm core area before an intensification (defined as an increase of 10 km2 in storm core area in 15 min or less) for (a) radar
observations; and (b) the forward modelled radar output from the model. In both plots the black bold line shows the mean, in (b) the grey bold line shows the
mean from (a) at the same temporal resolution as the mean in (b)
lower quartile value is near 0, there is still a portion of the the fact that (as shown in Figures 3 and 4a) not all intensifi-
distribution that shows a decrease across an intensification. cations lead to the onset of lightning. Figure 5b tells us that
The boxplots in Figure 5 show, on average, for all of the at least a part of this increase in reflectivity is due to an
parameters examined in the model, an increase across an increase in graupel mass within the storm core. Linked to
intensification. This follows the expectation that as reflectiv- this is an increase in both updraft area and peak updraft
ity is increased and high reflectivity is observed over a larger velocity. These are again linked to the formation of graupel
area there must be more and/or larger particles present in the as supercooled liquid (lifted above the melting layer by the
cloud. The decreases shown in each variable may relate to updraft) is required to rime ice and thereby create graupel.
The riming process can feedback to the updraft through
releasing latent heat, thereby increasing buoyancy and the
updraft velocity. It can be surmised that during the process
of an intensification the increase in updraft area (causing an
increase in riming) creates an increase in graupel mass and
therefore an observable increase in radar reflectivity.
4 | DISCUSSION
4.1 | Thunderstorm electrification through rapid
intensifications
The rapid intensifications are important for thunderstorm
charging in particular because of the increase in graupel
mass and maximum updraft velocity shown in Figure 5. The
graupel is the most obviously necessary as (according to the
NIC theory) graupel and ice crystals must be present to sepa-
rate charge. The increase in graupel mass in the majority of
storms allows for the creation and storage of an increased
FIGURE 5 Boxplots showing the change in microphysical parameters amount of charge within the storm. This is especially impor-
across the intensifications (defined as an increase of 10 km2 in storm core tant for single cell storms as frequently before the storm
area in 15 min or less) observed in the model (as shown in Figure 4b). The underwent an intensification the mass of graupel present in
whiskers show the highest (lowest) datum within upper quartile +1.5 IQR the storm was too small to allow enough charge for a light-
(lower quartile –1.5 IQR): (a) shows the change in updraft area within the
ning strike (see Supporting Information S4). It is therefore
storm at the level of the melting layer (2.5 km); (b) shows the change in
graupel mass within the storm core, above the melting layer; (c) shows the
hypothesised that graupel mass is a limiting factor of thun-
change in maximum updraft velocity within the storm core, above the derstorm charging in the United Kingdom and therefore
melting layer lightning production within single cell storms.6 of 7 COURTIER ET AL.
The updraft velocity is also important for the charging size prior to the onset of lightning. Closer examination of
process, not just in the creation of graupel. A strong updraft the microphysics of similar intensifications simulated in the
is necessary to suspend large graupel particles after colli- Met Office UKV model show that the observed intensifica-
sional charging and to separate the graupel and ice crystals tions may be due to an increase in the graupel mass in the
through the lofting of ice crystals to the top of the cloud. storm core, this in turn is likely related to an increase in the
Further to this, Bruning and MacGorman (2013) speculate updraft area at the melting layer. Further, during the intensi-
that the turbulence created due to the shear at the edge of the fication, there is also an increase in the peak updraft velocity
updraft can help to cause charge separation through mixing which can cause turbulent mixing of graupel and cloud ice
of particles in turbulent eddies. This could be another mech- and aids the charging and charge separation processes. How-
anism by which the increase in updraft strength shown in ever, although almost all observations of lightning from sin-
Figure 5 promotes thunderstorm charging. gle cell thunderstorms were preceded by an intensification,
Therefore, both an increase in updraft area and in updraft not all intensifications led to lightning. Therefore, it is
strength are important for storm charging and therefore the assumed that there are other ingredients to the production of
onset of lightning. With just a broad weak updraft there may lightning from a small convective storm. Further work is
be a large amount of graupel formed, but no strength to sus- needed to identify the other processes that are necessary for
pend it while charge separation occurs and to allow separa- lightning production.
tion of the graupel from the cloud ice. However, equally, if
there is just a narrow strong updraft there may not be enough
graupel generation to allow for a significant amount of ACKNOWLEDGEMENTS
charge to be generated within the storm. We thank the Met Office for the provision of all the radar,
lightning location and UKV model output data used in this
4.2 | Low or zero lightning convective storms work, with particular thanks to Robert Scovell. This work
was supported by the Natural Environment Research Coun-
It is suggested that this intensification process is of such
cil through the SCENARIO DTP.
importance in the UK because of the limiting factor that
graupel mass appears to present to storm electrification.
Figure 1 shows that there are storms that produce one or two OR CID
lightning strikes, and some storms that look similar in reflec- Benjamin M. Courtier https://orcid.org/0000-0002-0644-4062
tivity but produce no lightning. The low lightning convec-
tive storms and zero lightning convective storms are a
unique challenge to forecast due to their marginality. How- REFERENCES
ever, the results of this study suggest that there is a possibil- Baker, B., Baker, M.B., Jayaratne, E.R., Latham, J. and Saunders, C.P.R. (1987)
The influence of diffusional growth rates on the charge transfer accompany-
ity to at least nowcast the onset of lightning in these storms
ing rebounding collisions between ice crystals and soft hailstones. Quarterly
with a lead of time of around 30 min. Journal of the Royal Meteorological Society, 113, 1193–1215.
In Figure 3 some storms can be observed to exist for Black, R.A. and Hallett, J. (1999) Electrification of the hurricane. Journal of the
90 min before eventually intensifying and then producing Atmospheric Sciences, 56, 2004–2028.
Bruning, E.C. and MacGorman, D.R. (2013) Theory and observations of controls
lightning, this further suggests that the intensification is vital on lightning flash size spectra. Journal of the Atmospheric Sciences, 70,
for storm electrification. However, in Figure 4a there are 4012–4029. https://doi.org/10.1175/JAS-D-12-0289.1.
also many storms that can be observed to intensify in a simi- Bruning, E.C., Rust, W.D., Schuur, T.J., MacGorman, D.R., Krehbiel, P.R. and
Rison, W. (2007) Electrical and polarimetric radar observations of a multicell
lar way to the lightning producing storms, without producing storm in TELEX. Monthly Weather Review, 135, 2525–2544. https://doi.
lightning (37 of 71 intensifications do not result in light- org/10.1175/MWR3421.1.
ning). Therefore, it is suggested that the intensification Carey, L.D. and Rutledge, S.A. (1996) A multiparameter radar case study of the
microphysical and kinematic evolution of a lightning producing storm. Mete-
(while necessary itself ) is not the only process that is
orology and Atmospheric Physics, 59, 33–64.
required to produce lightning in single cell storms. It is pos- Carey, L.D. and Rutledge, S.A. (1998) Electrical and multiparameter radar obser-
sible that in observing storm intensifications we are only vations of a severe hailstorm. Journal of Geophysical Research, 103,
observing one part of the entire lightning generation process 13979–14000.
Cecil, D.J., Zipser, E.J. and Nesbitt, S.W. (2002) Reflectivity, ice scattering, and
(i.e., the generation of the microphysical ingredients neces- lightning characteristics of hurricane eyewalls and Rainbands. Part I: quanti-
sary for electrification) and missing other steps, such as the tative description. Monthly Weather Review, 130, 769–784. https://doi.
charge separation and the triggering of lightning. org/10.1175/1520-0493(2002)1302.0.CO;2.
Cecil, D.J., Buechler, D.E. and Blakeslee, R.J. (2014) Gridded lightning clima-
tology from TRMM-LIS and OTD: dataset description. Atmospheric
Research, 135–136, 404–414. https://doi.org/10.1016/j.atmosres.2012.
5 | CON CLU SION S 06.028.
Cifelli, R., Petersen, W.A., Carey, L.D., Rutledge, S.A. and da Silva Dias, M.A.
F. (2002) Radar observations of the kinematic, microphysical, and precipita-
This work shows that marginal single cell storms in the UK tion characteristics of two MCSs in TRMM LBA. Journal of Geophysical
undergo a rapid intensification and increase in storm core Research, 107, 1–16.COURTIER ET AL. 7 of 7
Dash, J.G., Mason, B.L. and Wettlaufer, J.S. (2001) Theory of charge and mass Scovell, R. and Al-Sakka, H. (2016) A point cloud method for retrieval of high-
transfer in ice–ice collisions. Journal of Geophysical Research, 106, resolution 3D gridded reflectivity from weather radar networks for air traffic
20395–20402. management. Journal of Atmospheric and Ocean Technology, 33, 461–479.
Dye, J.E., Jones, J.J., Winn, W.P., Cerni, T.A., Gardiner, B., Lamb, D., Pitter, R. Stein, T.H.M., Hogan, R.J., Clark, P.A., Halliwell, C.E., Hanley, K.E., Lean, H.
L., Hallett, J. and Saunders, C.P.R. (1986) Early electrification and precipita- W., Nicol, J.C. and Plant, R.S. (2015) The DYMECS project: a statistical
tion development in a small, isolated montana cumulonimbus. Journal of approach for the evaluation of convective storms in high-resolution NWP
Geophysical Research, 91, 1231–1247. models. Bulletin of the American Meteorological Society, 96, 939–952.
Elsom, D.M., Webb, J.D.C., Enno, S.-E. and Horseman, A. (2016) Lightning Stough, S.M., Carey, L.D., Schultz, C.J. and Bitzer, P.M. (2017) Investigating
fatalities and injuries in the UK in 2015 and lightning safety advice for the relationship between lightning and mesocyclonic rotation in supercell
hill and mountain walkers. International Journal of Meteorology, 41, thunderstorms. Weather and Forecasting, 32, 2237–2259.
105–126. Tang, Y., Lean, H.W. and Bornemann, J. (2013) The benefits of the Met Office
Ely, B.L., Orville, R.E., Carey, L.D. and Hodapp, C.L. (2008) Evolution of the variable resolution NWP model for forecasting convection. Meteorological
total lightning structure in a leading-line, trailing-stratiform mesoscale con- Applications, 20, 417–426.
vective system over Houston, Texas. Journal of Geophysical Research, Wang, K.Y. and Liao, S.A. (2006) Lightning, radar reflectivity, infrared brigth-
113, 1–13. ness temperature, and surface rainfall during the 2–4 July 2004 severe con-
Emersic, C. and Saunders, C.P.R. (2010) Further laboratory investigations into vective system over Taiwan area. Journal of Geophysical Research:
the relative diffusional growth rate theory of thunderstorm electrification. Atmospheres, 111, D05206.
Atmospheric Research, 98, 327–340. https://doi.org/10.1016/j.atmosres. Wiens, K.C., Rutledge, S.A. and Tessendorf, S.A. (2005) The 29 June 2000
2010.07.011. supercell observed during STEPS. Part II: lightning and charge structure.
Lee, A.C.L. (1989) Ground truth confirmation and theoretical limits of an experi- Journal of the Atmospheric Sciences, 62, 4151–4177. https://doi.org/10.
mental VLF arrival time difference lightning flash locating system. Quarterly 1175/JAS3615.1.
Journal of the Royal Meteorological Society, 115, 1147–1166.
Lyons, W.A. and Keen, C.S. (1994) Observations of lightning in convective SUPPORTING I NFORMATION
supercells within tropical storms and hurricanes. Monthly Weather Review,
122, 1897–1916. https://doi.org/10.1175/1520-0493(1994)1222.0.CO;2 the Supporting Information section at the end of the article.
Mattos, E.V., Machado, L.A.T., Williams, E.R. and Albrecht, R.I. (2016)
Polarimetric radar characteristics of storms with and without lightning
activity. Journal of Geophysical Research: Atmospheres, 121, How to cite this article: Courtier BM, Stein THM,
201–220.
Mosier, R.M., Schumacher, C., Orville, R.E. and Carey, L.D. (2011) Radar now-
Harrison RG, Hanley KE, Wilkinson JM. Intensifica-
casting of cloud-to-ground lightning over Houston, Texas. Weather and tion of single cell storms prior to lightning onset.
Forecasting, 26, 199–212. Atmos Sci Lett. 2019;20:e873. https://doi.org/10.1002/
Saunders, C. (2008) Charge separation mechanisms in clouds. Space Science
asl.873
Reviews, 137, 335–353.You can also read