Prediction of precise subsoiling based on analytical method, discrete element simulation and experimental data from soil bin
←
→
Page content transcription
If your browser does not render page correctly, please read the page content below
www.nature.com/scientificreports

                OPEN              Prediction of precise subsoiling
                                  based on analytical method,
                                  discrete element simulation
                                  and experimental data from soil bin
                                  Nelson Richard Makange1,2, Changying Ji1*, Innocent Nyalala1, Idris Idris Sunusi1 &
                                  Samwel Opiyo1
                                  Prediction of a precise subsoiling using an analytical model (AM) and Discrete Element Method (DEM)
                                  was conducted to explain cutting forces and the soil profile induced changes by a subsoiler. Although
                                  sensors, AMs and DEM exist, there are still cases of soil structure deformation during deep tillage.
                                  Therefore, this study aimed to provide a clear understanding of the deep tillage using prediction
                                  models. Experimental data obtained in the soil bin trolley with force sensors were used for verification
                                  of the models. Experiments were designed using Taguchi method. In the AM, the modified-McKyes
                                  and Willat and Willis equations were used to determine cutting forces and soil furrow profile
                                  respectively. Calculations were done using MATLAB software. The elastoplastic behavior of soil was
                                  incorporated into the DEM. The DEM predicted results with the best regression of 0.984 R2 at a NRMSE
                                  of 1.936 while the AM had the lowest R2 of 0.957, at a NRMSE of 6.008. All regression results were
                                  obtained at p < 0.05. The ANOVA test showed that the p-values for the horizontal and vertical forces
                                  were 0.9396 and 0.9696, respectively. The DEM predicted better than the AM. DEM is easy to use and
                                  is effective in developing models for precision subsoiling.

                                 Nomenclature
                                 Ft 	Force exerted only in the direction of the axis of the upper arm (N)
                                 Ftx	Horizontal components of Ft (N)
                                 Fty	Vertical components of Ft (N)
                                 Fblh	Forces in the left lower hitch points axis (N)
                                 Fbrh	Forces in the right lower hitch points axis (N)
                                 Fblx	Horizontal forces on the left lower link (N)
                                 Fbly	Vertical forces on the left lower link (N)
                                 Fbrx	Horizontal forces on the right lower link (N)
                                 Fbry	Vertical forces on the right lower link (N)
                                 Fx	Horizontal (draught) force (N)
                                 Fy	The vertical force (N)
                                 a	The angle between the upper link and the horizontal line (°)
                                 b	The angle of the lower arms with the vertical axis (°)
                                 c	The angle of the lower arms with the horizontal axis (°)
                                 P	Total force (N)
                                 p	Initial soil density (kg/m3)
                                 G	Gravity (m/s2)
                                 d	Operating depth (m)
                                 C	Soil cohesion (kPa)
                                 Ca	Soil adhesion (kPa)
                                 q	Surcharge pressure (kPa)
                                 W 	Tool width (m)
                                 	Friction angle (°)

                                  1
                                   College of Engineering, Nanjing Agricultural University, Nanjing 210031, China. 2Department of Engineering
                                  Sciences and Technology, Sokoine University of Agriculture, P.O.BOX 3003, Morogoro, Tanzania. *email: chyji@
                                  njau.edu.cn

Scientific Reports |   (2021) 11:11082              | https://doi.org/10.1038/s41598-021-90682-w                                            1

                                                                                                                                        Vol.:(0123456789)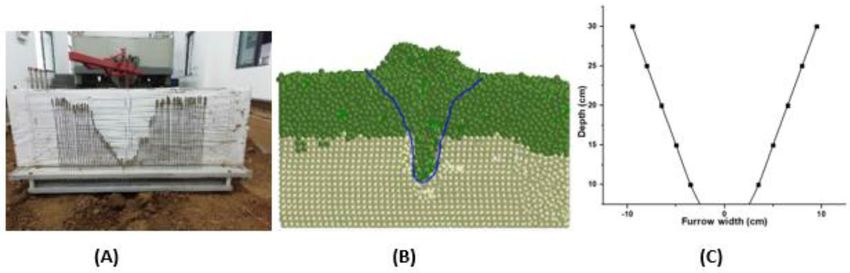
www.nature.com/scientificreports/
δ Soil-metal friction angle (°)
α Rake angle (°)
S Tool speed (m/s)
N Dimensionless factors relating to �, δandα
r Rupture distance (m)
Wf Width of the furrow (m)
k Constant which is equal to 0.0254
Precision agriculture is modern farming management which is a technology-enabled method that detects, meas-
ures and examines the needs of individual fields. It uses digital techniques to monitor and optimize agricultural
production processes. This brought up the need for smart agricultural machinery which are manufactured with
so many sensors to acquire the precise data measured. However, it leads to high operation costs and sometimes
low efficiency in precision control. To make the electro-hydraulic control in the tillage operation more precise,
engineers need to know the force distribution of the tillage tools reacting on the three-point hitch. Therefore,
instead of applying an equal amount of cutting force during tillage operation in every field, precision tillage
involves measuring the within-field soil strength variations and apply to the field a ccordingly1.
High soil strength often limits root propagation and prevents plants to obtain water and other resources
available in s ubsoil2. Subsoil strength tends to be naturally high because of the above soil column’s weight and
internal frictional forces3 mostly caused by compacted soil due to agricultural mismanagement4.
In recent years, the interest in understanding the mechanisms and prediction of soil tillage performance
has increased dramatically because of growing evidence and farmers’ concern that the soil structure’s quality is
adversely affected by agricultural machinery. In assessing the impacts of tillage operations, agricultural engineers
seek to predict the effect of soil-tool interaction. Non-inversion of soil has been controlled using tine implements
like subsoiler. Subsoiler is an implement that aims at loosening the soil structure and decreasing the bulk density
of the subsoil without turning or mixing soil horizons.
In the past two decades, attempts have been made to develop empirical, analytical, and numerical models for
soil-tool interactions used in the design of tillage tools to reduce the forces without considering the resulting soil
profile5–7. Since the machine sizes need to be optimized, the optimum between effort and result needs to be estab-
lished more intelligently. After tillage, the soil profile is a significant factor; it indicates and shows the outcome
of force applied by tillage tools, which provides knowledge about the soil movement and desired d isturbance8.
Analytical models represent a closed-form mathematical solution to the governing soil mechanics equation
subject to the input and output conditions. Numerical models are based on a numerical procedure, such as a
discrete element method. Empirical models involve physical experiments and regression equations. Some studies
have been conducted on optimizing the tillage process by reducing the tillage forces9.
In the analytical approach, equations were developed from a model to predict the effect of tool speed and
depth on the total, horizontal, and vertical forces. The model is based on three-dimensional soil wedges and is
in the general form of the Reece earth moving Equation. The model was developed b y10 and an additional term
11 6,11–13
was added to accommodate the effects of tool s peed . However, most of these researches were based on
finding the angle of the failure plane and the effect of the rake angle on soil cutting factors. Likewise, 14used an
analytical approach to predict soil profile parameters of trough formed by the passage of tines through the soil.
Sun et al.15 used the Discrete Element Method to study a bionic subsoiler energy consumption and soil dis-
turbance. Many other researchers used DEM to study subsoiler-soil interactions. With the relative errors of the
simulated results, less than 4%, 16,17proved that DEM was an effective way of predicting the draft force of subsoil-
ers. 18reported that after setting the proper values for the DEM parameters for a soil condition, the profile of the
soil failure that depends on the shank’s geometry can be satisfactorily simulated under the same soil condition.
This study aims to provide the base for improving deep tillage performance, structure, and working param-
eters of the non-inversion tool in cohesive soils. This study used an analytical model and a numerical model
to determine how much force is needed in tillage to help smart agricultural machinery designers to design a
machine according to the needs of the field. Further, the analytical and discrete element models were compared
in terms of their advantages and limitations. The suitability of the two models used in the analysis was also
determined based on the accuracy of predictions of forces required to cut the soil and the soil furrow profile
formed after passage of the subsoiler compared to the experimental data measured using force sensors and soil
profilometer respectively.
Materials and methods
Experimental materials. The test soil was classified as clay, which is agricultural soil. The average bulk
density and cone indexes were 1667.7 kg/m3 and 1342 kPa, respectively. Additionally, the moisture contents of
the topsoil and subsoil were 10.8% and 11.2%, respectively. The soil physical properties measured at the soil bin
are shown in Table 1.
A rectangular blade subsoiler was used in this study. The subsoiler blade formed an angle of 23° with the
ground, a circular arc subsoiler shank with a cutting-edge angle of 60° and a thickness of 30 mm. The schematic
diagram of the subsoiler shank with a circular arc of 400 mm is shown in Fig. 1.
Research methods. DEM simulation. The discrete element analysis software EDEM 2018 was used in
this study to develop a model that considers soil as discrete particles. The same soil properties used b y19 were
used to model the soil-subsoiler interactions. The particles in the model behaved in a linear elastic manner up to
a predefined stress, thereafter, the particles experienced plastic deformation. The contact model used was a hys-
Scientific Reports | (2021) 11:11082 | https://doi.org/10.1038/s41598-021-90682-w 2
Vol:.(1234567890)
www.nature.com/scientificreports/
Depth (mm) Bulk density (kg/m3) Cone index (kPa)
0–50 1463.7 325
50–100 1576.8 401
100–150 1665.4 788
150–200 1718.4 970
200–250 1728.5 1553
250–300 1734.2 2326
300 + 1787.4 3031
Average 1667.7 1342
Table 1. Soil physical properties measured at the soil bin.
Figure 1. Schematic diagram of the subsoiler shank.
teretic spring contact model integrated with a linear cohesion. The governing equations of the hysteretic spring
and linear cohesion contact model are described by20.
Firstly, the model’s calibration was done by matching the behavior of the angle of repose measured in the
laboratory and the one created in the EDEM simulation. In the laboratory, the angle of repose was measured
using the funnel filled with soil and raised slowly to form the conical shape of the material heap to minimize
the effect of the falling particles. After the heap reached a stable point, the angle of repose was measured by the
inverse tangent (arctan) rule at which the average radius of the formed conical shape and the maximum height of
the heaped material were measured, and then the angle of repose was determined as the arctan of the maximum
height to average radius ratio. Then, the same method of using funnel was simulated in the EDEM. The angle of
repose was measured using a protractor tool built-in EDEM Analyst.
The simulation parameters were obtained using an inverse parameterization method. Using the parameters
shown in Table 2, the simulation achieved an angle of repose of 36.87° by varying time step, soil-soil coefficient
of friction and soil-soil coefficient of rolling friction.
After calibration of the model using the angle of repose, a soil model was created and compacted to obtain
the bulk density, which is the same as that of the soil in the soil bin. A total of 79,824 spherical particles were
generated in the simulation to create a virtual soil bin having 1000 mm long × 500 mm wide × 400 mm depth.
The subsoiler geometry was made using PTC Creo Parametric 4.0 software21 and imported into the EDEM 2018
software to analyze force (Fig. 2). Afterward, the calibration parameters obtained were used to conduct the
simulation experiments to predict the horizontal, vertical cutting forces and the soil profile. The accuracy and
efficiency of the model were tested.
Scientific Reports | (2021) 11:11082 | https://doi.org/10.1038/s41598-021-90682-w 3
Vol.:(0123456789)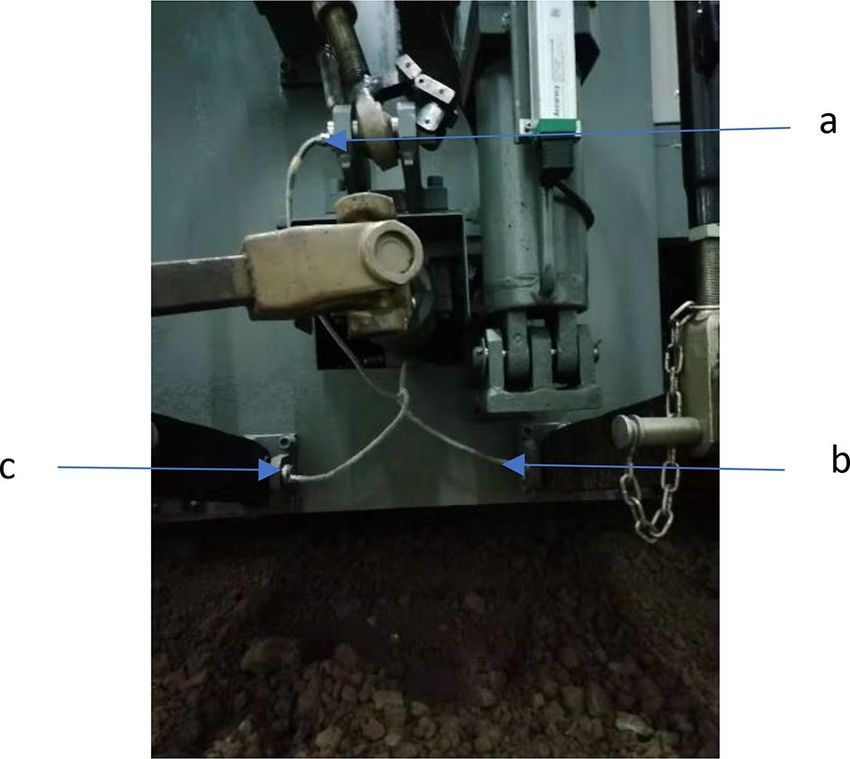
www.nature.com/scientificreports/
Parameter Value
Density of soil particle (kg/m3) 2650
Density of steel (kg/m3) 7850
Shear modulus of soil (Pa) 5 × 10⁷
Shear modulus of steel (Pa) 7.9 × 10¹⁰
Poisson’s ratio of soil 0.3
Poisson’s ratio of steel 0.3
Coefficient of restitution of soil-soil 0.2
Coefficient of static friction of soil-soil 0.45
Coefficient of static friction of soil-steel 0.55
Coefficient of rolling friction of soil-soil 0.13
Coefficient of rolling friction of soil-steel 0.05
Cohesion of the soil (kPa) 10
Table 2. Basic parameters of the discrete element model.
Figure 2. Setup of subsoiler geometry created using Creo Parametric 4.0 software, PTC Inc. (https://www.ptc.
com) and the virtual soil bin created using EDEM 2018 software, DEM Solutions Ltd. (https://www.edemsimula
tion.com/software/).
Analytical equation. The analytical equation (Eq. 1) developed by11 was used to obtain horizontal and vertical
forces. The parameters used in the equation were obtained from the soil bin experiments and the laboratory tests.
P = pgd 2 Nγ + CdNc + Ca dNca + qdNq + ρS2 dNa W (1)
where p , is the initial soil density (kg/m3), g is the gravity (m/s2), d is the operating depth (m), C is the soil
cohesion (kPa), Ca is the soil adhesion (kPa), q is the surcharge pressure (kPa), W is the tool width (m), N is the
dimensionless factors relating to (friction angle), δ (soil-metal friction angle) and α (the rake angle) and S is
the tool speed (m/s).
Using the MATLAB R2020a (The MathWorks Inc., Natick, MA), Eqs. (1–9) were solved for all terms to obtain
total force ( P ). The soil parameters were drawn from Table 1. The tool width for Eq. (1) was taken as the effective
width of the blade, 260 mm, and the rake angle was 16°. Similarly, the horizontal and vertical components of
the total force were calculated using Eqs. (12) and (13) 11. All dimensionless cutting factors were obtained from
the work presented b y 6.
Fx = P sin (α + δ) + Ca + Ca dW cot α (2)
Fy = P cos (α + δ) − Ca dW (3)
r 2s
1 + 3w sin (β + ϕ)
Nγ = 2d
(4)
sin (α + β + δ + ϕ)
cos ϕ s
sin β 1 + w
Nc = (5)
sin (α + β + δ + ϕ)
Scientific Reports | (2021) 11:11082 | https://doi.org/10.1038/s41598-021-90682-w 4
Vol:.(1234567890)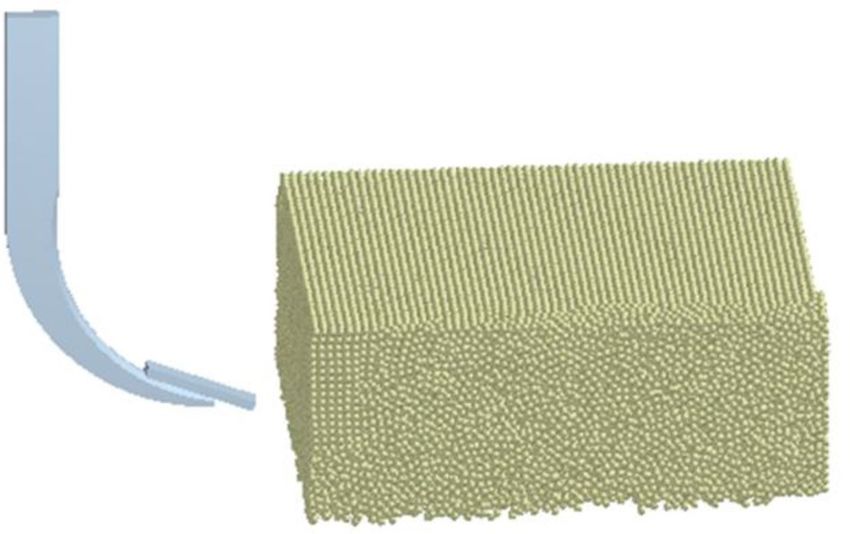
www.nature.com/scientificreports/
Figure 3. Sensors for force measurement at the three-point linkages behind the soil bin trolley (a) Top link (b)
Right lower link (c) Left lower link.
− cos (α + β + ϕ)
Nca = (6)
sin α sin (α + β + δ + ϕ)
r
1 + ws sin (β + ϕ)
Nq = d
(7)
sin (α + β + δ + ϕ)
(8)
S=d (cot β)2 + 2 cot α cot β
tan β + cot (β + ϕ)
Na = (9)
(cos (α + δ) + sin (α + δ) cot (β + ϕ))(1 + tan β cot α)
where Na is a dimensionless factor for soil inertia effect, is a function of α, δ, ϕ and β , and is given by Eq. (9).
Other notations, as mentioned previously.
Willatt and Willis14 developed an equation to predict the width of furrow for curved and plain tines, as shown
by Eq. (10). The furrow disturbed by both tines were roughly trapezoidal.
Wf = (2.42d + W) × k (10)
where Wf is the width of the furrow (m), d is the operating depth (m), W is the tine width (m), and k is a constant
and which is equal to 0.0254.
Experimentation for verification of the model. Verification tests were conducted under controlled conditions
using an indoor soil bin trolley set up with a PLC controller. All the tests were conducted between Septem-
ber 2019 and February 2020 at Nanjing Agricultural University, Agricultural Machinery Testing Center, Nan-
jing, Jiangsu Province, China. A trolley developed by the Nanjing Agricultural University was used to pull the
implement in the soil bin. Forces were measured by sensors placed at three points linkages, as shown in Fig. 3.
After that, the measured forces were resolved to obtain the force’s vertical and horizontal (draught) components.
Equations (11) to (20) show how forces were distributed in the trolley rear lifting links. The resolving of force
followed the method of force calculation provided by22.
The diagrams for the links of the soil bin trolley are presented in Fig. 3. The technical specification for the
KMB 40 force sensor used to measure cutting forces in the soil bin is shown in Table 3. The angles were varying
according to the depth of the implement.
Data acquisition for cutting forces at three-point linkages done by a PLC controller on the soil bin trolley
is shown in the flow chart (Fig. 4). The force sensor comprises a bearing bolt that encounters shear stress and
records as elongation and evaluated. The measurement principle is based on the measurement of mechanical
elongation using strain gauges, which are wired to form a bridge circuit within the force sensor. When not under
load, the bridge is in equilibrium while when a force is applied, the output signal of the DMS (database manage-
ment system) bridge changes, either positive or negative, according to the direction of the force applied. This
magnitude of the bridge voltage is proportional to the force used. The subsoiler attached to the soil bin trolley
is shown in Fig. 5.
Scientific Reports | (2021) 11:11082 | https://doi.org/10.1038/s41598-021-90682-w 5
Vol.:(0123456789)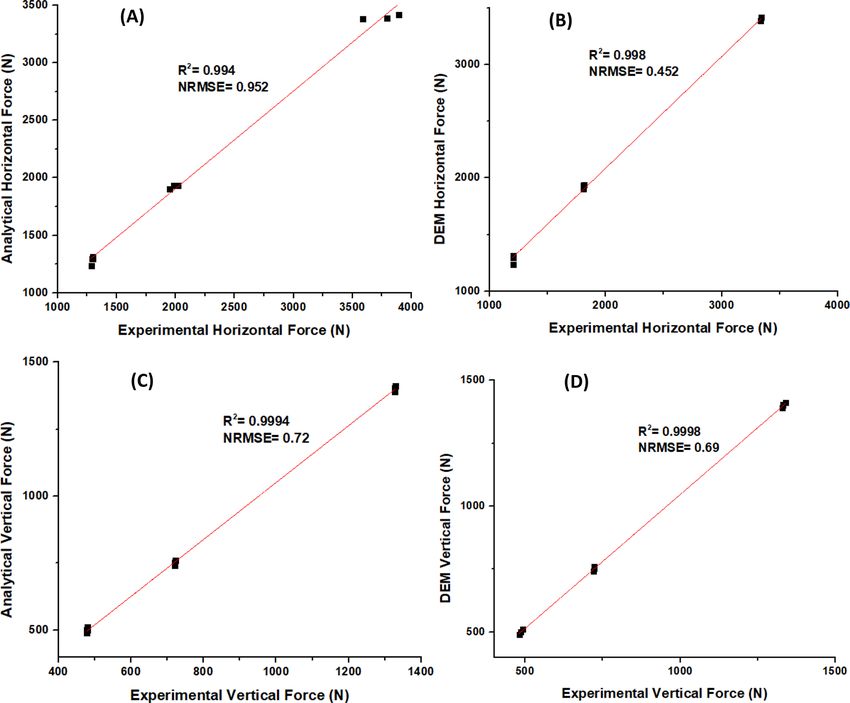
www.nature.com/scientificreports/

                                             Items                                Technical parameters
                                             Measurement range (MPa)               − 0.1–70
                                             Supply voltage (V)                   DC 10–24
                                             Full-scale output (mV)               DC 70–110
                                             Corresponding time (10–90%) (ms)      ≤1
                                             Operating temperature range           − 35 °C to + 85 °C
                                             Plug connection                      3-pin connector with single-wire seal
                                             Load resistance                       > 10 kΩ
                                             Standard overload range               ± 220 kN
                                             Supply current Isup                   < 50 mA

                                            Table 3.  Technical specification of KMB 40 force sensor.

                                            Figure 4.  Flow chart of the data acquisition process.

                                            Figure 5.  Subsoiler attached to the soil bin trolley.

                                            Figure 6.  Diagrams showing the direction of the force in the top link.

                                            Figure 7.  Diagrams showing the direction of the force in the lower/bottom links.

          Scientific Reports |   (2021) 11:11082 |                     https://doi.org/10.1038/s41598-021-90682-w               6

Vol:.(1234567890)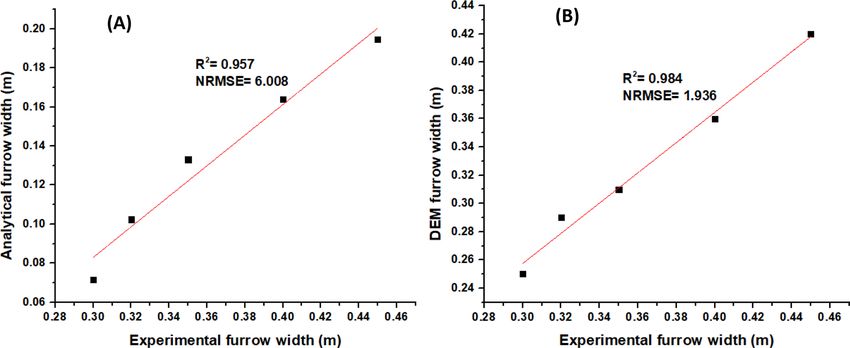
www.nature.com/scientificreports/
The diagrams showing the direction of the force in the top and lower/bottom links are shown in Figs. 6 and 7
y23.
respectively. The same procedure of resolving forces in the top and lower/bottom links of tractor was used b
Ftx = Ft.Cosa (11)
Fty = Ft.Sina (12)
where Ft is the force exerted only in the direction of the axis of the upper arm,Ftx , Fty are the horizontal and
vertical components of Ft , a is the angle between the upper link and the horizontal line.
Fblx = Fblh.Cosb.CosC − Fblv.Sinb.CosC (13)
Fbrx = Fbrh.Cosb.CosC − Fbrv.Sinb.CosC (14)
Fbly = Fblh.Sinb + Fblv.Cosb (15)
Fbry = Fbrh.Sinb + Fbrv.Cosb (16)
Computation of the horizontal and vertical forces
Fx = Ftx + Fblx + Fbrx (17)
Fy = Fty + Fbly + Fbry (18)
By substituting Eqs. (11), (13) and (14) into (17).
Fx = Ft.Cosa + Fblh.Cosb.Cosc + Fbrh.Cosb.Cosc (19)
Next, Eqs. (12), (15), and (16) into (18).
Fy = Ft.Sina + Fblh.Sinb + Fbrh.Sinb (20)
where Fblh , Fbrh are the forces in the left and right lower hitch points axis respectively, Fx is the horizontal
(draught) force, Fy is the vertical force, Fblx , Fbly are the horizontal and vertical forces on the left lower link,
Fbrx , Fbry are the horizontal and vertical forces on the right lower link, b and c are angles of the lower arms.
Subsequently, the MATLAB programming language was used to solve all terms to obtain forces.
Further, the soil furrow profile formed after the subsoiler passage was measured using the soil profilom-
eter. The penetrometer was pushed into the soil by hand at a speed of approximately 0–2 m/s as per ASABE
standards24.
Statistical analysis. The Taguchi method developed by25, which uses an orthogonal array to optimize the entire
parameter space with fewer experiments, was used to design the experiments. Orthogonal arrays are a special
standard experimental design that requires only a small number of experimental trials to find the main factors
affecting output. Before selecting an orthogonal array, the minimum number of experiments conducted was
fixed based on the formula shown in Eq. (21).
NTaguchi = 1 + NV (L − 1) (21)
where NTaguchi = number of experiments to be conducted, NV = number of parameters, L = number of levels. In
this case, 27 experiments were supposed to be conducted but using the L9 orthogonal array, only 9 experiments
were sufficient to optimize the parameters.
The relative error method was used to calculate the percentage error and compare the simulated and analytical
results with the soil bin’s measured values, as shown in Eq. (22).
Measuredvalue − Predictedvalue
RelativeError = × 100% (22)
Measuredvalue
Additionally, ANOVA test was performed to determine the differences between the soil bin experiment,
analytical method, and the DEM simulation data.
Results
Cutting forces. Validation of the developed models on cutting forces. The statistical performance of the
forces measured during the tillage experiment in the soil bin, and one estimated by the analytical, and the nu-
merical models are shown in Table 4. The results showed a close relationship between the numerical and experi-
mental values, with the relative errors of the predicted results being 4.44 and 4.01% for horizontal and vertical
forces.
Furthermore, the ANOVA-test proved no significant difference between the analytical model, DEM simula-
tion and soil bin experimental results at a 0.05% level, as shown in Table 5. The p-values were 0.9396 and 0.9696
for the horizontal and vertical forces, respectively, which were non-significant, i.e. p > 0.05.
Scientific Reports | (2021) 11:11082 | https://doi.org/10.1038/s41598-021-90682-w 7
Vol.:(0123456789)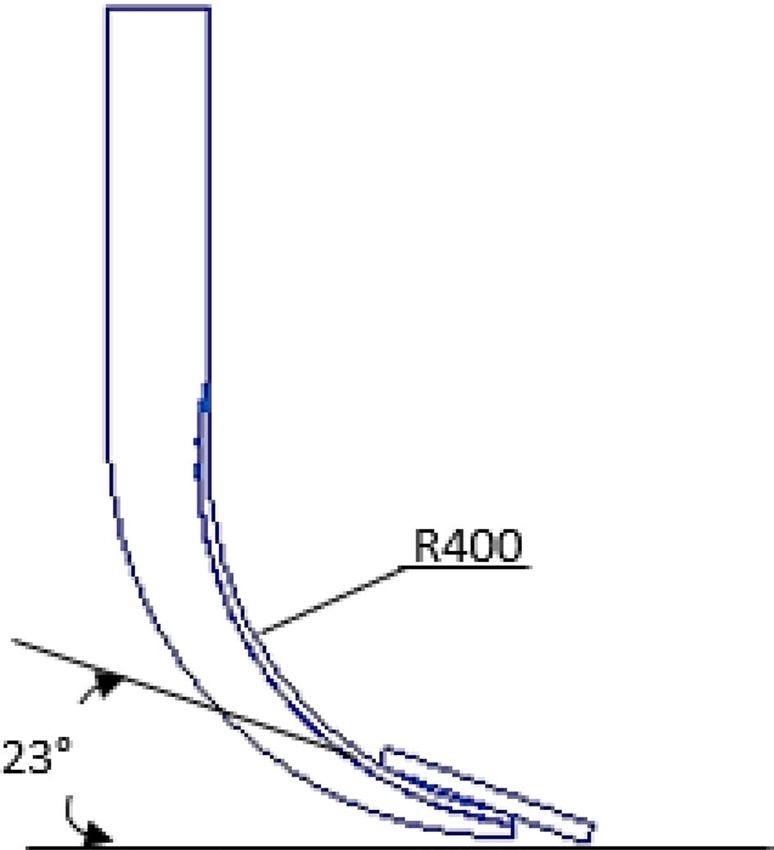
www.nature.com/scientificreports/
Experiment/ Relative error (%)
Analytical
approach (N) DEM model (N) Soil bin (N) Analytical DEM
Speed (km/h) Depth (m) H V H V H V H V H V
1 0.15 1201.87 478.28 1283.54 480.43 1235.24 490.22 2.78 2.50 3.76 2.04
1 0.2 1809.24 719.98 1951.00 720.32 1905.15 740.51 5.30 2.85 2.35 2.80
1 0.3 3334.11 1326.80 3588.41 1328.61 3381.81 1390.34 1.43 4.79 5.76 4.65
2 0.15 1203.49 478.92 1295.28 485.12 1296.55 500.23 7.73 4.45 0.10 3.11
2 0.2 1811.39 720.84 1985.00 721.90 1934.67 750.91 6.81 4.17 2.54 4.02
2 0.3 3337.34 1328.09 3791.89 1332.33 3389.01 1401.90 1.55 5.56 10.62 5.22
2.5 0.15 1204.69 479.41 1296.58 491.41 1312.11 510.50 8.92 6.49 1.20 3.88
2.5 0.2 1813.01 721.48 2021.00 723.01 1941.32 760.45 7.08 5.40 3.94 5.18
2.5 0.3 3339.77 1329.06 3894.50 1340.34 3417.52 1410.11 2.33 6.10 12.25 5.21
Average relative error (%) 4.88 4.70 4.44 4.01
Table 4. The forces measured during the tillage experiments in the soil bin, analytical approach, and the
numerical model. H, V- Indicates horizontal and vertical forces respectively.
Sum of squares df Mean square F-Stat P-value
For horizontal force
Between groups 117,351.37 2 58,675.68 0.063 0.9396ns
Within groups 22,529,201.59 24 938,716.73
Total 22,646,552.96 26
For vertical force
Between groups 9269.97 2 4634.99 0.031 0.9696ns
Within groups 3,594,751.79 24 149,781.32
Total 3,604,021.76 26
Table 5. Summary of ANOVA for assessing the statistical significance between Analytical model, DEM
simulation, and soil bin experiment results. **, ns- Indicates significant at 0.05% level and non-significant,
respectively.
The results also indicate that DEM predicted results with the best regression of 0.9998 R2 at a normalized
RMSE of 0.69 for vertical force followed by the DEM model with 0.998 R2 and a normalized RMSE of 0.452 for
horizontal force, while the analytical model had the lowest R2 of 0.994, at a normalized RMSE of 0.952 (Fig. 8).
However, all three regression results gave a p-value < 0.0001.
Prediction of cutting forces. It was found that both horizontal and vertical cutting forces increased as tillage
depth was increased from 0.15 to 0.30 m (Fig. 9). Any increment of tillage depth leads to the increase of soil
volume cut, dispersed, and moved. Therefore, a higher cutting force is required to break higher soil volume. 26
obtained the same trend of results in their study of kinematic parameters of chisel ploughs.
The results also show that an increment of operating speed from 1 to 2.5 km/h resulted in cutting force
growth. This is because soil particles intend to gain higher acceleration as operating speed increases. The higher
acceleration of particles increased normal loads acting on the tillage tool. When the normal load increases, the
frictional force and thereby, the cutting force i ncreases27.
Similar results were obtained b y28 after using the ASABE standard Equation 24 to measure the draft forces
of a subsoiler.
Soil furrow profile. Validation of the developed models on soil profile formation. The furrow widths’ statis-
tical performance measured after the subsoiler passage in the soil bin, calculated by analytical approach and the
numerical model estimate are shown in Table 6. The results showed a close relationship between the numerically
predicted values and the experimental ones, with the relative errors of the prediction of 10.83 and 64.38% for
numerical and analytical respectively.
The results also indicate that DEM predicted the results with the best regression of 0.984 R2 at a normalized
RMSE of 1.936 while the analytical model had the lowest R2 of 0.957, at a normalized RMSE of 6.008 (Fig. 10).
However, all three regression results gave a p-value < 0.0001.
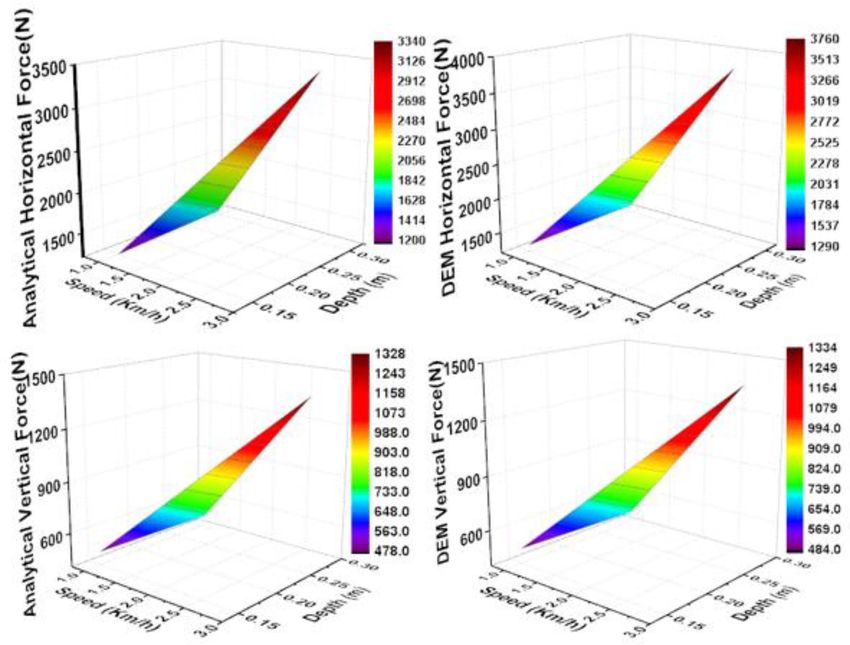
Prediction of the soil profile. The DEM and the analytical models’ results were compared with experimental
results to study the soil profile shape formed after passage of subsoiler. As depicted in Fig. 11, the shape obtained
in the DEM simulation gave results that are more similar to the experimental ones as compared to the analytical
approach. However, it was challenging to show profile appearance dynamics in the analytical approach.
Scientific Reports | (2021) 11:11082 | https://doi.org/10.1038/s41598-021-90682-w 8
Vol:.(1234567890)www.nature.com/scientificreports/
Figure 8. The linear regression plots for the predicted against measured horizontal forces (A) and (B) and
vertical forces (C) and (D).
After the passage of the subsoiler, the disturbed particles fall back to the furrow. Therefore, the formed furrow
profile obtained in the DEM was measured at the edge of the disturbed particles separated by different colors.
The analytical profile was not able to show the dynamics of the formed furrow profile shape.
However, DEM showed that the subsoiler did not turn the soil and hence maintaining the soil structure.
Discussion and conclusions
The results from this study indicated that there was no turning of soil caused by the passage of the subsoiler at
the depth below the top layer of soil. This was a result of the shape of the subsoiler. To calculate the two models’
accuracies, the cutting forces and the soil furrow profiles formed after the subsoiler passage were measured and
compared with the experimental data obtained in the soil bin data in terms of relative error and R squared.
Depending on the analysis, the vertical force’s prediction accuracy was higher compared with that of the
predicted draught force. Generally, the values of calculated RE obtained were less than 5%, i.e. 95% accuracy
was achieved in verifying the tested models. Likewise, the ANOVA test showed no statistically significant differ-
ences between the analytical model, DEM simulation, and soil bin experiment results at 0.05% level, as shown
in Table 5.
Both the horizontal and vertical forces increased with the increase in depth of cut and the operating speed.
The same results of tillage forces were obtained b y29. However, the predicted values of force obtained in the
DEM simulation were higher than the analytical ones, which is closer to the experimental results. This can be
attributed to the closeness of the characteristics between the experimental and the simulation parameters used.
The Wf increased linearly with the operating depth. Identical results of AM have been found b y8,30 in their
study of cutting forces and soil disturbance.
This result reveals that tine implements like subsoiler do not turn cohesive soil, hence maintaining the soil
layers of the soil profile. As was observed, the simulation model can be utilized as a tool to examine the induced
changes in the soil profile and prediction of the furrow formed after the passage of the subsoiler. The formed
profiles’ shapes were trapezoidal as observed b y17,31,32.
This means that to maintain soil nutrients in deep tillage, especially for the fields with less depth of organic
soil, it is advisable to use tine implements (subsoiling) that do not turn the soil’s bottom layer, which does not
Scientific Reports | (2021) 11:11082 | https://doi.org/10.1038/s41598-021-90682-w 9
Vol.:(0123456789)www.nature.com/scientificreports/
Figure 9. The prediction of cutting forces of the subsoiler during tillage operations (A) Analytical horizontal
force (B) DEM horizontal force (C) Analytical vertical force (D) DEM vertical force.
Relative error (%)
Depth (m) Experiment Analytical model DEM model Analytical DEM
0.10 0.30 0.07 0.25 76.13 16.67
0.15 0.32 0.10 0.29 68.00 9.38
0.20 0.35 0.13 0.31 61.97 11.43
0.25 0.40 0.16 0.36 59.05 10.00
0.30 0.45 0.19 0.42 56.76 6.67
Average relative error (%) 64.38 10.83
Table 6. Dimensions of the furrow width (Wf) formed after the passage of the subsoiler at a speed of
2.5 km/h.
contain good organic needed for crop growth. It was also observed that the subsoiling operation conserved
soil due to the backfill of the topsoil (organic soil) to the subsoil, which provides nutrients for the deep roots
(Fig. 11B).
In conclusion, the findings of this study provide the base for improving deep tillage performance, structure,
and working parameters of the non-inversion tool in cohesive soils. The improvement of deep tillage by utiliz-
ing the developed model can also lead to the evolution of the tillage operations which is another way for the
development of the agricultural machinery manufacturing sector. To avoid the expensive field testing and obtain
a prediction of the cutting forces and soil profiles of different tillage implements, it is thus important to adopt
the model suggested in this study. Future work will need to develop an improved contact model to improve the
results and develop an improved calibration procedure that considers the effects of all the micro-properties
parameters of soil mechanical properties and use closer to actual particle sizes.
Scientific Reports | (2021) 11:11082 | https://doi.org/10.1038/s41598-021-90682-w 10
Vol:.(1234567890)www.nature.com/scientificreports/
Figure 10. Comparison between predicted (A) Analytical model (B) DEM model and measured width of
furrow for a subsoiler.
Figure 11. The furrow profile formed after passage of subsoiler during tillage operations (A) Soil bin
experiment (B) DEM model created using EDEM 2018 software, DEM Solutions Ltd. (https://www.edemsimula
tion.com/software/) (C) Analytical model.
Received: 17 January 2021; Accepted: 30 April 2021
References
1. Schrijver, R., Poppe, K., & Daheim, C. Precision agriculture and the future of farming in Europe. Science and Technology Options
Assessment. Brussels. http://www.ep.europa.eu/stoa (2016)
2. Bengough, A. G., McKenzie, B., Hallett, P. & Valentine, T. Root elongation, water stress, and mechanical impedance: a review of
limiting stresses and beneficial root tip traits. J. Exp. Bot. 62, 59–68. https://doi.org/10.1093/jxb/erq350 (2011).
3. Gao, W. et al. Deep roots and soil structure. Plant Cell Environ. 39, 1662–1668. https://doi.org/10.1111/pce.12684 (2016).
4. Oldeman, L. R., Hakkeling, R. & Sombroek, W. G. World map of the status of human-induced soil degradation: an explanatory
note. Int. Soil Ref. Inf. Centre https://doi.org/10.1002/ldr.3400030109 (2017).
5. Blednykh, V., Svechnikov, P. & Troyanovskaya, I. Analytical model of soil pulverization and tillage tools. Proc. Eng. 129, 69–74
(2015).
6. Tong, J. & Moayad, B. Z. Effects of rake angle of chisel plough on soil cutting factors and power requirements: a computer simula-
tion. Soil Tillage Res. 88, 55–64 (2006).
7. Zeng, Z., & Chen, Y. in 2018 ASABE Annual International Meeting. 1 (American Society of Agricultural and Biological Engineers).
8. Al-Neama, A. K. A. & Herlitzius, T. Description of furrow shaping created by single standard tines. Eng. Agric. Environ. Food 11,
43–50. https://doi.org/10.1016/j.eaef.2017.12.002 (2018).
9. Zaied, M. B., Dahab, M. H. & El Naim, A. M. Development of a mathematical model for angle of soil failure plane in case of
3-dimensional cutting. Curr. Res. Agric. Sci. 1, 42–52 (2014).
10. McKyes, E. The calculation of draft forces and soil failure boundaries of narrow cutting blades. Trans. ASAE 21, 20–24. https://doi.
org/10.13031/2013.35241 (1978).
11. McKyes, E. Elsevier Science Publishers BV. https://doi.org/10.1016/B978-0-444-88080-2.50013-2 (1985).
12. Gupta, P., Gupta, C. & Pandey, K. An analytical model for predicting draft forces on convex-type wide cutting blades. Soil Tillage
Res. 14, 131–144. https://doi.org/10.1016/0167-1987(89)90027-5 (1989).
Scientific Reports | (2021) 11:11082 | https://doi.org/10.1038/s41598-021-90682-w 11
Vol.:(0123456789)www.nature.com/scientificreports/
13. McKyes, E. & Desir, F. L. Prediction and field measurements of tillage tool draft forces and efficiency in cohesive soils. Soil Tillage
Res. 4, 459–470. https://doi.org/10.1016/0167-1987(84)90053-9 (1984).
14. Willatt, S. & Willis, A. A study of the trough formed by the passage of tines through soil. J. Agric. Eng. Res. 10, 1–4. https://doi.
org/10.1016/0021-8634(65)90101-0 (1965).
15. Sun, J., Wang, Y., Ma, Y., Tong, J. & DEM Zhang, Z. simulation of bionic subsoilers (tillage depth> 40 cm) with drag reduction and
lower soil disturbance characteristics. Adv. Eng. Softw. 119, 30–37. https://doi.org/10.1016/j.advengsoft.2018.02.001 (2018).
16. Bo, L. et al. Determination of the draft force for different subsoiler points using discrete element method. Int. J. Agric. Biol. Eng.
9, 81–87. https://doi.org/10.3965/j.ijabe.20160903.2210 (2016).
17. Hang, C., Gao, X., Yuan, M., Huang, Y. & Zhu, R. Discrete element simulations and experiments of soil disturbance as affected by
the tine spacing of subsoiler. Biosys. Eng. 168, 73–82. https://doi.org/10.1016/j.biosystemseng.2017.03.008 (2018).
18. Tanaka, H. et al. DEM simulation of soil loosening process caused by a vibrating subsoiler. Agric. Eng. Int. CIGR J. (2007).
19. Makange, N. R., Ji, C. & Torotwa, I. Prediction of cutting forces and soil behavior with discrete element simulation. Comput.
Electron. Agric. 179, 105848. https://doi.org/10.1016/j.compag.2020.105848 (2020).
20. Solutions, D. EDEM 2.6 theory reference guide. Edinburgh, United Kingdom (2014).
21. Lamit, L.G. (2017). PTC Creo Parametric 4.0 Part 1A (Lessons 1–7): Full-color version.
22. Riley, W. F., Sturges, L. D., Morris, D. H. & Riley, W. F. Statics and mechanics of materials: an integrated approach (Wiley, 2002).
23. Beigi, M., Ghazavi, M. A. & Ahmadi, I. Design and construction of load cell of a three point hitch dynamometer for tractor john
deere 3140. J. Mod. Processes Manuf. Prod. 3, 47–58 (2014).
24. ASABE. Agricultural machinery management. ASABE STANDARDS 2010 (2006).
25. Taguchi, G. & Konishi, S. Taguchi methods: orthogonal arrays and linear graphs; tools for quality 1engineering (ASI Press, 1987).
26. Al-Suhaibani, S. & Ghaly, A. Comparative study of the kinetic parameters of three chisel plows operating at different depths and
forward speed in a sandy soil. Int. J. Eng. Sci 2, 42–59 (2013).
27. Kepner, R. A., Bainer, R. & Barger, E. L. Principles of farm machinery http://www.kopykitab.com/product/11971 (2005).
28. Askari, M. & Khalifahamzehghasem, S. Draft force inputs for primary and secondary tillage implements in a clay loam soil. World
Appl. Sci. J. 21, 1789–1794 (2013).
29. Bo, L., Fanyi, L., Junying, M., Jun, C. & Wenting, H. Distinct element method analysis and field experiment of soil resistance applied
on the subsoiler. Int. J. Agric. Biol. Eng. 7, 54–59. https://doi.org/10.3965/j.ijabe.20140701.006 (2014).
30. Rahman, S. & Chen, Y. Laboratory investigation of cutting forces and soil disturbance resulting from different manure incorpora-
tion tools in a loamysand soil. Soil Tillage Res. 85, 19–29 (2001).
31. Barr, J. B., Fielke, J., & Desbiolles, J. A new method of quantifying discrete element method predicted furrow profiles of narrow
point openers. In 2017 ASABE Annual International Meeting (pp. 1): American Society of Agricultural and Biological Engineers.
https://doi.org/10.13031/aim.201701589 (2017).
32. Solhjou, A., Fielke, J. M. & Desbiolles, J. M. Soil translocation by narrow openers with various rake angles. Biosys. Eng. 112, 65–73.
https://doi.org/10.1016/j.biosystemseng.2012.02.006 (2012).
Acknowledgements
This research received financial support from the NSFC (National Natural Science Foundation of China), Grant
number: 51275250. The authors would also like to acknowledge the staff and students of Nanjing Agricultural
University, College of Engineering, for their support during data collection.
Author contributions
Conceptualization, N.R.M.; data acquisition and analysis, N.R.M., I.N., I.I.S. and S.O.; funding acquisition, C.J.;
writing—original draft, N.R.M. and C.J.; writing—review and editing, N.R.M. and C.J.
Competing interests
The authors declare no competing interests.
Additional information
Correspondence and requests for materials should be addressed to C.J.
Reprints and permissions information is available at www.nature.com/reprints.
Publisher’s note Springer Nature remains neutral with regard to jurisdictional claims in published maps and
institutional affiliations.
Open Access This article is licensed under a Creative Commons Attribution 4.0 International
License, which permits use, sharing, adaptation, distribution and reproduction in any medium or
format, as long as you give appropriate credit to the original author(s) and the source, provide a link to the
Creative Commons licence, and indicate if changes were made. The images or other third party material in this
article are included in the article’s Creative Commons licence, unless indicated otherwise in a credit line to the
material. If material is not included in the article’s Creative Commons licence and your intended use is not
permitted by statutory regulation or exceeds the permitted use, you will need to obtain permission directly from
the copyright holder. To view a copy of this licence, visit http://creativecommons.org/licenses/by/4.0/.
© The Author(s) 2021
Scientific Reports | (2021) 11:11082 | https://doi.org/10.1038/s41598-021-90682-w 12
Vol:.(1234567890)You can also read