Pollen Grain Classification Challenge 2020 Challenge Report - DMI Unict
←
→
Page content transcription
If your browser does not render page correctly, please read the page content below
Pollen Grain Classification
                           Challenge 2020
                                Challenge Report

    Sebastiano Battiato1 , Francesco Guarnera1 , Alessandro Ortis1(B) ,
       Francesca Trenta1 , Lorenzo Ascari2 , Consolata Siniscalco2 ,
                  Tommaso De Gregorio3 , and Eloy Suárez3
                     1
                      University of Catania, 95125 Catania, Italy
                        {battiato,ortis}@dmi.unict.it,
                {francesco.guarnera,francesca.trenta}@unict.it
                      2
                        University of Turin, 10125 Turin, Italy
                {lorenzo.ascari,consolata.siniscalco}@unito.it
               3
                 Agri Competence Center – Ferrero HCo, Milan, Italy
              {tommaso.degregorio,Eloy.SuarezHuerta}@ferrero.com

       Abstract. This report summarises the Pollen Grain Classification
       Challenge 2020, and the related findings. It serves as an introduction to
       the technical reports that were submitted to the competition section at
       the 25th International Conference on Pattern Recognition (ICPR 2020),
       related to the Pollen Grain Classification Challenge. The challenge is
       meant to develop automatic pollen grain classification systems, by lever-
       aging on the first large scale annotated dataset of microscope pollen grain
       images.

       Keywords: Pollen grain classification       · Computer vision · Machine
       learning

1    Introduction and Motivations
Aerobiology is a branch of biology that studies the dispersal into the atmosphere
of microorganisms, such as viruses, bacteria, fungal spores, and pollen grains [17].
Despite being mainly applied for studying the effects of airborne biological agents
on human health [28], aerobiology also plays an important role in other fields,
such as in plant [32] and environmental sciences [18,26]. In particular, monitor-
ing airborne pollen dispersal is important for allergology [6], criminalistics [1],
archaeobotany [25], biodiversity conservation [13] and crop modeling [9]. Despite
its importance, the hard work required by the techniques currently used to iden-
tify and count the relevant entities in microscopy has hindered the application
of aerobiology to those and new sectors. Standard palynological procedures rely
on the manual classification of pollen grains by observing morphological traits
on microscopy images [22]. Indeed, the identification and classification of pollen
grains from different plant species require the intervention of qualified human
c Springer Nature Switzerland AG 2021
A. Del Bimbo et al. (Eds.): ICPR 2020 Workshops, LNCS 12668, pp. 469–479, 2021.
https://doi.org/10.1007/978-3-030-68793-9_34
470 S. Battiato et al.
Table 1. Comparison between the proposed dataset and the main datasets used in
pollen grain classification.
Dataset Number of grains Image type Resolution
Duller’s Pollen Dataset [11] 630 Grayscale 25 × 25
POLEN23E [16] 805 Color Minimum 250 pixel
per dimension
Ranzato et al. [27] 3, 686 (1, 429 Color 1024 × 1024
images) (multiple grains
per image)
Pollen73S [2] 2, 523 Color Average size
512 × 512
Pollen13K [4] >12, 000 + ∼1, 000 Color 84 × 84
examples of debris
(e.g., dust, air
bubbles)
operators in a highly demanding process in terms of time and people training.
Therefore, the importance of automation in the aerobiological field is crucial to
provide valuable improvements, especially for the task of pollen grains classifica-
tion. As a consequence, different automatic classification approaches have been
investigated over the years [20,30]. Recent advances in Machine Learning meth-
ods based on deep neural networks have resulted in impressive performances on
a variety of problems, such as facial recognition, motion detection, medical diag-
nosis, among many others. At present, Machine Learning approaches have been
widely adopted in object classification applications, providing highly accurate
results on large-scale Multi-class datasets [3]. The rapid progress of automatic
methods for pollen grains classification will have great impacts on the develop-
ment of low-cost tools for aerobiologists. Moreover, Machine Learning techniques
require a large amount of data, promoting the definition of large-scale datasets.
To this end, we collected a set of images related to pollen grains detected in
microscope images from aerobiological samples, defining a large-scale dataset
composed of more than 13, 000 pollen grains [4] in 5 different categories. Pre-
vious studies on automatic pollen grain detection/classification are trained and
evaluated on datasets which include from 65 to about 4, 000 number of grains,
and most of them report results obtained on self-collected databases. Three pub-
lic databases are the Duller’s Pollen Dataset [11], the POLEN23E [16] and the
Pollen73S [2]. The first contains a total of 630 grayscale images of size 25×25, the
second one includes 805 color images of 23 pollen species, with 35 images for each
pollen type, and the latter is composed of 2, 523 images from 73 pollen types. In
Table 1, the main datasets used in pollen grain classification are reported.
2 Dataset Description
The provided dataset consists of more than 13 thousands per-object images col-
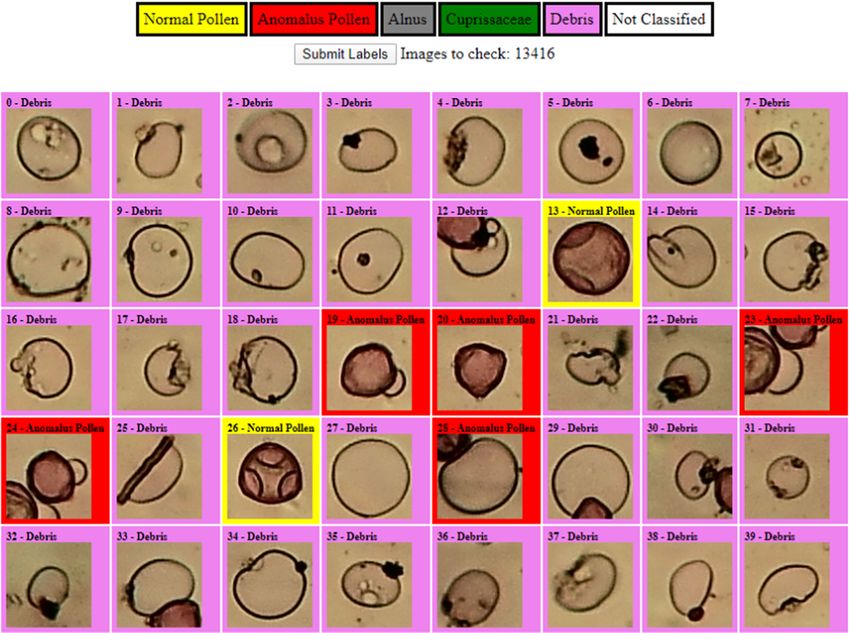
lected from aerobiological samples, classified into five different categories: (1)Pollen Grain Classification Challenge 2020 Challenge Report 471
Fig. 1. Web-based tool used to label images
Corylus avellana (well-developed pollen grains), (2) Corylus avellana (anoma-
lous pollen grains), (3) Alnus, (4) debris and (5) Cupressaceae. However, con-
sidering the small number of observations related to the class Cupressaceae, this
has not included in the dataset used for the challenge. Airborne pollen grains
were sampled by volumetric spore traps (Lanzoni VPPSHirst-type
R sampler),
placed at plant canopy level, with an adhesive strip placed on a rotating drum,
moved at 2 mm h-1 under a suction hole, for seven-day sampling autonomy.
Thereafter, the sampling strip was collected weekly and cut into daily segments
that were analyzed following standard staining procedures. The pollen grains
placed on microscope slides were selectively stained with a mounting medium
containing basic fuchsin (0.08 % gelatin, 0.44% glycerin, 0.015% liquefied phe-
nol, 0.0015% basic fuchsin in aqueous solution). For image acquisition, the daily
strip segments were inspected using a Leitz Diaplan bright-field microscope with
a 5 MP CMOS sensor. Then, image patches depicting centered objects automat-
ically extracted from microscope images were manually labeled by experts in
aerobiology using a web-based tool (see Fig. 1). The dataset includes:
– 84×84 RGB images for each segmented object, for each of the four categories;
– binary masks for single object segmentation (84 × 84 resolution);
– segmented versions of the patches obtained by applying the segmentation
mask and padding the background with all green pixels (84 × 84 resolution).472 S. Battiato et al.
Table 2. Number of objects for each class on training and test set. Training objects
represent 85% of the full dataset while test objects the 15%.
Class Training objects Test objects
Corylus avellana (well-developed pollen grains) 1, 566 277
Corylus avellana (anomalous pollen grains) 773 136
Alnus (well-developed pollen grains) 8, 216 1, 450
Debris 724 128
3 Challenge
3.1 Description
The aim of the proposed challenge is the automatic classification of pollen grain
images exploiting the largest dataset of microscope pollen grain images, col-
lected from aerobiological samples. The microscope images of the samples have
been digitalized and processed through a proper image processing pipeline [3]
to detect and extract five classes of objects, including four pollen types and
an additional class of objects that could be often misclassified as pollen (e.g.,
air bubbles, dust, etc.). Due to the very low number of examples of the class
Cupressaceae, this class has been ignored for the classification task proposed by
the challenge1 . More than 13, 000 objects have been detected and labeled by
aerobiology experts. The challenge started officially on the 10th of May 2020,
when the organizers opened the registration through the website https://iplab.
dmi.unict.it/pollenclassificationchallenge. After ten days, when the training data
have been released, the challenge counted 96 registered teams. Training data have
been available for about one month, and on the 18th of June 2020 also test data
have been released, together with an example template file (JSON format) for
prediction results upload. The number of objects for each class in the training
set and test set is described in Table 2.
3.2 Evaluation Criteria
Participants have been requested to upload the results of classification according
to the specified submission format. The submitted classification results have been
evaluated considering different metrics. Then, the ranking has been defined con-
sidering the F1 weighted score as the first metric, followed by the F1 macro and
Accuracy respectively (i.e., F1 (weigh), F1 (macro) and Accuracy in Table 3).
The F1 weighted score computes the F1 for each label and returns their
average with the number of instances of that class in the dataset. This alters the
classic F1 score to account for label imbalance. The F1 macro score computes
the F1 for each label and returns their average.
1
More details about the full dataset can be found at: https://iplab.dmi.unict.it/
pollengraindataset/dataset.Pollen Grain Classification Challenge 2020 Challenge Report 473
3.3 Ranking
The submission page was open for five days: 50 teams submitted 87 files in
JSON format representing the predicted labels of test data, as requested by the
organizers. Four submissions have been removed because in the uploaded file
some test instances were missing. Table 3 shows the final leaderboard. Each
team was allowed to perform up to five attempts, however, this table shows
only the best result for each team. The complete ranking of the accepted sub-
missions listing all the 83 attempts is available at https://iplab.dmi.unict.it/
pollenclassificationchallenge/results.
Table 3. Final leaderboard. For each team, only the best result of multiple attempts
is reported.
Rank Username F1 (weigh) F1 (macro) Accuracy
1 zhangbaochang 0.975100 0.955361 0.975389
2 0.973032 0.951970 0.973380
3 Penghui Gui 0.972592 0.951678 0.972877
4 jaideepm.111@gmail.com 0.972578 0.950828 0.972877
5 fangzhouzhao 0.972496 0.951796 0.972877
6 Chia Wei Chen 0.970588 0.950738 0.970868
7 Fangrui Liu 0.969953 0.948511 0.970366
8 Karan Pathak 0.968503 0.945373 0.968859
9 Yutao Hu 0.968093 0.947151 0.968357
10 Yuya Obinata 0.967979 0.946900 0.968357
11 jang jian 0.967914 0.945436 0.968357
12 Xuihui Liu 0.967001 0.943794 0.967353
13 Vivek Mittal 0.966412 0.941226 0.966850
14 Andrinandrasana David Rasamoelina 0.965974 0.944739 0.966348
15 Nguyen Tu Nam 0.965447 0.940767 0.965846
16 dongdong 0.964497 0.939353 0.964841
17 Alvaro Gomez 0.964423 0.937687 0.964841
18 Alexander Gillert 0.964138 0.938476 0.964841
19 Zhao Qiuyang 0.963047 0.938714 0.963335
20 Amirreza Mahbod 0.962975 0.939495 0.962832
21 Wataru Miyazaki 0.962777 0.935647 0.963335
22 Jonathan Heras 0.961521 0.933872 0.962330
23 Pankaj Mishra 0.961169 0.936951 0.961325
24 Yufei Zhao 0.959996 0.932907 0.960321
25 Narek Maloyan 0.958624 0.928215 0.959316
(continued)474 S. Battiato et al.
Table 3. (continued)
Rank Username F1 (weigh) F1 (macro) Accuracy
26 Gianluca Maguolo 0.957547 0.929319 0.958312
27 Bojan Batalo 0.955266 0.924223 0.955801
28 Bartosz Ptak 0.955024 0.922227 0.955801
29 Melinda Katona 0.954564 0.925895 0.955298
30 Alessandra Lumini 0.952579 0.924816 0.953289
31 Bartosz Ptak 0.951613 0.921605 0.951783
32 Soumyadeep Ghosh 0.951526 0.918610 0.952285
33 Xiaomin Lin 0.948412 0.910667 0.948769
34 Adriano D’Alessandro 0.947723 0.911103 0.947764
35 Soumyadeep Ghosh 0.939999 0.906203 0.940733
36 Umang Chaturvedi 0.939347 0.904577 0.939226
37 Jayasree Saha 0.938737 0.891418 0.941235
38 Umang Chaturvedi 0.931488 0.896115 0.930688
39 Michael Reed 0.916485 0.877608 0.913611
40 Nilesh Kumar 0.916437 0.850337 0.916122
41 Alessandra Crippa 0.911963 0.869167 0.910597
42 Silvio Barra 0.884577 0.841424 0.878955
43 Hussein Osman 0.872832 0.794640 0.874434
44 Abhijith Ragav 0.869042 0.808022 0.860873
45 Austin Lawson 0.797494 0.647156 0.823204
46 Xavier Anadn 0.690048 0.417303 0.735811
47 Oluwatobi Bello 0.518117 0.243847 0.473631
48 Julien Garnier 0.246656 0.321757 0.265193
49 Abhijith Ragav 0.109436 0.086493 0.118031
50 Oluwatoyin Popoola 0.052594 0.093299 0.089904
The leaderboard shows how almost all participants reached good results, with
the 0.975 as the maximum F1 value. The average F1 is 0.885 and 82% of the
teams outperform this score. Excluding some cases, the proposed methods have
achieved slight differences between F1 weighted and F1 macro, which means that
the performances of the proposed methods are good for all the classes included
in the dataset, although the high imbalance in the data.
3.4 Top 3 Ranked
In this paragraph we summarise the reports for the top-3 ranked Pollen Grain
Classification Challenge:Pollen Grain Classification Challenge 2020 Challenge Report 475
1. Baochang Zhang et al.: This is the top-ranking entry by Beihang Uni-
versity (Beijing China) and University at Buffalo (USA). The participants
proposed an approach based on two different methods, fused by a proper
blending strategy. The first method exploits a neural architecture search with
a densely connected search space named DenseNAS [12], which is a neural
architecture search method that defines a densely connected search space rep-
resented as a dense super network. The super network is composed of densely
connected routing blocks that are selected in the search phase to find the
best path between them and derive the final architecture. The second method
implements a Destruction and Construction Learning architecture [7], which
combines a shallow Convolutional Neural Network (CNN) classifier with an
Adversarial Network, jointly trained to classify an augmented dataset which
includes examples of the training data obtained by shuffling local regions of
the original images (i.e., Region Confusion Mechanism). This approach aims
at generalizing the classifier on sub-parts of the input image. The blending
strategy consists of concatenating the DCL and DenseNAT output vectors to
be used as the input of a Random Forest Classifier, which performs the final
classification. The authors performed cross-validation tests using the pro-
vided train set data, achieving an accuracy of 98,35%. The proposed method
obtained an accuracy score of 97,53% when evaluated on the challenge test
set. This shows the high generalization capability of such an approach.
2. Xuhui Liu et al.: This is the second-ranked entry by Beihang University,
Beijing China. Also, this method implements a fusion strategy over two inde-
pendent pipelines. Specifically, Hierarchical Bilinear Pooling (HBP) [34] and
Discriminative Filter Learning within a CNN (DFL-CNN) [31] models are
employed. Then, the two outputs are jointly fed to a decision-level fusion
model based on a Random Forest Classifier.
3. Penghui Gui et al.: Is the third-ranked entry by the College of Computer
Science, Sichuan University, China. The solution proposed by this team imple-
ments a sophisticated data augmentation approach, which creates a large
number of inputs starting from both the provided original and segmented
images. In particular, besides common image processing data augmentation
procedures, the authors further generated a number of images by applying
the cut occlusion approach, which consists of augmenting the dataset with
partially occluded versions of existing samples, to encourage the network to
consider less prominent features by removing maximally activated features.
The trained model is based on ResNet101 [19], followed by additional layers to
map high dimensional features of ResNet101 to low dimensional output cor-
responding to the four classes. It worth mentioning that all three attempts
uploaded by this team are ranked in the top-10 global leaderboard2 .
2
Check the complete leaderboard ranking at https://iplab.dmi.unict.it/pollen
classificationchallenge/results.476 S. Battiato et al.
4 Relevance of the Results
Since the first applications of neural networks for the classification of pollen
grains in light-microscopy [14,24], different machine learning approaches were
tested for the scope by different authors (see [20] and [30] for review). Never-
theless, past research has mostly relied on relatively small databases for testing
the performances of new classification algorithms [2,11,16,27]. Thanks to the
challenge organization, several techniques based on deep neural networks for the
classification of pollen grains on the same large scale benchmark database have
been evaluated and compared. CNNs were first showed to achieve classification
rates higher than 90% for solving pollen classification tasks in [10], where CNN
transfer learning was used for both feature extraction and classification. In [30],
AlexNet was used for transfer learning and feature extraction, while classifica-
tion was performed by Linear Discriminative Analysis. This approach achieved
an average F-score of 0.967 on the classification of pollen grains contained in
the POLEN23E dataset [30]. In another study, the LeNet CNN was applied on
a private collection of 1, 900 pollen images from four plant taxa, reaching an
F-score of 0.928 [23]. Recently, different CNNs were tested for the classification
of the Pollen73S dataset, reaching an F-score of 0.964 with DenseNet-201 [2].
During this competition, the contenders had to develop a classifier able to
separate instances in challenging conditions, as well-developed hazelnut and alder
pollen have similar average dimensions and structures. Moreover, alder pollen
was highly over-represented on the images, making correct classification of hazel-
nut pollen difficult, even for experienced human operators. In this context, the
F1-scores obtained by the top competitors were therefore significant and better
than what was found in recent studies. Besides, past research never included
debris, i.e. bubbles created during the preparation of microscope slides and abi-
otic particulate matter, as part of the classification problem. This could be rele-
vant especially for aerobiological samples where the abundance of debris can hin-
der correct pollen identification. CNN-based techniques were recently employed
for pollen identification on microscope slides, showing promising results even
in the presence of fungal spores, bubbles, debris and dust [15]. Future research
should test for possible performance gains of such methods by the inclusion of
disturbances in the identification procedure. Aerobiology has historically bene-
fited from the use of simple and relatively low-cost techniques, that have allowed
a extensive monitoring of airborne particles around the globe [5]. Its automa-
tion, by saving time in sample preparation and manual counting, while increas-
ing the sampling rate, has the potential to open new research opportunities
and address unanswered problems (for newly developed aerosol-sensing instru-
mentation see [8,21,29,33]). Nevertheless, for this to be true, new automated
aerobiological tools should hold the cost-effectiveness typical of this discipline.
Acknowledgements. The research has been carried out thanks to the collaboration
with Ferrero HCo, which financed the project and allowed the collection of aerobiolog-
ical samples from hazelnut plantations.Pollen Grain Classification Challenge 2020 Challenge Report 477
References
1. Alotaibi, S.S., et al.: Pollen molecular biology: applications in the forensic paly-
nology and future prospects: a review. Saudi J. Biol. Sci. 27(5), 1185–1190 (2020).
https://doi.org/10.1016/j.sjbs.2020.02.019
2. Astolfi, G., et al.: POLLEN73S: an image dataset for pollen grains classification.
Ecol. Inf. 60, 101165 (2020). https://doi.org/10.1016/j.ecoinf.2020.101165
3. Battiato, S., Ortis, A., Trenta, F., Ascari, L., Politi, M., Siniscalco, C.: Detec-
tion and classification of pollen grain microscope images. In: Proceedings of the
IEEE/CVF Conference on Computer Vision and Pattern Recognition Workshops,
pp. 980–981 (2020)
4. Battiato, S., Ortis, A., Trenta, F., Ascari, L., Politi, M., Siniscalco, C.: Pollen13k:
a large scale microscope pollen grain image dataset. In: IEEE International Con-
ference on Image Processing (ICIP), pp. 2456–2460. IEEE (2020)
5. Buters, J.T., et al.: Pollen and spore monitoring in the world. Clin. Transl. Allergy
8(1), 1–5 (2018). https://doi.org/10.1186/s13601-018-0197-8
6. Caillaud, D., Martin, S., Segala, C., Besancenot, J.P., Clot, B., Thibaudon, M.:
Effects of airborne birch pollen levels on clinical symptoms of seasonal allergic
rhinoconjunctivitis. Int. Arch. Allergy Immunol. 163(1), 43–50 (2014). https://
doi.org/10.1159/000355630
7. Chen, Y., Bai, Y., Zhang, W., Mei, T.: Destruction and construction learning
for fine-grained image recognition. In: Proceedings of the IEEE Conference on
Computer Vision and Pattern Recognition, pp. 5157–5166 (2019)
8. Crouzy, B., Stella, M., Konzelmann, T., Calpini, B., Clot, B.: All-optical automatic
pollen identification: towards an operational system. Atmos. Environ. 140, 202–212
(2016). https://doi.org/10.1016/j.atmosenv.2016.05.062
9. Cunha, M., Ribeiro, H., Abreu, I.: Pollen-based predictive modelling of wine pro-
duction: application to an arid region. Eur. J. Agron. 73, 42–54 (2016). https://
doi.org/10.1016/j.eja.2015.10.008
10. Daood, A., Ribeiro, E., Bush, M.: Pollen grain recognition using deep learning. In:
Bebis, G., et al. (eds.) ISVC 2016. LNCS, vol. 10072, pp. 321–330. Springer, Cham
(2016). https://doi.org/10.1007/978-3-319-50835-1 30
11. Duller, A., Guller, G., France, I., Lamb, H.: A pollen image database for evaluation
of automated identification systems. Quat. Newsl. 89, 4–9 (1999)
12. Fang, J., Sun, Y., Zhang, Q., Li, Y., Liu, W., Wang, X.: Densely connected
search space for more flexible neural architecture search. In: Proceedings of the
IEEE/CVF Conference on Computer Vision and Pattern Recognition, pp. 10628–
10637 (2020)
13. Fernández-Llamazares, Á., Belmonte, J., Boada, M., Fraixedas, S.: Airborne pollen
records and their potential applications to the conservation of biodiversity. Aero-
biologia 30(2), 111–122 (2013). https://doi.org/10.1007/s10453-013-9320-4
14. France, I., Duller, A.W., Duller, G.A., Lamb, H.F.: A new approach to automated
pollen analysis. Quat. Sci. Rev. 19(6), 537–546 (2000). https://doi.org/10.1016/
S0277-3791(99)00021-9
15. Gallardo-Caballero, R., Garcı́a-Orellana, C.J., Garcı́a-Manso, A., González-
Velasco, H.M., Tormo-Molina, R., Macı́as-Macı́as, M.: Precise pollen grain detec-
tion in bright field microscopy using deep learning techniques. Sensors (Switzer-
land) 19(16), 1–19 (2019). https://doi.org/10.3390/s19163583
16. Goncalves, A.B., et al.: Feature extraction and machine learning for the classifi-
cation of Brazilian savannah pollen grains. PLoS ONE 11(6), e0157044 (2016).
https://doi.org/10.1371/journal.pone.0157044478 S. Battiato et al.
17. Haddrell, A.E., Thomas, R.J.: Aerobiology: experimental considerations, observa-
tions, and future tools. Appl. Environ. Microbiol. 83(17), 1–15 (2017). https://doi.
org/10.1128/AEM.00809-17
18. Hader, J.D., Wright, T.P., Petters, M.D.: Contribution of pollen to atmospheric
ice nuclei concentrations. Atmos. Chem. Phys. 14(11), 5433–5449 (2014). https://
doi.org/10.5194/acp-14-5433-2014
19. He, K., Zhang, X., Ren, S., Sun, J.: Deep residual learning for image recognition. In:
Proceedings of the IEEE Conference on Computer Vision and Pattern Recognition,
pp. 770–778 (2016)
20. Holt, K.A., Bennett, K.: Principles and methods for automated palynology. New
Phytol. 203(3), 735–742 (2014). https://doi.org/10.1111/nph.12848
21. Huffman, J.A., et al.: Real-time sensing of bioaerosols: review and current per-
spectives. Aerosol Sci. Technol. 54(5), 465–495 (2020). https://doi.org/10.1080/
02786826.2019.1664724
22. Jackson, S.L., Bayliss, K.L.: Spore traps need improvement to fulfil plant biosecu-
rity requirements. Plant Pathol. 60(5), 801–810 (2011). https://doi.org/10.1111/
j.1365-3059.2011.02445.x
23. Korobeynikov, A., Kamalova, Y., Palabugin, M., Basov, I.: The use of convolu-
tional neural network LeNet for pollen grains classification. In: “Instrumentation
Engineering, Electronics and Telecommunications” Proceedings of the IV Interna-
tional Forum, Izhevsk, Russia, pp. 38–44 (2018). https://doi.org/10.22213/2658-
3658-2018-38-44
24. Li, P., Flenley, J., Empson, L.K.: Classification of 13 types of New Zealand pollen
patterns using neural networks. In: IVCNZ (1998)
25. Mercuri, A.M.: Applied palynology as a trans-disciplinary science: the contribution
of aerobiology data to forensic and palaeoenvironmental issues. Aerobiologia 31(3),
323–339 (2015). https://doi.org/10.1007/s10453-015-9367-5
26. Pearce, D.A., et al.: Aerobiology over Antarctica-a new initiative for atmospheric
ecology. Front. Microbiol. 7, 16 (2016). https://doi.org/10.3389/fmicb.2016.00016
27. Ranzato, M., Taylor, P.E., House, J.M., Flagan, R.C., LeCun, Y., Perona, P.: Auto-
matic recognition of biological particles in microscopic images. Pattern Recogn.
Lett. 28(1), 31–39 (2007). https://doi.org/10.1016/j.patrec.2006.06.010
28. Roy, C.J., Reed, D.S.: Infectious disease aerobiology: miasma incarnate. Front.
Cell. Infect. Microbiol. 2(December), 163 (2012). https://doi.org/10.3389/fcimb.
2012.00163
29. Sauvageat, E., et al.: Real-time pollen monitoring using digital holography. Atmos.
Meas. Tech. 13(3), 1539–1550 (2020). https://doi.org/10.5194/amt-13-1539-2020
30. Sevillano, V., Aznarte, J.L.: Improving classification of pollen grain images of the
POLEN23E dataset through three different applications of deep learning convolu-
tional neural networks. PLoS ONE 13(9), 1–18 (2018). https://doi.org/10.1371/
journal.pone.0201807
31. Wang, Y., Morariu, V.I., Davis, L.S.: Learning a discriminative filter bank within
a CNN for fine-grained recognition. In: Proceedings of the IEEE Conference on
Computer Vision and Pattern Recognition, pp. 4148–4157 (2018)
32. West, J.S., Kimber, R.: Innovations in air sampling to detect plant pathogens. Ann.
Appl. Biol. 166(1), 4–17 (2015). https://doi.org/10.1111/aab.12191Pollen Grain Classification Challenge 2020 Challenge Report 479
33. Wu, Y.C., et al.: Air quality monitoring using mobile microscopy and machine
learning. Light Sci. Appl. 6(9), e17046 (2017). https://doi.org/10.1038/lsa.2017.46
34. Yu, C., Zhao, X., Zheng, Q., Zhang, P., You, X.: Hierarchical bilinear pooling
for fine-grained visual recognition. In: Ferrari, V., Hebert, M., Sminchisescu, C.,
Weiss, Y. (eds.) ECCV 2018. LNCS, vol. 11220, pp. 595–610. Springer, Cham
(2018). https://doi.org/10.1007/978-3-030-01270-0 35You can also read