Assessing the immediate effect of COVID-19 lockdown on air quality: A case study of Delhi, India
←
→
Page content transcription
If your browser does not render page correctly, please read the page content below
Assessing the immediate effect of COVID-19
lockdown on air quality: A case study of Delhi, India
Ankit Sikarwar ( anks.sik@gmail.com )
International Institute for Population Sciences, Mumbai https://orcid.org/0000-0001-9014-5921
Ritu Rani
International Institute for Population Sciences, Mumbai https://orcid.org/0000-0001-6897-3544
Keywords: COVID-19, lockdown, air pollution, Delhi, India
DOI: https://doi.org/10.21203/rs.3.rs-31822/v1
License: This work is licensed under a Creative Commons Attribution 4.0 International License.
Read Full License
Page 1/19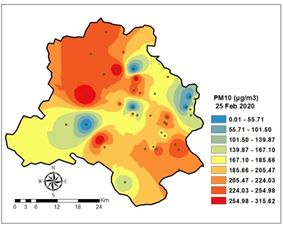
Abstract
In India, the nationwide lockdown due to COVID-19 has been implemented on 25 March 2020. The
lockdown restrictions on more than 1.3 billion people have brought exceptional changes in the air quality
all over the country. This study aims to analyze the levels of three major pollutants (PM2.5, PM10, and
NO2) before and during the lockdown in Delhi, one of the world’s most polluted cities. The data for PM2.5,
PM10, and NO2 concentrations are derived from 38 ground stations dispersed within the city. The spatial
interpolation maps of pollutants for two times are generated using Inverse Distance Weighting (IDW)
model. The results indicate the lowering of PM2.5, PM10, and NO2 concentrations in the city by 93%, 83%,
and 70% from 25 February 2020 to 21 April 2020 respectively. It is found that before one month of the
lockdown the levels of air pollution in Delhi were critically high and far beyond the guideline values set by
the World Health Organization. The levels of air pollution are historically low after the lockdown.
Considering the critically degraded air quality for decades and higher morbidity and mortality rate due to
unhealthy air in Delhi, the improvement in air quality due to lockdown may result as a boon for the better
health of the city’s population.

Introduction
The world is facing unforeseen challenges to cope up with the unprecedented growth of Coronavirus
Disease (COVID-19). The exponential widespread of the COVID-19 have made it a global pandemic that
has led to pernicious consequences in various parts of the world. First identi ed in December month of
2019, in the province of Wuhan, China (Kucharski et al. 2020; Zhu et al. 2020), COVID-19, around four
months later have adversely affected life and economy in more than hundred countries (WHO 2020). To
curb the spread of this highly contagious disease and minimize the fatality, different countries have
adopted drastic yet important measures to reduce interaction among individuals such as banning large-
scale public and private gatherings, imposing a curfew, restraining transportation, promoting social
distancing, strict quarantine instructions, and locking down the country, states and cities, depending on
the country-speci c situation.

On the one hand, the cost of enacting, the preventive measures against COVID-19 are immense, but on
the brighter side, it could have some signi cant bene ts on society. Among them, locking down the
country might do contribution to the improvement of overall environmental conditions. This improvement
may partially equilibrate the cost of these counter COVID-19 measures. For example, according to Singh
and Chakraborty (2020), cities across India, which was home to 14 of the 20 most polluted cities in the
world last year, are breathing some of the cleanest air after the nationwide implementation of lockdown.
Recently, many researchers have attempted to study the effect of COVID-19 lockdown on air pollution at
different levels (Dutheil et al. 2020; Sharma et al. 2020; Wang et al. 2020; Li et al. 2020; Muhammad et al.
2020).

Since the 1990s, Delhi has been ranked as one of the most polluted cities among the world’s developing
countries (Gurjar et al. 2004; WHO 2016). Particularly, in the northern part of India, air pollution caused
                                                  Page 2/19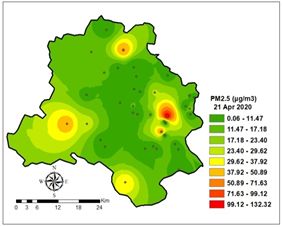
due to the onsite burning of agricultural crop residue is one of the many causes of critical levels of air
pollution (Satyendra et al. 2013). These higher levels of air pollution in the overcrowded Delhi cause
signi cant public health problems (Dholakia et al. 2013; Rizwan et al. 2013). Due to very high levels of air
pollution, in 2017, a community health emergency was declared in Delhi by the Indian Council of Medical
Research (Chowdhury et al. 2019). Recent research point out that vehicular emission has shown a
decreasing trend in the last decade. But, the overall particulate matter concentration has seen a
consistent rise (Gujrar et al. 2016; Nagpure et al. 2016). Moreover, air pollution also has severe
implications on society, economy, and the environment including climate change. Therefore, it has
become of paramount public health, environmental, and development point of concern (Kampa and
Castanas 2008).

India rst announced a public curfew on 22 March 2020 and later imposed nationwide lockdown from 25
March 2020 till 15 April and extended it further till 3 May 2020 to contain the spread of the virus. Looking
at the severity of increasing numbers of infections, the third phase of lockdown was extended till 17 May
2020 with the classi cation of districts into three severity zones i.e. Red, Orange, and Green. However, the
extent of lockdown varies across different countries and cities around the globe depending on the level of
cases. Undoubtedly, the lockdown has put a temporary rest to a signi cant number of social and
economic activities in the country and its people (Alvarez et al. 2020; Inoue and Todo 2020; Karin et al.
2020). Overall, the signi cance and impacts of lockdown are yet not well understood and likely to have a
signi cant role in the restoration of air quality (Mahato et al 2020). Therefore, understanding the
temporary improvement in air quality of Delhi, one of the most polluted cities in the world; due to COVID-
19 lockdown is important because this could be considered as an effective alternative measure to
combat air pollution issues. Nationwide lockdown amid the COVID-19 outbreak has created a unique
scope for researchers to work in this direction and to suggest future policy measures to control air
pollution in cities with degraded air quality. Addressing the above-mentioned points, the present study
aims to understand the impact of COVID-19 lockdown on the air quality of Delhi by comparing the levels
of air pollutants (PM2.5, PM10, and NO2) before and during the lockdown. When most of the recent studies
have dealt with national level measurement of air pollution based on satellite estimates (Dutheil et al.
2020; Sharma et al. 2020; Wang et al. 2020; Li et al. 2020; Muhammad et al. 2020), this study attempts to
analyze data from 38 ground monitoring stations to study the lockdown effect in Delhi.

Study Area

Delhi, o cially the National Capital Territory of Delhi (NCT), is a city and a union territory of India located
at 28.61° N 77.23° E (Fig. 1). This city is the administrative and second nancial capital of India. With the
geographical area of 1485 km2, Delhi holds the second position in the list of leading megacities of the
world (United Nations 2018). It stands as India’s largest urban agglomeration with more than 1.5 crore
population with population density of 11297 people per km2 (Chandramouli and General 2011). Two
prominent features about the geography of Delhi are the Yamuna ood plains and the Delhi ridge. The
Yamuna River was the historical boundary between Punjab and UP, and its ood plains provide fertile
alluvial soil suitable for agriculture but are prone to recurrent oods. Delhi has been continuously
                                                   Page 3/19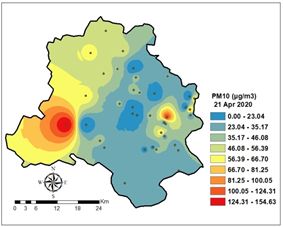
inhabited since the sixth century BC (Asher 2000). Through most of its history, Delhi has served as a
capital of various kingdoms and empires. It has been captured, ransacked and rebuilt several times,
particularly during the medieval period, and modern Delhi is a cluster of many cities spread across the
metropolitan region (Sikarwar and Chattopadhyay 2020).

Data And Methods
In order to assess the air quality status of Delhi before and during the lockdown period, data from thirty-
eight air quality monitoring stations situated at various parts of the city has been taken into consideration
(Table 1). These ground monitoring stations are managed under the authority of three main
organizations namely CPCB (Central Pollution Control Board), DPCC (Delhi Pollution Control Committee),
and IMD (Indian Meteorological Department). The 24-hour average concentration of three major
pollutants including Particulate Matter 2.5 (PM2.5), Particulate Matter 10 (PM10), and Nitrogen Dioxide
(NO2) have been obtained from the CPCB online dashboard for air quality data dissemination
(https://app.cpcbccr.com/ccr/#/caaqm-dashboard-all/) running by the Central Control Room for Air
Quality Management.

The analysis is divided into two sections. In the rst section, the trend of daily average (24-hour)
concentrations of PM2.5, PM10, and NO2 are studied before and during the lockdown. Considering 25
March (start of the lockdown) as a baseline, the average concentrations of air pollutants were studied
from 25 February to 21 April to understand the temporal changes. The second section deals with the
mapping of spatial changes in the levels of air pollution before and during the lockdown. The spatially
interpolated maps of concentrations of air pollutants on 25 February and 21 April have been generated to
estimate the spatial changes in air quality in the city.

Interpolation methods, in general, share the same basic mathematical foundation. They all estimate the
value at an unmeasured location as a weighted average of the measurements at surrounding monitoring
stations. They differ in their choice of sample weights and the surrounding stations (Xie et al. 2017). This
study has used the Inverse Distance Weighting (IDW) method of spatial interpolation of air pollutants. In
air pollution modeling the IDW method is popular and widely used among scholars (Hoek et al. 2002;
Salam et al. 2005; Neupane et al. 2010; Chen et al. 2014). It is applied operationally by the Environmental
Protection Agency (EPA) for generating real-time O3, PM10, and Air Quality Index spatial predictions in
nationwide scales (Deligiorgi and Philippopoulos 2011). The value Z0 at the unknown point is calculated
as: (see Equation 1 in the Supplementary Files)

Where Z0 is the estimation value of variable z at point i, Zi is the sample value in point i, di is the distance
of the sample point to the estimated point, N is the coe cient that determines weight based on a
distance, and n is the total number of predictions for each validation case.

The basic principle of the interpolation methods is based on the assumption that points closer to each
other are highly correlated and similar than those farther. This method will be used by a region in which

                                                    Page 4/19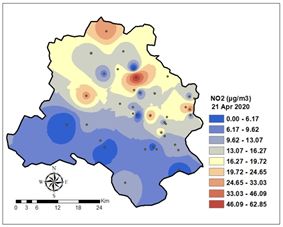
there are enough sample points (at least 14 points) that are spatially dispersed all over the region
(Burrough and McDonnell 1998).

Table 1 Details of the ground monitoring stations selected for the study

                                                    Page 5/19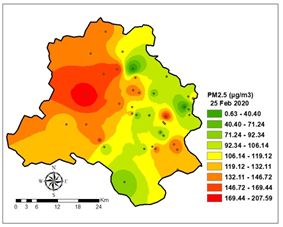
Station name            Latitude         Longitude
              (authority)

Sr no.

         1    Alipur, Delhi - DPCC    28.797226°       77.133136°
              Anand Vihar, Delhi -
         2    DPCC                    28.650218°       77.302706°
              Ashok Vihar, Delhi -
         3    DPCC                    28.690979°       77.176524°
              Aya Nagar, Delhi -
         4    IMD                     28.472044°       77.132942°
              Bawana, Delhi -
         5    DPCC                    28.793229°       77.048335°
              Burari Crossing,
         6    Delhi - IMD             28.755130°       77.160724°
              Dr. Karni Singh
              Shooting Range,
         7    Delhi- DPCC             28.499727°       77.267095°

         8    DTU, Delhi - CPCB       28.749987°       77.118314°
              Dwarka-Sector 8,
         9    Delhi - DPCC            28.572038°       28.572038°
              East Arjun Nagar,
         10   Delhi - CPCB            28.656173°       77.294747°
              IGI Airport (T3),
         11   Delhi - IMD             28.555084°       77.084401°
              IHBAS, Dilshad
              Garden, Delhi -
         12   CPCB                    28.681169°       77.304712°

         13   ITO, Delhi - CPCB       28.627541°       77.243793°
              Jahangirpuri, Delhi -
         14   DPCC                    28.729617°       77.166631°
              Jawaharlal Nehru
              Stadium, Delhi -
         15   DPCC                    28.582846°       77.234366°
              Lodhi Road, Delhi -
         16   IMD                     28.591063°       77.228079°
              MDCNS, Delhi -
         17   DPCC                    28.612547°       77.237335°
              Mandir Marg, Delhi
         18   - DPCC                  28.634175°       77.200475°
              Mathura Road,
         19   Delhi - IMD             28.611254°       77.240116°
              Mundka, Delhi -
         20   DPCC                    28.682314°       77.034937°
              Najafgarh, Delhi -
         21   DPCC                    28.609013°       76.985453°
              Narela, Delhi -
         22   DPCC                    28.854882°       77.089215°
              Nehru Nagar, Delhi
         23   - DPCC                  28.563867°       77.260810°
              North Campus, DU,
         24   Delhi - IMD             28.688944°       77.214125°
         25   NSIT Dwarka, Delhi      28.610273°       77.037882°
                                           Page 6/19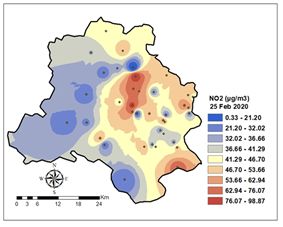
- CPCB
                       Okhla Phase-2,
                  26   Delhi - DPCC          28.549291°           77.267814°
                       Patparganj, Delhi -
                  27   DPCC                  28.634731°           77.304571°
                       Punjabi Bagh, Delhi
                  28   - DPCC                28.661975°           77.124156°

                  29   Pusa, Delhi - DPCC    28.637672°           77.157144°

                  30   Pusa, Delhi - IMD    28.634055°            77.167847°
                       R K Puram, Delhi -
                  31 DPCC                   28.550350°            77.185149°
                       Rohini, Delhi -
                  32 DPCC                   28.738268°            77.082215°
                       Shadipur, Delhi -
                  33 CPCB                   28.651027°            77.156220°
                       Sirifort, Delhi -
                  34 CPCB                   28.550583°            77.214799°
                       Sonia Vihar, Delhi -
                  35 DPCC                   28.733247°            77.249589°
                       Sri Aurobindo Marg,
                  36 Delhi - DPCC           28.556310°            77.206338°
                       Vivek Vihar, Delhi -
                  37 DPCC                   28.671246°            77.317654°
                       Wazirpur, Delhi -
                  38 DPCC                   28.697544°            77.160440°
 DPCC: Delhi Pollution Contro Committee, IMD: Indian Meteorological Department,
 CPCB: Central Pollution Control Board
                                                         Source: Central Control
 Room for Air Quality Management, Delhi NCR

Results And Discussion
Temporal trends of air pollution before and during lockdown

It is evident from Table 2 and Fig. 2 that there has been a signi cant change in the levels of PM2.5 before
and during the days of COVID-19 lockdown in Delhi. All the stations in the city have recorded considerable
lowering of PM2.5 concentration during the studied period. The average PM2.5 concentration in the city
has reduced from 122.48 µg/m3 on 25 February 2020 to 17.71 µg/m3 on 21 April 2020. Moreover, in the
beginning, all the stations within the city have reordered PM2.5 concentration far beyond the standard (25
µg/m3) set by the WHO. Noteworthy point here is that, on the last day of studied time, 29 stations out of
the 35 have recorded PM2.5 concentration below the WHO standard.

The levels of PM10 concentration have strikingly reduced all over Delhi after the imposition of COVID-19
lockdown in the city (Fig. 2). Table 2 shows the declining levels of PM10 concentration before lockdown
(25 February) and during lockdown (21 April). It should be noted that the average PM10 concentration in
the city has remarkably reduced to 47.46 µg/m3 on 21 April (during lockdown) from the critically higher

                                                 Page 7/19
level of 216.49 µg/m3 on 25 February (before lockdown). Furthermore, the concentration of PM10 was
recorded extremely higher than the WHO standards (50 µg/m3) in all the stations. These critical levels of
PM10 in the city have reduced after the lockdown and 17 out of 31 stations have recorded the
concentration below WHO standards.
Table 2 illustrates the NO2 concentrations in Delhi at various stations for two time periods i.e. before
COVID-19 lockdown (25 February 2020) and during COVID-19 lockdown (21 April 2020). All the stations
have recorded a pronounced reduction in NO2 concentrations during the considered time span. Though
the majority of the stations have recorded NO2 concentrations below the WHO standard (80 µg/m3), the
average 24-hour levels have further dropped from 46.40 µg/m3 on 25 February to 15.82 µg/m3 on 21
April. The trend of day to day NO2 concentration levels before and during the lockdown in all the stations
of Delhi has been presented by the line diagram (Fig. 2). There has been a remarkable lowering of NO2
levels after 24 March when the COVID-19 lockdown started in India. It is also noticeable that the levels of
NO2 are considerably under control in the city compared to the critical levels of particulate matter.
It is indicative that the levels of air pollution declined gradually over the studied time period with a steep
fall from 25 March and reached to historically lower levels.
Spatial changes in the level of air pollution before and during lockdown
Fig. 3 and Fig. 4 show the interpolated surface of PM2.5 in Delhi at two times considered in the study.
Before lockdown (25 February), the stations have recorded higher levels of PM2.5 and the maximum areas
of the city have PM2.5 concentration above 106 µg/m3. Furthermore, our analysis found that the
concentration was signi cantly high in the western part of the city but these concentration levels have
gone/trickled down remarkably during the lockdown (25 February) when PM2.5 concentration was below
30 µg/m3 in the maximum areas of the city .
The concentration of PM10 in the city before and during lockdown is presented with spatially interpolated
surface maps (Fig. 5 and Fig. 6). Before lockdown (25 February), the concentration of PM10 was critically
high, when PM10 concentration was observed above 140 µg/m3 in maximum areas of Delhi. The areas in
the north-west and south-east directions exhibit the presence of extreme level of PM10 in the air. However,
these concentration levels have reduced signi cantly to lower levels during the lockdown (25 February) as
the maximum area of the city has PM10 concentration below 56 µg/m3.
Fig. 7 and Fig. 8 present the spatially interpolated surface of NO2 concentrations before and during the
lockdown in Delhi. From the surface maps, it becomes clear that the NO2 concentration in Delhi has
reduced to notable levels after the implementation of lockdown in the city. The analysis shows, that
before the lockdown, mainly the eastern part of the city had higher concentrations of NO2, which further
declined during the lockdown. It was also found that, the southern part of the city has experienced better
Page 8/19air quality in terms of NO2, during the lockdown. However, the levels of NO2 concentration remained
higher for the Jahangirpuri station situated on the northern side of the city.
Table 2 Levels of PM2.5, PM10 and NO2 concentration at various stations of Delhi before and during COVID-19
lockdown
Page 9/19Sr no. Station Before COVID-19 lockdown (25 During COVID-19 lockdown (21 April
name February 2020) 2020)
PM2.5 PM10 NO2 PM2.5 PM10 NO2
1 Alipur, 110.12 206.45 52.61 52.61 52.61 13.4
Delhi -
DPCC
2 Anand 88.52 209.39 57.14 20.88 81.18 33.55
Vihar, Delhi
- DPCC
3 Ashok 136.33 218.4 62.79 8 36.5 6.2
Vihar, Delhi
- DPCC
4 Aya Nagar, 72.75 154.72 24.52 36.88 34.54 12.2
Delhi - IMD
5 Bawana, 140.54 236.46 36.48 13.64 61.27 12.95
Delhi -
DPCC
6 Burari NA NA NA NA NA NA
Crossing,
Delhi - IMD
7 Dr. K S 124.28 206.47 75.09 4.6 24.75 1.32
Shooting
Range,
Delhi -
DPCC
8 DTU, Delhi 167.98 300.16 33.55 6.95 46.41 16.44
- CPCB
9 Dwarka- 151.08 293.88 55.41 8.68 39.23 9.59
Sector 8,
Delhi -
DPCC
10 East Arjun NA NA 65.67 NA NA 20.85
Nagar,
Delhi -
CPCB
11 IGI Airport 92.32 191.91 27.62 7.68 28.81 NA
(T3), Delhi
- IMD
12 IHBAS, 103.69 NA 52.32 11.35 NA 10.06
Dilshad
Garden,
Delhi -
CPCB
13 ITO, Delhi - 177.24 238.21 28.17 133.46 128.89 18.67
CPCB
14 Jahangirpur 132 275.5 99.03 10.95 39.41 62.99
i, Delhi -
DPCC
15 Jawaharlal 90.64 176.33 41.04 3 27.77 8.8
Nehru
Stadium,
Delhi -
DPCC
16 Lodhi 84.02 175.81 31.17 59.93 73.8 22.58
Road, Delhi
Page 10/19- IMD
17 MDCNS, 117.83 204.93 59.93 7.35 22.85 8.84
Delhi -
DPCC
18 Mandir 90.78 204.65 54.45 14.05 38.3 26.14
Marg, Delhi
- DPCC
19 Mathura 100.97 234.49 45.94 6.94 39.63 15.52
Road, Delhi
- IMD
20 Mundka, 207.6 315.64 25.94 9 62 26
Delhi -
DPCC
21 Najafgarh, 119.46 164.06 27.54 46.24 154.73 NA
Delhi -
DPCC
22 Narela, 136.15 245.52 44.75 6.3 52.4 30.49
Delhi -
DPCC
23 Nehru 147.88 241.8 34.14 7.72 29.5 11.88
Nagar,
Delhi -
DPCC
24 North 84.09 172 31.67 24.4 NA 12.88
Campus,
DU, Delhi -
IMD
25 NSIT 134.63 NA 30.89 28.05 NA 11
Dwarka,
Delhi -
CPCB
26 Okhla 133.5 238.27 48.61 8.5 33.1 10.58
Phase-2,
Delhi -
DPCC
27 Patparganj, 106.91 144.35 29.41 4.18 27.09 8.72
Delhi -
DPCC
28 Punjabi 146.86 212.91 41.87 7.67 37.36 13.67
Bagh, Delhi
- DPCC
29 Pusa, Delhi 131.78 215.6 71.16 1.08 22.45 18
- DPCC
30 Pusa, Delhi 73.27 152.18 14.15 NA NA NA
- IMD
31 R K Puram, 98.73 219.36 54.32 5.75 21.2 7.55
Delhi -
DPCC
32 Rohini, 164.95 233.29 26.12 11.91 56.09 8.06
Delhi -
DPCC
33 Shadipur, 107.44 NA 86.72 13.21 NA 11.15
Delhi -
CPCB
34 Sirifort, 144.53 254.05 47.74 7.8 38.85 9.08
Page 11/19Delhi -
CPCB
35 Sonia 104.68 183.97 47.29 6.2 35.3 17.27
Vihar, Delhi
- DPCC
36 Sri 113.35 174.23 32.3 5 19 2.66
Aurobindo
Marg, Delhi
- DPCC
37 Vivek 124.02 199.71 43.5 9.5 64 16.41
Vihar, Delhi
- DPCC
38 Wazirpur, 148.51 249.38 75.81 10.3 42.2 22.29
Delhi -
DPCC
Average 122.48 216.49 46.40 17.71 47.46 15.82
N.A.= data not available for particular day
Source: Central Control Room for Air Quality Management, Delhi NCR
Conclusion
Since many Indian metro cities have been in the list of the world’s most polluted cities, a sudden
signi cant improvement in the air quality of Delhi has international relevance for environmental policies.
Lockdown due to COVID-19 in various parts of the world has provided an opportunity to measure human
impact on the natural environment particularly in big cities. When urban mega hubs have been running
continuously for economic development without considering the limits of natural resources, measures
like temporary lockdown may emerge as an effective solution to control environmental imbalance.
With the use of the IDW method of spatial interpolation, the study estimated concentrations of PM2.5,
PM10, and NO2 before and during COVID-19 lockdown in Delhi. It is found that the lockdown in the city
has impacted the air quality in a positive manner. The results reveal the reduction in PM2.5, PM10, and
NO2 concentrations in the city by 93%, 83%, and 70% just after one month of lockdown respectively.
Consequently, the levels of air pollution are historically low after the lockdown. Considering the critically
degraded air quality for decades and higher morbidity and mortality rate due to unhealthy air in Delhi, the
improvement in air quality due to lockdown may result as a boon for the better health of the city’s
population. This temporary improvement in the air of capital city gives a positive indication towards
another chance to mitigate the damage we have done to the environment. Therefore, the study should be
considered as a useful supplement to the regulatory authorities that may lead to reconsider the current
plan and policies to combat degraded air quality in the city.
Declarations
Competing interests: The authors declare no competing interests.
Page 12/19References
Alvarez FE, Argente D, Lippi F (2020) A simple planning problem for covid-19 lockdown. National Bureau
of Economic Research. https://doi.org/10.3386/w26981
Asher CB (2000) Delhi Walled: Changing Boundaries: The Urban Enceinte in Global Perspective. In City
Walls: The Urban Enceinte in Global Perspective. Cambridge
Burrough PA, McDonnell RA (1998) Creating continuous surfaces from point data. Principles of
Geographic Information Systems. Oxford University Press, Oxford, UK
Chandramouli C, General R (2011) census of India 2011. Provisional population totals. New Delhi:
Government of India
Chen G, Li J, Ying Q, Sherman S, Perkins N, Sundaram R, Mendola P (2014) Evaluation of observation-
fused regional air quality model results for population air pollution exposure estimation. Science of the
total environment. https://doi.org/10.1016/j.scitotenv.2014.03.107
Chowdhury S, Dey S, Guttikunda S, Pillarisetti A, Smith KR, Di Girolamo L (2019) Indian annual ambient
air quality standard is achievable by completely mitigating emissions from household sources.
Proceedings of the National Academy of Sciences. https://doi.org/10.1073/pnas.1900888116
Deligiorgi D, Philippopoulos K (2011) Spatial interpolation methodologies in urban air pollution modeling:
application for the greater area of metropolitan Athens, Greece. In: Advanced Air Pollution.
https://doi.org/10.5772/17734
Dholakia HH, Purohit P, Rao S, Garg A (2013) Impact of current policies on future air quality and health
outcomes in Delhi, India. Atmospheric environment. https://doi.org/10.1016/j.atmosenv.2013.04.052
Dutheil F, Baker JS, Navel V (2020) COVID-19 as a factor in uencing air pollution?. Environmental
Pollution. https://doi.org/10.1016/j.envpol.2020.114466
Gurjar BR, Ravindra K, Nagpure AS (2016) Air pollution trends over Indian megacities and their local-to-
global implications. Atmospheric Environment. https://doi.org/10.1016/j.atmosenv.2016.06.030
Gurjar BR, Van Aardenne JA, Lelieveld J, Mohan M (2004) Emission estimates and trends (1990–2000)
for megacity Delhi and implications. Atmospheric Environment.
https://doi.org/10.1016/j.atmosenv.2004.05.057
Hoek G, Brunekreef B, Goldbohm S, Fischer P, van den Brandt PA (2002) Association between mortality
and indicators of tra c-related air pollution in the Netherlands: a cohort study. The lancet.
https://doi.org/10.1016/s0140-6736(02)11280-3
Page 13/19Inoue H, Todo Y (2020) The propagation of the economic impact through supply chains: The case of a
mega-city lockdown to contain the spread of COVID-19. Covid Economics.
https://doi.org/10.2139/ssrn.3564898
Kampa M, Castanas E (2008) Human health effects of air pollution. Environmental pollution.
https://doi.org/10.1016/j.envpol.2007.06.012
Karin O, Bar-On YM, Milo T, Katzir I, Mayo A, Korem Y, Dudovich B, Yashiv E, Zehavi AJ, Davidovich N, Milo
R (2020) Adaptive cyclic exit strategies from lockdown to suppress COVID-19 and allow economic
activity. medRxiv. https://doi.org/10.1101/2020.04.04.20053579
Kucharski AJ, Timothy WR, Charlie D et al (2020) Early dynamics of transmission and control of COVID-
19: a mathematical modelling study. The lancet infectious diseases. https://doi.org/10.1016/s1473-
3099(20)30144-4
Li L, Li Q, Huang L, Wang Q, Zhu A, Xu J, Liu Z, Li H, Shi L, Li R, Azari M (2020) Air quality changes during
the COVID-19 lockdown over the Yangtze River Delta Region: An insight into the impact of human activity
pattern changes on air pollution variation. Science of The Total Environment.
https://doi.org/10.1016/j.scitotenv.2020.139282
Mahato S, Pal S, Ghosh KG (2020) Effect of lockdown amid COVID-19 pandemic on air quality of the
megacity Delhi, India. Science of the Total Environment. https://doi.org/10.1016/j.scitotenv.2020.139086
Muhammad S, Long X, Salman M (2020) COVID-19 pandemic and environmental pollution: A blessing in
disguise?. Science of The Total Environment. https://doi.org/10.1016/j.scitotenv.2020.138820
Nagpure AS, Gurjar BR, Kumar V, Kumar P (2016) Estimation of exhaust and non-exhaust gaseous,
particulate matter and air toxics emissions from on-road vehicles in Delhi. Atmospheric environment.
https://doi.org/10.1016/j.atmosenv.2015.12.026
Neupane B, Jerrett M, Burnett RT, Marrie T, Arain A, Loeb M (2010) Long-term exposure to ambient air
pollution and risk of hospitalization with community-acquired pneumonia in older adults. American
journal of respiratory and critical care medicine. https://doi.org/10.1164/rccm.200901-0160oc
Rizwan SA, Nongkynrih B, Gupta SK (2013) Air pollution in Delhi: its magnitude and effects on health.
Indian journal of community medicine: o cial publication of Indian Association of Preventive & Social
Medicine. https://doi.org/10.4103/0970-0218.106617
Salam MT, Millstein J, Li YF, Lurmann FW, Margolis HG, Gilliland FD (2005) Birth outcomes and prenatal
exposure to ozone, carbon monoxide, and particulate matter: results from the Children’s Health Study.
Environmental health perspectives. https://doi.org/10.1289/ehp.8111
Satyendra T, Singh RN, Shaishav S (2013) Emissions from crop/biomass residue burning risk to
atmospheric quality. Int Res J Earth Sci 1(1):1-5
Page 14/19Sharma S, Zhang M, Gao J, Zhang H, Kota SH (2020) Effect of restricted emissions during COVID-19 on
air quality in India. Science of The Total Environment. https://doi.org/10.1016/j.scitotenv.2020.138878
Sikarwar A, Chattopadhyay A (2020) Analyzing Population and Land Use Change: Selected Case Studies
of Indian Metropolitan Cities. Springer, Singapore. https://doi.org/10.1007/978-981-15-5036-2
Singh RK, Chakraborty D (2020) World’s Dirtiest Air Gets Cleaner After India’s Lockdown. Bloomberg-
Quint. https://www.bloombergquint.com/. Accessed on 1 May 2020
United Nations Department of Economic and Social Affairs (2018) Revision of world urbanization
prospects
Wang P, Chen K, Zhu S, Wang P, Zhang H (2020) Severe air pollution events not avoided by reduced
anthropogenic activities during COVID-19 outbreak. Resources, Conservation and Recycling.
https://doi.org/10.1016/j.resconrec.2020.104814
World Health Organization (2016) WHO global urban ambient air pollution database (update 2016).
Geneva, Switzerland: WHO
World Health Organization (2020) Coronavirus disease (COVID-2019) situation reports. https://www.
WHO. Int/docs/default-source/coronaviruse/situationreports/20200221-sitrep-32-covid. Accessed on 28
April 2020
Xie X, Semanjski I, Gautama S, Tsiligianni E, Deligiannis N, Rajan RT, Pasveer F, Philips W (2017) A review
of urban air pollution monitoring and exposure assessment methods. ISPRS International Journal of Geo-
Information. https://doi.org/10.3390/ijgi6120389
Zhu N, Zhang D, Wang W et al (2020) A novel coronavirus from patients with pneumonia in China, 2019.
New England Journal of Medicine. https://doi.org/10.1056/nejmoa2001017
Figures
Page 15/19Figure 1
Location map of Delhi showing the administrative extent and ground monitoring stations considered in
the present study
Figure 2
Trend of PM2.5, PM10, and NO2 concentrations before and during the lockdown in Delhi
Page 16/19Figure 3
Spatial concentrations of PM2.5 in Delhi before COVID-19 lockdown (25 February 2020)
Figure 4
Spatial concentrations of PM2.5 in Delhi during COVID-19 lockdown (21 April 2020)
Figure 5
Spatial concentrations of PM10 in Delhi before COVID-19 lockdown (25 February 2020)
Page 17/19Figure 6
Spatial concentrations of PM10 in Delhi during COVID-19 lockdown (21 April 2020)
Figure 7
Spatial concentrations of NO2 in Delhi before COVID-19 lockdown (25 February 2020)
Figure 8
Spatial concentrations of NO2 in Delhi during COVID-19 lockdown (21 April 2020)
Page 18/19Supplementary Files
This is a list of supplementary les associated with this preprint. Click to download.
Equation.pdf
Page 19/19You can also read