WHY WE STILL NEED TO TALK ABOUT NATURAL GAS IN 2019 - www.gmbscotland.org Professor Karen Turner & Mark Lappin - GMB ...
←
→
Page content transcription
If your browser does not render page correctly, please read the page content below
WHY WE STILL
NEED TO TALK
ABOUT
NATURAL GAS
IN 2019

                  Professor Karen Turner & Mark Lappin
                  University of Strathclyde Centre for Energy Policy

www.gmbscotland.org
 @GMBScotOrg   /GMBScotland      @GMB_Scotland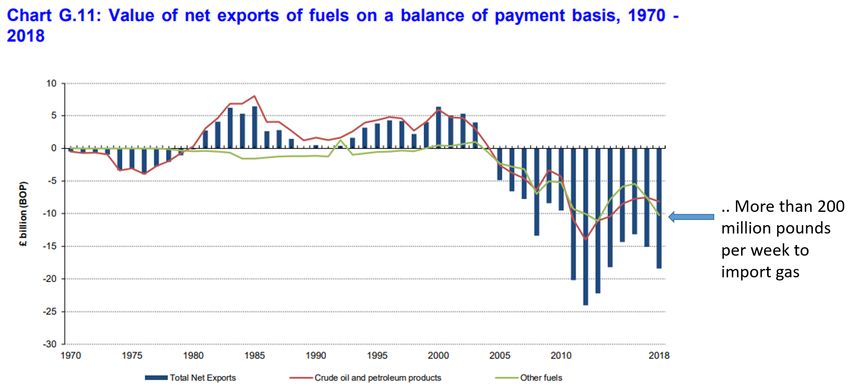
CONTENTS

Foreword from Gary Smith, GMB Scotland                      1

Introduction                                                2

The production, use & supply of natural gas                 3

   - What is natural gas?                                   3

   - How do we use natural gas in the UK energy mix?        3

   - How do countries other than the UK use gas?            5

   - Where do we get natural gas from?                      5

   - Which countries are exporting gas into the UK?         7

   - How have imports changed over time?                    9

What does use of gas mean for the public and the climate?   10

   - What are the implications for households?              10

   - What role can natural gas play in a net zero carbon    11
     economy?

References                                                  13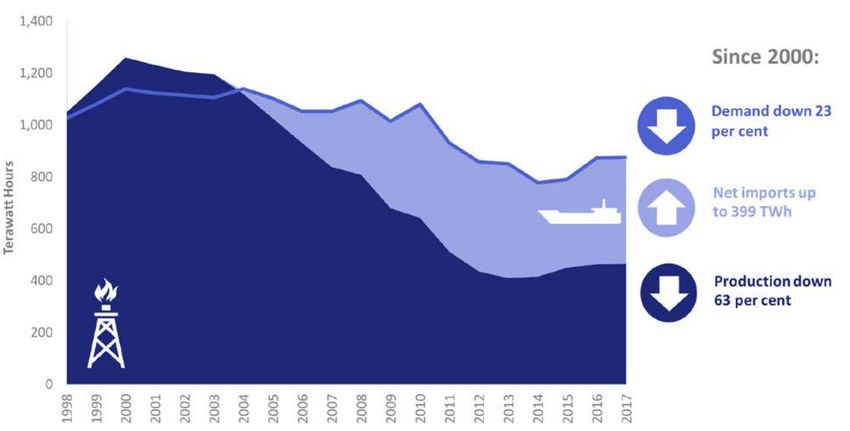
FOREWORD

The continued uncertainty surrounding Brexit really should focus the minds of the public and
politicians on domestic energy supply and how best we can keep prices affordable, homes warm,
business powered and the country resilient.

That doesn’t mean abandoning our commitments to carbon emissions reductions and defending the
future of the planet, far from it. It’s about finding the right formula for our energy future that
delivers environmental change, meets public need and secures supply.

GMB believes the energy debate lacks nuance. It is increasingly polarised between “leave it in the
ground” and “maximum economic recovery” at best and green fundamentalists and climate change
deniers at worst. Few people talk about finding a balance or seem interested in finding one.

Scotland is no different. The furore around Oil & Gas UK’s recent “Roadmap 2035” is a case in point.
Weeks after the Scottish Government declared a climate emergency the oil and gas industry put
forward proposals for maximum extraction from the North Sea, prompting the green lobby to call on
the Scottish Government to immediately sever its support for oil and gas.

But it’s often overlooked, however, that our gas needs in 2050 will be similar to what they are today.
In a net-zero environment we’ll still need gas. So the big question posed by GMB to everyone in the
debate is not whether we need gas, but where are we going to get it from?

That’s why this paper produced by the respected Centre for Energy Policy is a timely and much
needed offering of reality in a debate all too often dominated by rhetoric. It sets out the basic facts
concerning our use of natural gas and our supply versus the global picture on carbon emissions.

We believe it is a time for choosing. On the journey to a low-carbon economy we can either become
an exclusive net importer of gas or we can consolidate a domestic gas supply to help meet our
needs. And as a trade union which priorities jobs and work, we ask decision-makers for honesty on
what our energy future holds for the workers and their families currently employed within our gas
and gas-related industries.

GMB Scotland believes that tackling climate change and defending our energy and economic
interests are not contradictory issues, but we need an open and reasoned discussion about how best
to play our part in the global response to the climate emergency.

We hope this paper contributes to such a process here in Scotland, and across the rest of the UK.

                                                                  GMB Scotland Secretary, Gary Smith

                                                   1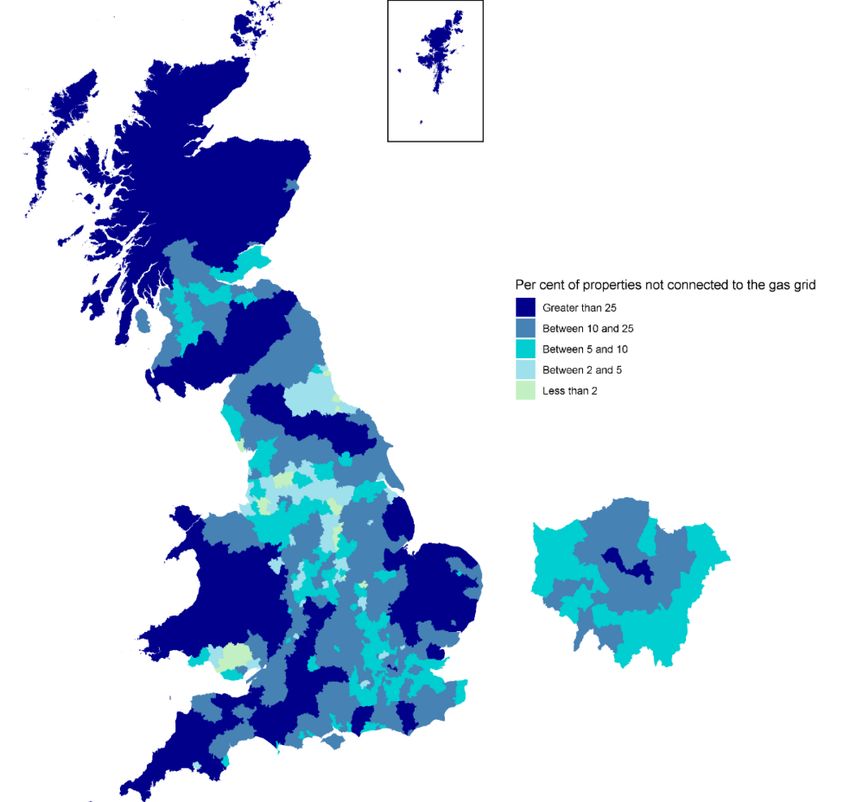
Why we still need to talk about natural gas in 2019

 Professor Karen Turner and Mark Lappin of the University of Strathclyde Centre for Energy Policy

INTRODUCTION

This paper provides an update to the document published in 2017 called ‘Natural Gas in the Energy
Policy of the UK and Scotland’ 1 . It is timely to update this report because many aspects of natural gas
in UK have changed. This report will review these changes by posing and answering a series of
questions with reference to facts and data from government reports, various analysis and press
release:

    1. Given the growing focus upon alternative fuels in our energy supply, this report will ask “What
       is natural gas?” and “How do we use natural gas?” and comparing with “How do countries
       other than UK use natural gas?” as this is increasingly a global matter.

    2. Given our continued and growing dependence upon natural gas to heat homes, cook food and
       produce electricity this report will ask and answer the question “Where do we get natural gas
       from?”.

    3. With the growing concern over global climate change, this report will ask and answer the
       question: “How may gas fit into a net zero greenhouse gas emissions society?” consistent with
       UK Government policy.

Answering these questions leads to the conclusion that the UK is highly dependent upon a supply of
natural gas as a reliable and relatively affordable form of energy; that, after almost 50 years of
domestic production, a dwindling offshore supply makes us highly dependent upon imports which has
implications for jobs, national balance of payments and for the environment.

                                                   2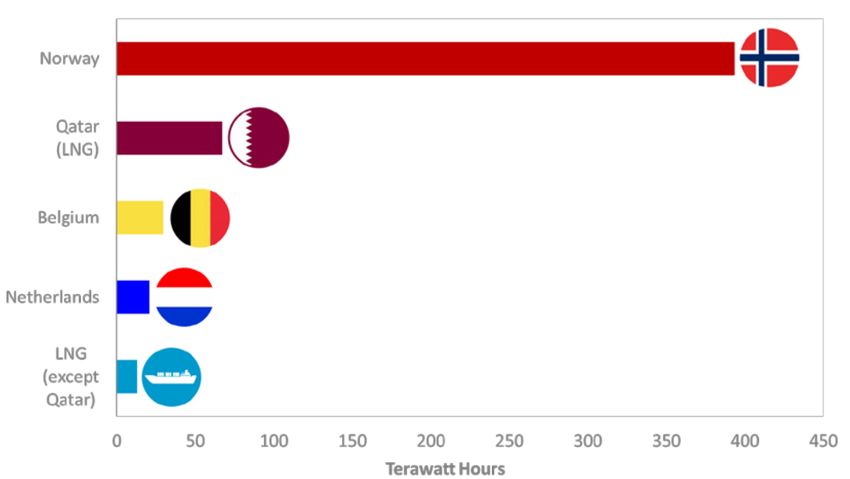
THE PRODUCTION, SUPPLY AND USE OF NATURAL GAS

What is ‘natural gas’?

Natural gas is the term usually given to a flammable gas that is colourless and odourless. The smell we
associate with gas is introduced into the pipeline grid in order to allow detection in the event of a leak.
Natural gas can be a mix of hydrocarbons but is dominantly methane (CH4), comprising a carbon atom
and four hydrogen atoms. When it is burned, the carbon and hydrogen atoms combine with oxygen
to create Carbon Dioxide (CO2) and Water (H2O) as well as energy.

The term ‘natural gas’ comes from the fact that it used to occur as a by-product from generating coke
from coal for the steel industry. The by-product, useful for heating homes and generating electricity,
was called ‘Town Gas’ and the old gas storage ‘gasometers’ are still visible around towns of the UK
today.

Natural gas is generated when large volumes of organic material, typically plant matter, decay over
long periods of time and the methane given off during decomposition is buried by layers of sediment.
Much of the gas we produce from the UK was generated from decay of plants which grew over 300
million years ago in rainforest when the UK was positioned over the equator.

Geologists know this prehistoric period as the Carboniferous as it is a source of Carbon (coal and gas)
and iron. Carboniferous coal for energy, and iron, as a raw material for steel, along with a growing
workforce, provided the foundations of the Industrial Revolution, which began in the UK and other
parts of Europe in the 18th Century.

How do we use natural gas in the UK energy mix?

The flammable nature of natural gas largely defines its usefulness. It can be used to cook food in
kitchen appliances and heat homes through gas central heating systems. It is also burned in order to
generate electricity. Heat makes steam and steam drives turbines which generate electricity.

Chart 1: UK Gas Demand 2005-2017
Source: UK Government Department for Business, Energy and Industrial Strategy

                                            UK Natural Gas Demand                                  The UK consumed
                                                                                                   approximately
                          120
                                                                                                   100 billion cubic
                          100
                                                                                                   meters annually
                                                                                                   until the global
   billion cubic metres

                          80                                                                       recession in 2008.
                                                                                                   Gas consumption
                          60                                                                       has steadily
                                                                                                   dropped since
                          40                                                                       2008 and is now
                                                                                                   at approximately
                          20                                                                       80 billion cubic
                                                                                                   meters, or less
                           0                                                                       than 3% of global
                                2005 2006 2007 2008 2009 2010 2011 2012 2013 2014 2015 2016 2017   demand2 .

                                                                    3
The Digest of UK Energy Statistics produced annually by the UK Government published in 2018 states
that “…in 2017 gas met nearly two thirds of total domestic energy demand”. It shows how gas demand
is allocated across the various uses: approximately 37.5% is used to generate electricity; a similar
volume is provided to approximately 24 million homes for central heating and cooking. Approximately
25% is provided to industry and non-domestic customers, such as hospitals and schools, which are
typically heated by gas central heating.
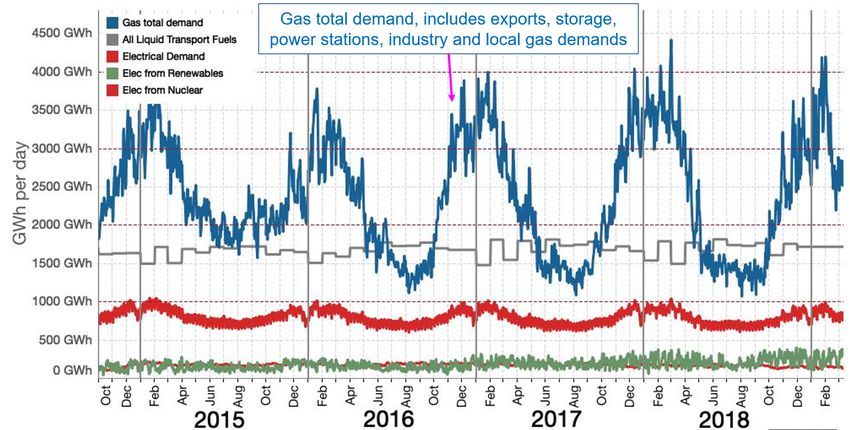
The dominance of gas in UK energy is clearly seen in the chart below produced by Birmingham
University Energy Institution, responding to high demand through winter and lower demand in
summer3
Chart 2: UK energy mix by energy type 2015-2018
Source: Dr Grant Wilson University of Birmingham Energy Institute
Comparing different contributing parts of the total energy mix on an annual basis since 1970 shows
the diminishing role of coal and the growing contribution of natural gas along with renewable energy,
particularly bioenergy 4.
4Chart 3: Annual Energy Mix breakdown
Source: UK Government Department for Business, Energy and Industrial Strategy
How do countries other than UK use gas?
The world used approximately 3.5 trillion cubic metres of natural gas in 2016 according to US
Independent Energy Agency 5 , which predicts a steady rise for the future. The US is the biggest
producer and consumer of natural gas but almost half of the growth is expected to be for Chinese
consumption.
For comparison with UK demand for gas, Germany uses a similar level but still has a high dependency
on coal 6. France has approximately half this level of demand due to a high level of nuclear power for
electricity including for heating.
The USA consumed approximately 1 trillion cubic metres of natural gas in 2017, which is
approximately 10 times more than the UK 7.
China’s demand for natural gas is rising (as is Chinese domestic supply of renewable energy). In 2018
China burnt more than 4 billion tonnes of coal. The entire rest of the world consumes less than this
volume. Severe levels of air pollution in Chinese cities and commitment to the global response to
climate change set the recent government on a track of replacing coal with natural gas and renewables
including wind and solar 8.
In 2017 China converted almost 4 million homes from coal to natural gas with a further 5 million
homes converted during 2018 9.
Where do we get natural gas from?
Since 1969, when gas was first produced from the Hewett Field off the coast of Norfolk, the UK has
had natural gas from reservoirs thousands of feet beneath the surrounding north sea and east Irish
sea. At its peak in 2000, production was 15 billion cubic feet per day 10 but production has been in
steady decline since then. Over recent years it has stabilised to some degree at about 4 billion cubic
feet per day.
5Total UK gas production since the first field came on-stream in 1969 has been 98 trillion cubic feet or
3.25 trillion cubic metres (recall that UK demand is 2.4 trillion cubic feet or 0.08 trillion cubic metres
of gas per year) 11.
Chart 4:UK production of natural gas 1970 to 2018
Source: UK Oil and Gas Authority
This meant that the UK was self-sufficient for its supply of natural gas for decades. Indeed, for most
of the period, UK was a net exporter of natural gas, which along with oil, delivered almost £300 billion
in production tax alone 12.
On top of revenues earned for the public purse, the industry brought jobs. A ‘Work Force Report’
published by Oil and Gas UK 13 showed that in 2008 around 450,000 UK jobs were supported by
offshore oil and gas activities with about 34,000 being directly employed by oil and gas exploration
and production companies. The report estimates that 44% of the jobs supported by the oil and gas
sector, almost 200,000 jobs, are in Scotland. There are no figures available which break these numbers
down to natural gas versus oil exploration and production as many facilities and companies deal with
both.
The same report showed that, for the same year, salaries in the sector averaged £50,000 and
contributed an average of £19,500 per head in income tax.
The decline trend for UK domestic gas production is clear and, while consumption has dropped over
recent years, particularly since the global recession in 2008, production is dropping at a greater rate
meaning UK has become highly dependent upon imports of natural gas for about a decade 14.
6Chart 5: UK production compared with demand 1998 to 2017
Source: UK Government Department for Business, Energy and Industrial Strategy
In 2008 UK domestic production met two-thirds of UK demand. In 2018, imports met more than half
UK demand 15. Imports are expected to rise over the years to approximately 85% by 2050 16.
Cost of importing gas to the UK has risen dramatically over the previous decade. In 2018, UK paid
approximately £10 billion, approximately £200 million per week to import natural gas in order to
meet its energy needs 17.
Chart 6: Net value of fuels on balance of payments 1970 to 2018
Source: UK Government Department for Business, Energy and Industrial Strategy
Which countries are exporting gas into UK?
UK Gas imports divide into 3 groups
1. Pipeline imports direct from the Norwegian North Sea production arrive at Easington on the
east coast of England and Saint Fergus on the east coast of Scotland. These are supplied by
Ormen Lange and Heimdal gas fields respectively. The Ormen Lange pipeline is over 1000 kms
7long and has annual capacity to deliver almost a trillion cubic feet of gas per year (recall UK
annual demand is approximately 2.4 trillion cubic feet per year). The Vesterled pipeline brings
natural gas from Norwegian offshore Heimdal field.
60% of 2017 gas imports were from Norway 18, making up 39% of UK supply overall. If UK
government figures quote two thirds of UK energy being from gas and Norway gas is 39% of
UK supply then it follows that more than a quarter of the UK’s total energy supply is from
Norway.
Chart 7: UK natural gas imports by country of origin 2017
Source: UK Government Department for Business, Energy and Industrial Strategy
Norway has received approximately £20 billion per year for gas exports over the last decade
from UK and other European countries according to official Norwegian Government figures
released in 2017 19.
2. Pipeline from continental Europe. While volumes vary from various sources, a significant but
relatively small proportion (less than 10%) of gas imports arrive into Bacton on the Norfolk
coast from Belgium and the Netherlands. The origin of the gas is from production at fields
throughout Europe, including nearby countries such as Netherlands and Denmark or as far
away as Turkey or Russia.
3. By ship as Liquefied Natural Gas (LNG). Although liquefying methane or natural gas has been
understood since the nineteenth century, it has only been a significant part of the global gas
business since the early 21st century. The growth of liquid natural gas has come about in order
to allow large gas production regions such as Australia, Qatar, USA and Russia to ship natural
gas to other regions of the world in need of gas imports such as China, Europe, Japan, without
having to construct a pipeline, which is expensive and ties both supplier and importer into an
inflexible long-term deal. There is more than one method for causing methane gas to become
liquid but all methods involve chilling the gas to below -250 degrees Fahrenheit 20.
8Changing the gas to a liquid causes its volume to reduce 600 times. This makes long-distance
transportation by ship more efficient.
A further point to consider when discussing imports of gas by LNG is that, in 2019, a UK
Government report from Department of Business, Energy and Industrial Strategy (BEIS)
estimated greenhouse gas emissions from LNG are approximately double those of domestic
supplies of gas 21.
How have imports changed over time?
During 2018, LNG supply and demand changed a great deal for UK and globally 22. During the first
three months of 2018 the UK received 8 shipments of LNG to the UK. The first three months of 2019
saw landing of 41 shipments.
Prior to 2018, imports to the 3 UK LNG terminals in southern England and Welsh coast, came almost
exclusively from Qatar. However, during 2018 and up to time of writing, UK received a large proportion
of liquid natural gas from USA, Russia, Egypt, Angola, Cameroon and from beneath the rain forest of
Peru.
Prior to 2018, UK received no LNG from Russia. In 2018, 17% of UK LNG was supplied by Russia. This
is happening because new supplies are becoming available as regions with higher levels of natural gas
supply than demand are building plants in order to become gas exporters. Australia and Qatar are
other examples.
This increase in diversity of supply is causing the price of gas to drop around the world. International
Energy Agency report estimates Europe paid $8 billion less in 2018 due to new global LNG supplies
competing with Russian supplies by pipeline 23.
However, this shift has the potential to increase volatility. As LNG prices drop, new import plants are
being built in China, Germany, Poland, for example. In China, the government has embarked on a
programme to convert millions of households per year from coal to natural gas for heating 24 and
growth in demand from China is anticipated to put pressure on price and availability.
Norway, which has supplied UK by pipeline since the country became dependent upon imported gas,
opened an LNG supply terminal in 2007 25.
9WHAT DOES USE OF GAS MEAN FOR THE PUBLIC AND FOR THE CLIMATE?
What are the implications for households?
Within the UK there are approximately 24 million gas meters in the homes of England, Scotland and
Wales combined. Just over 2 million homes in Scotland out of approximately 2.5 million homes 26 have
a gas meter.
Some areas of the UK have a relatively high proportions of homes without a mains gas supply. These
areas tend to be the more remote part of the British Isles, typically with relatively sparse and scattered
populations. This means that Scotland and Wales have a relatively high proportion of homes without
access to a mains gas supply. In Scotland one in five homes have no mains gas supply, which is almost
double the figure for England.
The map below shows regions of the UK in the context of proportion of properties connected to the
grid. The darker colours indicate a relatively high proportion of properties without a connection to the
gas mains grid, mainly in remote areas such as Scottish Highlands, Islands and Border Region; Wales,
East Anglia and Cornwall.
Chart 8: Map of UK showing relative proportion of gas grid connections
Source: UK Government Department for Business, Energy and Industrial Strategy
The UK Government
recognises that not having
a mains gas connection is a
contributory factor to fuel
poverty because
alternative fuels are more
expensive than natural
gas. The UK Government
Committee for Fuel
Poverty in November 2018
said “The Gas Distribution
Networks have a target to
deliver 91,000 new gas
connections by 2021. This
provides important
support to connect low
income households to the
mains gas grid, which can
deliver considerable
heating cost reductions
when compared to electric
heating.” 27
A UK Government report stated that, for those households experiencing fuel poverty, the level of fuel
poverty is double the average when comparing those without access to mains gas to those with mains
access 28. A report from European Commission body, Eurostat, tasked with providing statistical information to
EU states shows that, for equivalent energy, cost by electricity is 3 to 4 times that of from natural gas 29
In addition to the implications of alternative fuels such as coal and heating oil for fuel poverty, they also
cause more pollution including greenhouse gas emissions.
10What role can natural gas play in a net zero carbon economy?
Natural Gas, for an equivalent level of energy produced, generates about half of the greenhouse gas
emissions of coal 30 though, clearly, greenhouse gas emissions, in the form of Carbon Dioxide, are
higher than from renewables and from nuclear power.
Chart 9: UK Carbon Dioxide emissions 1960 to 2017
Source: World Bank
UK Carbon Dioxide emissions
have fallen over the previous
decades for a number of reasons
including the switch to natural
gas but also as a result of shifts
in manufacturing, increased
levels of renewables and
increased energy efficiency 31.
The effect of the shift away from
energy-intensive manufacturing
is apparent in the increased rate
of decline since global financial
crisis of 2008.
Chart 10: Global Carbon Dioxide Emissions 1960 to 2017
Source: World Bank
Global Carbon Dioxide emissions
have risen sharply over the same
period, largely reflecting growth
in demand for coal in developing
nations, particularly China but
also India and others 32
The UK Government’s Independent-appointed Committee on Climate Change recently published a
report proposing UK aims to reach net-zero for greenhouse gas emissions by 2050. This report 33
acknowledged both that natural gas dominates the UK energy mix and that, for heating particularly,
this would be a hard problem to solve. The Committee proposed that a significant part of heating
would come from using hydrogen which does not generate greenhouse gas emissions. Further, the
Committee proposed that hydrogen would be generated from natural gas with associated Carbon
Dioxide captured and stored centrally rather than being generated in tens of millions of dispersed gas
boilers and ovens.
The Committee for Climate Change concludes that, while the total volume of natural gas demand in
the UK is expected to drop from 875 Terra Watt Hours to 600 Terra Watt Hours, continuing decline in
11offshore domestic production of natural gas means that imports of natural gas will rise from 400 Terra
Watt Hours to almost 500 Terra Watt Hours (25% increase).
The Committee on Climate Change had a great deal of other proposals which will be required to meet
a net-zero target by 2050 outside the remit of a paper on natural gas and its role in providing energy
to the UK.
12REFERENCES
1
GMB Publication on natural gas in UK and Scotland Energy Policy
https://www.gmbscotland.org.uk/features/2017/04/25/natural-gas-in-the-energy-policy-of-the-uk-
and-scotland/
2
UK Government Department for Business, Energy and Industrial Strategy annual Digest of UK
Energy Statistics (DUKES) for calendar year 2018 Chapter 4
https://assets.publishing.service.gov.uk/government/uploads/system/uploads/attachment_data/file
/729395/Ch4.pdf
3
Detailed analysis of UK energy mix breakdown from UK University of Birmingham Energy Institute
https://www.researchgate.net/project/multi-vector-energy-analytics
4
UK Government Department for Business, Energy and Industrial Strategy annual Digest of UK
Energy Statistics (DUKES) appendix covers UK energy mix breakdown 1970 to 2018
https://www.gov.uk/government/statistics/energy-chapter-1-digest-of-united-kingdom-energy-
statistics-dukes
5
International Energy Agency Report: Gas 2017
https://www.iea.org/newsroom/news/2017/july/iea-sees-global-gas-demand-rising-to-2022-as-us-
drives-market-transformation.html
6
German natural gas consumption
https://www.statista.com/statistics/703657/natural-gas-consumption-germany/
7
US Energy Information Administration presents US gas consumption
https://www.eia.gov/tools/faqs/faq.php?id=50&t=8
8
Global Association World Coal report 2018
http://peakoilbarrel.com/world-coal-2018-2050-world-energy-annual-report-part-4/
9
An Oxford Energy Institute for energy study from 2018 assesses role natural gas may play in
improving China air quality
https://www.oxfordenergy.org/wpcms/wp-content/uploads/2018/12/The-Outlook-for-Natural-Gas-
and-LNG-in-China-in-the-War-against-Air-Pollution-NG139.pdf
10
WIKIPEDIA coverage for first UK North Sea Gas Field Hewett
http://abarrelfull.wikidot.com/hewett-gas-field
11
UK Oil and Gas Authority database of UK oil and gas production through the years
https://data-ogauthority.opendata.arcgis.com/pages/production
12
HM Revenue and Customs data on national income and outgoings
"[ARCHIVED CONTENT] Statistics at HMRC - HM Revenue & Customs - GOV.UK"
13
Oil and Gas UK (offshore trade association) report into UK oil and gas employment
https://oilandgasuk.co.uk/wp-content/uploads/2019/03/OGUK-Workforce-Report-2018.pdf
1314
UK Government Department for Business, Energy and Industrial Strategy annual Digest of UK
Energy Statistics (DUKES) for calendar year 2018
https://assets.publishing.service.gov.uk/government/uploads/system/uploads/attachment_data/file
/729395/Ch4.pdf
15
UK Government Digest of UK Energy Statistics (DUKES) shows natural gas consumption for UK up
to 2016
https://assets.publishing.service.gov.uk/government/uploads/system/uploads/attachment_data/file
/622761/Enhancements_to_Energy_Trends_gas_tables.pdf
16
UK Government Committee on Climate Change proposal for net-zero greenhouse gas emissions by
2050 published in April 2019
https://www.theccc.org.uk/wp-content/uploads/2019/05/Net-Zero-The-UKs-contribution-to-
stopping-global-warming.pdf
17
UK Government Digest of UK Energy Statistics 2019 report provides cost of importing oil and gas
https://www.gov.uk/government/statistics/dukes-foreign-trade-statistics
18
UK Government Digest of UK Energy Trends March 2019 update
https://assets.publishing.service.gov.uk/government/uploads/system/uploads/attachment_data/file
/791293/Energy_Trends_March_2019.pdf
19
Norwegian Government publication of 2017 exports of oil and gas
https://www.norskpetroleum.no/en/production-and-exports/exports-of-oil-and-gas/
20
US Energy Information Administration article in 2019
https://www.eia.gov/energyexplained/index.php?page=natural_gas_lng
21
A literature review from UK Government Department for Business, Energy and Industrial Strategy
covering potential emissions from hydrogen use in energy
https://assets.publishing.service.gov.uk/government/uploads/system/uploads/attachment_data/file
/798243/H2_Emission_Potential_Report_BEIS_E4tech.pdf
22
Cornwall Insight Group (Energy Consultancy) article showing trend of greater imported Liquid
Natural Gas to UK gas supply
https://www.cornwall-insight.ie/2019/04/04/lng-displaces-gas-interconnector-imports/
23
US International Energy Association 2019 report shows trend in global gas prices
https://webstore.iea.org/world-energy-investment-2019
24
Reuters article covers Liquid Natural Gas imports in 2019 based on information from Chinese
Government General Administration of Customs
https://uk.reuters.com/article/china-economy-trade-lng/refile-chinas-january-lng-imports-rise-to-
record-high-idUKL3N20H3BU
25
Norwegian report from 2007 on Norway Liquid Natural Gas plans
https://worldview.stratfor.com/article/norway-statoils-lng-setbacks
1426
UK Government Department for Business, Energy and Industrial Strategy report on regional
electricity and gas supply and use
https://assets.publishing.service.gov.uk/government/uploads/system/uploads/attachment_data/file
/767027/Sub-national-electricity-and-gas-consumptio-summar-report-2017.pdf
27
UK Government 3rd Committee for Fuel Poverty 3rd Annual Report (2018)
https://assets.publishing.service.gov.uk/government/uploads/system/uploads/attachment_data/file
/754361/Committee_on_Fuel_Poverty_Annual_Report_2018.pdf
28
UK Fuel Poverty Charity briefing in 2017
https://www.nea.org.uk/wp-content/uploads/2017/03/National-Energy-Action-NEA briefing-for-
annual-fuel-poverty-debate.pdf
29
European Commission data gathering and analysis group, Eurostat report 2007-2018
https://ec.europa.eu/eurostat/data/database
30
Union of Concerned Scientists discusses Greenhouse Gas Emissions
https://www.ucsusa.org/clean-energy/coal-and-other-fossil-fuels/environmental-impacts-of-
natural-gas
31
World Bank data on trends for Carbon Dioxide emissions
https://data.worldbank.org/indicator/EN.ATM.CO2E.KT?end=2014&locations=GB&start=1960&view
=chart
32
US International Energy Agency reports on predictions for global coal demand
https://www.iea.org/newsroom/news/2018/december/global-coal-demand-set-to-remain-stable-
through-2023-despite-headwinds.html
33
UK Government Committee on Climate Change proposal for net-zero greenhouse gas emissions by
2050 published in April 2019
https://www.theccc.org.uk/wp-content/uploads/2019/05/Net-Zero-The-UKs-contribution-to-
stopping-global-warming.pdf
15You can also read