RISKY WAGER: THE IEA'S BET ON FOSSIL GAS AND THE NEED FOR WEO REFORM - Oil Change International
←
→
Page content transcription
If your browser does not render page correctly, please read the page content below
RISKY WAGER:
    THE IEA’S BET ON
    FOSSIL GAS AND
    THE NEED FOR
    WEO REFORM
    OCTOBER 2019

SUMMARY
f		 The International Energy Agency (IEA) is the global authority on     stakeholders who rely on the WEO each year. More specifically,
    energy policy. Its hallmark publication, the annual World Energy     the IEA’s use of fossil gas in its model breaks the carbon budget.
    Outlook (WEO) maps out detailed, long-term pathways for              The projections ignore not only the limitations of coal-to-gas
    energy demand and supply. Government officials, businesses,          switching, but also the rise of disruptive renewable energy and
    industry groups and investors rely upon and cite its figures.        grid management technologies, as well as locking the world into
                                                                         future emissions from new gas infrastructure.
f		 The WEO’s climate scenario, the Sustainable Development
    Scenario, is not fully aligned with the Paris Agreement goal of    f		The IEA is capable of reform. In the past it has shown leadership
    limiting warming to 1.5 degrees Celsius. Instead, it exhausts         and created climate scenarios but these have not kept up
    the 1.5°C budget by the early 2030s. The scenario provides a          with the latest science and politics. The agency can remain
    50-50 chance of limiting warming to 1.7 to 1.8°C, with a heavy        relevant by changing how WEO scenarios are produced. More
    dependence on risky negative emissions technologies beyond            specifically, it can
    the time horizon of the model. However, the less ambitious goal         1) Align the Sustainable Development Scenario with the Paris
    and the heavy reliance on these technologies enable the IEA                goal of limiting warming to 1.5°C and adopt a precautionary
    to promote a massive expansion of fossil gas over the next few             approach to the use of negative emissions technologies.
    decades. This risky wager ignores that these technologies are           2) Align IEA communications and policy recommendations on
    unproven and may not effectively capture carbon or reverse                 gas production and consumption with the implications of a
    temperature rise. Even if these technologies did work, they                fully Paris-aligned scenario (with a precautionary approach
    delay taking immediate action to reduce emissions, place an                to negative emissions).
    unfair economic burden on future generations, and would                 3) Focus the WEO on a strengthened version of the
    significantly increase food and water insecurity.                          Sustainable Development Scenario, instead of the business-
                                                                               as-usual path (New Policies Scenario) which ensures climate
f Presenting gas as compatible with a decarbonized future is                   collapse.
  out-of-step with climate science, rapidly changing energy
  markets, and with the expectations of a growing number of
THE ‘GOLD STANDARD’ OF ENERGY ANALYSIS
Figure 1: Global gas demand in the WEO 2018 SDS and the IPCC SR 1.5°C P1 and P2 illustrative pathways for global gas demand.
160
140
120
Primary Energy (EJ)
100
80
60
40
20
0
2010 2015 2020 2025 2030 2035 2040 2045 2050
IPCC P1 Pathway IPCC P2 Pathway WEO 2018 SDS Global Gas Demand (EJ)
Sources: IPCC/IAMC 1.5°C Scenario Explorer and Data hosted by IIASA (Release 1.1); OCI analysis based on data from International Energy Agency’s World Energy Outlook 2018
The International Energy Agency (IEA) According to OCI analysis, fossil fuel the SDS projections end. Meanwhile, the
is the world’s most influential source of demand in the SDS scenario will likely IEA’s long track-record of under-predicting
energy information. It describes its flagship exhaust the 1.5°C budget in the early growth in renewable energy also increases
publication, the World Energy Outlook 2030s.2 One reason why the IEA’s climate the need for the use of NETs.4
(WEO), as the ‘gold standard of energy scenario exhausts the carbon budget so
analysis.’1 The projections for energy quickly is that it models an increase in The SDS trajectory for gas expansion is
demand contained in the WEO are used the demand for fossil gas. In the SDS, gas far out-of-step with the steady decline in
to help guide policy, infrastructure, and would be the single largest source of global demand for gas in the Intergovernmental
investment decisions by governments, emissions by 2040, just ahead of oil. Put Panel on Climate Change’s (IPCC)
investors, and energy companies globally. another way, SDS projects that relative to illustrative pathways to 1.5°C that assume
2017 levels, CO2 emissions from coal fall more precautionary levels of NETs (Figure
The WEO’s climate scenario, the by 73 percent, and oil by 39 percent in 1). The IEA is making an implicit trade
Sustainable Development Scenario (SDS), 2040, whereas CO2 emissions from gas off: gas expansion over the next several
calculates for a 50 percent chance of increase by 2 percent in 2040.3 The IEA decades requires future generations
limiting warming to 1.7 to 1.8°C by 2100. does not reconcile how this boom in gas is to pay for the carbon clean-up, or risks
The SDS is not aligned with the goals of compatible with a transition away from all climate breakdown if carbon-removing
the Paris Agreement, which strive to limit fossil fuels. To account for this, OCI analysis technologies cannot be deployed or fail to
warming to 1.5°C. The SDS has the same reveals that the only way that the SDS work at scale.
emissions profile as the IEA’s 450 Scenario hits its warming targets is through large-
from 2009, which gave a 50 percent scale deployment of negative emissions Many climate scenarios rely on deploying
chance of limiting warming to 2°C. technologies (NETs) after 2040, when massive levels of bioenergy with carbon
1 “World Energy Outlook: The gold standard of energy analysis,” International Energy Agency, accessed 30 August 2019, https://www.iea.org/weo/.
2 The 2018 IPCC 1.5°C Special Report estimates the remaining carbon budget for a 50% chance of limiting warming to 1.5°C as 580 Gt (as of 1 Jan. 2018). That is for all emissions,
including land-use and cement, whereas the IEA considers only fossil fuel emissions. If we subtract 2018 emissions (41.5 Gt CO2) and an optimistic estimate of cumulative cement
process emissions to 2100 (120 Gt CO2, assuming annual emissions remain flat at around 1.5 Gt CO2/y), while assuming zero net land-use emissions, that leaves 419 Gt CO2 remaining
for fossil fuels over the rest of this century. Applying a flat-line decline between available SDS data points, we find that SDS fossil fuel emissions would exceed that level by 2033. See:
IPCC SR15, Chapter 2, Table 2.2 (carbon budgets); IEA, World Energy Outlook 2018, https://doi.org/10.1787/weo-2018-en, Annex A, World CO2 emissions indicators (SDS CO2 by fuel
source); Corinne Le Quere et al., “Global Carbon Budget 2018,” Earth System Science Data, 10, 2141-2194, 2018, https://doi.org/10.5194/essd-10-2141-2018 (2018 CO2 emissions and
annual CO2 from cement).
3 In 2030, coal CO2 emissions fall by 42% and oil by 16% while gas increases by 13%, all relative to 2017. See: WEO 2018, Annex A, p. 528-29.
4 Sandra Enkhardt and Becky Beetz, IEA versus the reality of solar PV, pv Magazine, 20 November 2018, https://www.pv-magazine.com/2018/11/20/iea-versus-solar-pv-reality/
2Figure 2: CO2 emissions from energy and industrial processes in the SDS and IPCC 1.5°C illustrative pathways.
50
P1 P2 P3 P4 SDS
40
30
20
Large-scale
Gt CO2
negative
10
emissions
0
2010 2020 2030 2040 2050 2060 2070 2080 2090 2100
-10
-20
-30
Sources: IPCC/IAMC 1.5°C Scenario Explorer and Data hosted by IIASA (Release 1.1); OCI analysis based on data from International Energy Agency’s World Energy Outlook 2018
capture and storage (BECCS), among on a level of BECCS that would consume The IEA’s climate scenario, with its implied
other negative emissions technologies a land area equivalent to 25-46 percent bet on NETs, carries with it a considerable
in order to still permit fossil fuel use of all the world’s arable and permanent risk that these technologies may simply
and balance the carbon budget. Some crop land.8 The P4 pathway would use not materialize, effectively sequester
scenarios rely on NETs at levels beyond 47-86 percent of the world’s arable and carbon, reverse temperature rise, or come
what the IPCC indicates is reasonable permanent crop land for BECCS.9 This at a reasonable cost. In doing so, the IEA
given the significant social and ecological is in contrast to the P1 and P2 pathways, invites the catastrophic consequences
risks, and the governance challenges which include NETs, but at much smaller of unmitigated climate change. Even
associated with their large-scale use.5,6 The levels.10 Overlaying the SDS projection on if no ecological tipping points were
IPCC Special Report on Global Warming of these four illustrative pathways makes it crossed, food and water security may be
1.5°C (SR15) warns that heavy reliance on apparent that the IEA’s climate scenario jeopardized. Moreover, NETs promote a
carbon dioxide removal is “a major risk in falls between the P3 and P4 pathways in a delay in taking immediate action to reduce
the ability to limit warming to 1.5°C,” and 2040 timescale (Figure 2). In other words, emissions, and in doing so, place an unfair
that these technologies are “unproven” at the SDS has similar emissions levels to burden on our children by having them pay
scale.7 The report contains four illustrative scenarios that use 25-86 percent of the to remove our greenhouse gas emissions.
pathways that chart different ways of world’s arable and permanent cropland
limiting warming to 1.5°C, with varying for BECCS.
levels of NETs use. The P3 pathway relies
5 This high dependence on BECCS would create acute food security trade-offs, as bioenergy crops compete with food for land and freshwater. It would also create significant
governance challenges, as a global BECCS management system would have to built, implemented, and enforced. IPCC, 2018: Summary for Policymakers. In: Global Warming of 1.5°C.
An IPCC Special Report, on the impacts of global warming of 1.5°C above pre-industrial levels and related global greenhouse gas emission pathways, in the context of strengthening
the global response to the threat of climate change, sustainable development, and efforts to eradicate poverty, Section C.3.4, p. 17.
6 The SR15 database includes more than 200 scenarios that would lead to temperature rise in 2100 below-2°C (with 66% or higher probability) or 1.5°C (with low or no overshoot).
However, only a small set of those scenarios aligns with IPCC estimates of the realistic potential of various negative emissions technologies in the year 2050. For example, the IPCC
indicates that, in 2050, the feasible range for BECCS sequestration is between 0.5 to 5 Gt CO2 (the midpoint being 2.75 Gt). Only 30 scenarios assume levels of BECCS sequestration
in 2050 at or below that midpoint. See Greg Muttitt, The International Energy Agency and the Paris Goals: Q&A for Investors, Oil Change International and Greenpeace UK, January
2019, http://priceofoil.org/2019/02/07/the-international-energy-agency-and-the-paris-goals-qa-for-investors/, p. 6.
7 Joeri Rogelj et al., “Chapter 2: Mitigation Pathways Compatible with 1.5°C in the Context of Sustainable Development,” in: IPCC, 2018, in: Global Warming of 1.5°C. An IPCC Special
Report, p. 96.
8 Pete Smith et al, “Biophysical and economic limits to negative CO2 emissions,” Nature Climate Change, 7 December, 2015, DOI: 10.1038/ NCLIMATE2870, p.5.
9 IPCC 2018, Summary for Policymakers, p.14
10 The cumulative CO2 sequestered by BECCS by 2100 for the P1 pathway is zero GtCO2, for the P2 pathway is 348 GtCO2, for the P3 pathway is 687 GtCO2 and for the P4 pathway is
1,218.GtCO2. IPCC 2018, Summary for Policymakers, p.14.
3WHY IS GAS A PROBLEM?
The IEA produced a special report ahead and uses credible levels of NETs requires GAS BREAKS THE CARBON
of the release of the 2019 WEO entitled The less gas, not more. The IEA attempts to BUDGET
Role of Gas in Today’s Energy Transitions.11 make the case that growing gas production Figure 3 shows how the economically
The report is inconsistent in the way it and consumption can play a role in such recoverable oil, gas, and coal in the
addresses gas’ place in the climate crisis; an energy transition. But that case does world’s currently producing and under-
at first The Role of Gas exhibits caution not stand up to scrutiny. The following construction extraction projects will warm
about the long-term future of gas and its five points make clear that increasing the the world far beyond a safe global average
impotence as a climate solution. But the supply of and demand for gas plays no role temperature. Further development of
report proceeds to make a concerted pitch in staying within a 1.5°C warming limit. untapped gas reserves, including new
for increased gas consumption by insisting shale wells, warms the atmosphere even
that it can reduce emissions. The analysis 1) Gas breaks the carbon budget; further past the 1.5-degree goal of the Paris
and policy recommendations in the report 2) Coal-to-gas switching does not Agreement. Even if global coal use were
provide continued support for increasing effectively cut emissions; phased out overnight, already-developed
gas production and consumption despite 3) Low-cost renewables can displace coal reserves of oil and gas would push the
the clear risks as they relate to climate and gas; world above 1.5°C of warming.13 There is
change. 4) Gas is not essential for grid reliability, simply no room for more gas in the carbon
and; budget. The considerable pre-combustion
Figure 1 above shows that an energy 5) New gas infrastructure locks in emissions of supplying gas, primarily due
transition which aligns with credible emissions. to methane leakage, reinforce this case.
pathways to limit global heating to 1.5°C
Figure 3: CO2 from developed fossil fuel reserves, compared to carbon budgets within range of Paris Agreement goals.
1200
2°C
PARIS GOALS
1000
Coal
800
DEVELOPED
Gt CO2
600 RESERVES Gas
CARBON BUDGET
1.5°C
400
Oil
CARBON BUDGET
200
Land use
change Cement
0
Emissions 1.5°C (50% chance) 2°C (66% chance)
Source: OCI analysis based on figures from Rystad Energy, IEA, World Energy Council, IPCC
Box 1: The IEA Underestimates the Climate Impacts of Fossil Gas
Beyond these five points, the leakage of methane—the main the global warming potential of methane and relying on flawed
component of fossil gas—is another crucial issue. The IEA’s U.S. government data.12 Even if methane leakage was kept to a
special report underestimates the leakage rate of methane and minimum, the following points make clear that gas is not clean,
the impact that methane has on climate change, by lowballing cheap, or necessary.
11 IEA, The Role of Gas in Today’s Energy Transitions, International Energy Agency, July 2019, https://www.iea.org/publications/roleofgas/.
12 Lorne Stockman, The IEA’s Misplaced Techno-optimism, Oil Change International, 12 August, 2019, http://priceofoil.org/2019/08/12/the-ieas-misplaced-techno-optimism/.
13 Note: This is accounting for hard-to-avoid land use and cement emissions.
4Figure 4: Global power sector emissions in BNEF scenarios.
16
NEO 2019 Coal Phase-Out 1.5°C
14
12
Million Metric Tons CO2
NEO 2019
10
8
Coal Phase-Out
6
4
1.5°C
2
0
2015 2020 2025 2030 2035 2040 2045 2050
Source: Oil Change International analysis based on Bloomberg New Energy Finance, New Energy Outlook 2019
COAL-TO-GAS SWITCHING above the 1.5°C target (Figure 4).15 The Nonetheless, the IEA report advocates for
DOES NOT EFFECTIVELY analysis accounts for emissions from policies to support coal-to-gas switching in
CUT EMISSIONS the power plant chimney stack only, the power sector. In particular, it suggests
Climate goals require the energy sector to excluding methane leakage and other that carbon pricing could help increase
be largely decarbonized by mid-century. process emissions. Therefore, full lifecycle the utilization of existing gas power
The IPCC’s report on pathways to 1.5°C emissions are higher than those accounted plants, increasing gas consumption in the
states that, “[s]ince the electricity sector is for. NEO 2019 is BNEF’s reference case short- to medium-term. This plan entails
completely decarbonized by mid-century or business-as-usual scenario a 12 percent increase in gas production,18
in 1.5°C pathways, electrification is the which would require locking in billions of
primary means to decarbonize energy The IEA’s special report on gas appears dollars of investment in gas extraction,
end-use sectors.”14 This illustrates the to agree that coal-to-gas switching is far pipelines, and LNG terminals.19 This would
importance of completely decarbonizing from a silver bullet. The report states that further entrench gas supply, making it
the power sector as quickly as possible. “beating the most carbon-intensive fuel more difficult to close the gap in necessary
is not in itself a persuasive case for gas if power sector emissions reductions.
Replacing coal plants with new gas plants there are lower emissions and lower-cost
will not cut emissions by nearly enough, alternatives to both fuels.”16 The report
even if methane leakage is kept to a goes on to warn that “the increased
minimum. Analysis from Bloomberg New combustion of natural gas does not
Energy Finance (BNEF) found that in a provide a long-term pathway to global
scenario where coal is phased out and climate objectives, so policy makers need
replaced with a combination of 70 percent to be wary about locking in gas-related
new gas and 30 percent new renewables emissions even as they reduce emissions
by 2035, power sector emissions would from coal.”17
raise the global temperature to well
14 Joeri Rogelj et al., “Mitigation Pathways Compatible with 1.5°C in the Context of Sustainable Development,” in IPCC, 2018.
15 Bloomberg New Energy Finance, New Energy Outlook 2019.
16 IEA The Role of Gas, p. 42.
17 Ibid
18 IEA The Role of Gas, p. 10.
19 Lorne Stockman, The IEA’s Plan to Increase Gas Consumption Locks In Climate Chaos,’ Oil Change International, 2 August, 2019, http://priceofoil.org/2019/08/02/the-ieas-plan-to-
increase-gas-consumption-locks-in-climate-chaos/
5Box 2: The Role of Gas in Reducing Emissions Is Far Smaller Than the
Role of Renewables and Efficiency Improvements
Figure 5: Change in global energy related CO2 emissions and avoided emissions, 2017-2018.
34.0
Increased emissions
Economic growth
Avoided emissions
33.5
Energy Efficiency
Nuclear
Renewables
GtCO2
Coal-to-gas switching
33.0
Other
32.5
32.0
2017 2018
Source: International Energy Agency, Global Energy and CO2 Status Report 2018
The IEA special report on gas provides world economy, in part due to greater coal-to-gas switching in preventing even
a useful insight into the role of different efficiency, as well as reductions in the larger emissions increases. According to
energy sources and other factors in carbon intensity of the energy sector the IEA’s Global Energy and CO2 Status
reducing CO2 emissions. The report related to the rise of renewables and Report 2018, energy efficiency played the
contains an analysis of emissions switching to less carbon-intensive fuels.”20 largest role in cutting emissions despite
reductions compared to a baseline The stated emissions reductions from coal- a slowdown in energy efficiency policy
projection in 2010. to-gas switching between 2010 and 2018 implementation. Renewable energy was
was only 500 million tons of the total 7 Gt,21 listed as cutting 215 million tons compared
The analysis finds that emissions could or about 7 percent of total reductions. to 95 million tons from coal-to-gas
have been 7 gigatons (Gt or billion metric switching.22 This is illustrated in the figure
tons) higher in 2018 if it were not for While global CO2 emissions grew 1.7 above, which is copied from the IEA report.
“changes in the global economic and percent year-on-year in 2018, the IEA itself
energy system since 2010: these include has calculated that both renewables and
reductions in the energy intensity of the energy efficiency play a far larger role than
20 IEA, The Role of Gas, p. 8.
21 Ibid.
22 IEA, Global Energy and CO2 Status Report 2018, International Energy Agency, March 2019, https://www.iea.org/geco/, pp. 8-9.
6Figure 6: Wind and solar are cheaper than coal and gas: mean global levelized cost of energy for select technologies.
$400
Wind (-69%) Solar PV (-88%) Combined cycle gas turbine(-30%)
359 Coal (-9%) Gas Peaker (-35%)
$350
$300
275 Gas losing to wind & solar
Mean LCOE $/MWh
$250
$200
179
$150
135
111
$100 102
83
58
$50 43
42
$-
2009 2010 2011 2012 2013 2014 2015 2016 2017 2018
Source: Oil Change International analysis using Lazard 2018. 25
LOW-COST RENEWABLES CAN performance of wind and solar power threatened by cleaner and more affordable
DISPLACE BOTH COAL AND GAS is only set to improve.23 This means technologies.24 As cost is clearly not a
The dramatic and ongoing cost declines that renewable energy can and does prohibitive factor to adding renewable
for wind and solar disrupt the market replace coal as bulk generation while generation capacity, whether to replace
justification for gas in the power sector saving consumers’ money, which is now fossil fuel capacity or to meet rising
(Figure 6). Wind and solar capacity is happening in the U.S. and Europe. energy demand, it is unclear why the IEA
already cheaper to build and operate continues to advocate for increasing fossil
than coal and gas in most markets. As The IEA’s special report on gas confirms gas consumption.
these technologies continue to gain this trend and in several places warns
from increasing economies of scale and that the economic case for building
implementation experience, the cost and new gas plants is weak and increasingly
23 Bloomberg New Energy Finance, New Energy Outlook 2019, June 2019, https://about.bnef.com/new-energy-outlook/
24 IEA, The Role of Gas.
25 Lazard, Levelized Cost of Energy 2018, November 2018, https://www.lazard.com/perspective/levelized-cost-of-energy-and-levelized-cost-of-storage-2018/
7Figure 7: Projected LCOE of battery storage and gas peakers - United States.
$180
Utility Scale Battery (4hr) Open Cycle Gas Turbine Gas Reciprocating Engines
$160
$140
$120
$/MWh (Real 2018)
$100
$80
$60
$40
$20
$-
40
28
33
35
25
23
22
20 1
44
32
37
19
27
46
50
20 1
48
49
30
20 1
20
20 3
45
34
42
36
29
38
39
24
26
47
4
3
2
4
20
20
20
20
20
20
20
20
20
20
20
20
20
20
20
20
20
20
20
20
20
20
20
20
20
20
20
20
Source: Bloomberg New Energy Finance, 1H-2019 LCOE Update.
GAS IS NOT ESSENTIAL seasonal or longer duration periods of low medium-term, which would risk locking
FOR GRID RELIABILITY renewable energy availability may be the in emissions for the long-term even as
Wind and solar require balancing, but final piece in the clean energy puzzle. Even the economic case for gas increasingly
gas is not the best resource available for if gas may be needed as an occasional erodes.
doing so. Battery storage is fast becoming backup power source, such limited demand
economically competitive with gas plants provides no justification for increasing gas Multibillion-dollar gas infrastructure built
designed for this purpose, known as production. today is designed to operate for decades
peakers (Figure 7). Wind and solar plants to come. Gas infrastructure is capital
that are coupled with battery storage are NEW GAS INFRASTRUCTURE intensive and requires long periods of
also becoming a competitive dispatchable LOCKS IN EMISSIONS operation to return investment. Once
source of energy, with faster response The IEA is well aware of the dangers of capital has been sunk, operation is meant
times than gas peakers. carbon lock-in. In its 2019 special report to continue as long as revenues exceed
on the role of gas in energy transitions, marginal operating costs. Given the
Managing high levels of wind and solar on it warned policymakers about locking barriers to closing down infrastructure
the grid requires optimizing a wide range in the greenhouse gas emissions made ahead of its expected economic lifespan, it
of technologies and solutions, including inevitable by additional gas infrastructure.27 is critical to stop building new gas projects,
battery storage, demand response, and Despite this, the IEA’s so-called Sustainable whose full lifetime emissions would not fit
transmission.26 There is no reason to favor Development Scenario foresees an within Paris-aligned carbon budgets.
gas as the primary solution. Addressing expansion of fossil gas in the short-to
26 European Climate Foundation, Towards Fossil-Free Energy in 2050, Cambridge Econometrics and Element Energy, March 2019, https://europeanclimate.org/wp-content/
uploads/2019/03/Towards-Fossil-Free-Energy-in-2050.pdf
27 IEA, The Role of Gas, p. 42.
8WEO MUST BE REFORMED
The IEA is currently the most influential The IEA has demonstrated its capacity for These enhancements to the WEO would
authority on energy in the world; however, reform in the past. It has the opportunity to generate many benefits. It would map
that reputation and relevance is in danger. rise to the challenge of guiding the world out for a world with less transition risk,
Through its promotion of fossil gas, it to a more secure and sustainable energy and fewer physical, social, and economic
guides energy decision-makers towards future. It can remain relevant by changing risks from climate change by avoiding
an increasingly risky investment. Moreover, how WEO scenarios are produced. More dangerous overshoot, reducing the
for those who continue to rely on the WEO, specifically, it can demand for all fossil fuels, and encouraging
the IEA risks derailing climate progress by a rapid deployment of renewables and
steering countries and investors towards 1) Align the Sustainable Development energy efficiency. These reforms reflect the
a hothouse world with growing gas Scenario with the Paris goal of expectations of a growing number of IEA
demand and diminishing profitability. In the limiting warming to 1.5°C and adopt a member countries, investors, and energy
meantime, future generations are unjustly precautionary approach to the use of experts. Following these recommendations
left with the costs of cleaning up this negative emissions technologies. would also help ensure that the IEA
additional pollution from fossil gas. 2) Align IEA communications and policy remains relevant as the world moves to
recommendations on gas production rapidly transition away from fossil fuel
The WEO’s fixation on gas prevents users and consumption with the implications dependence.
from realizing the limitations of coal-to-gas of a fully Paris-aligned scenario (with
switching and the dangers of carbon lock- a precautionary approach to negative
in. In its promotion of gas, the IEA does not emissions).
consider the highly disruptive technological 3) Focus the WEO on a strengthened
change underway with renewables and version of the Sustainable Development
grid management, and the unacceptable Scenario, instead of the business-as-
risks of relying on unproven technologies usual New Policies Scenario.
to remove emissions well beyond the time
horizon of WEO scenarios.
Oil Change International is a research, communications, and For more information, please contact Nathan Lemphers at:
advocacy organization focused on exposing the true costs of fossil nathan@priceofoil.org
fuels and facilitating the coming transition towards clean energy.
To learn more about the gas ‘bridge fuel’ myth, download the
This briefing is endorsed by 350.org, Center for Biological full report at: priceofoil.org/gas
Diversity, Earthworks, Friends of the Earth Europe,
Global Witness, Greenpeace USA, Rainforest Action Network, To learn more about the need for IEA scenario reform, download
Sierra Club, and urgewald. our Off Track report at: priceofoil.org/2018/04/04/off-track-the-
iea-and-climate-change
This briefing was written by Nathan Lemphers and Lorne
Stockman, with contributions from Kelly Trout. The authors October 2019
are grateful for feedback from the following OCI staff: Kaela
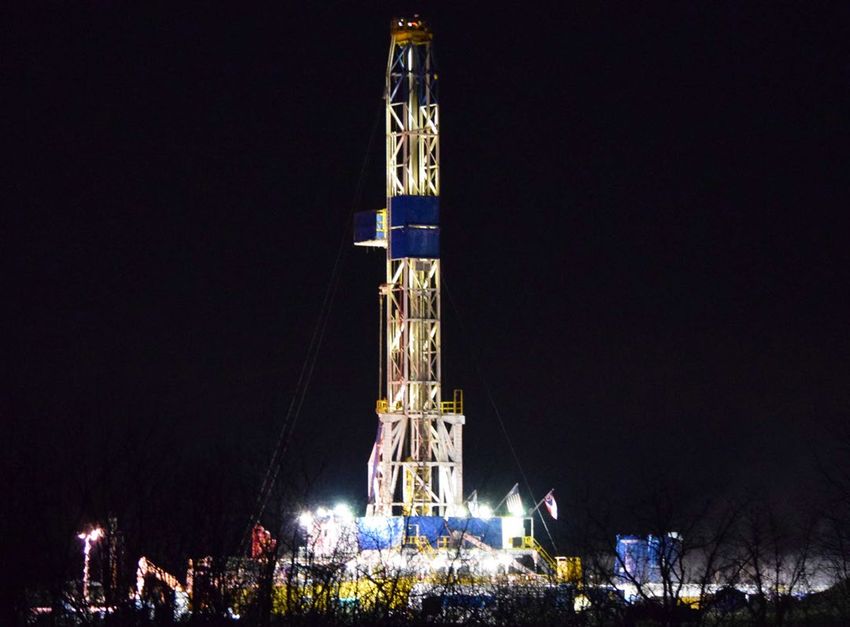
Bamberger, Matt Maiorana, Greg Muttitt, and David Turnbull. Cover photo by Ted Auch, FracTracker Alliance.
The authors would also like to thank the following external
reviewers: Bruce Baizel, Cara Bottorff, Tim Donaghy, John C.
Fleming, Jason Opeña Disterhoft, Alan Septoff, Kassie Siegel,
Shaye Wolf, Murray Worthy. Any errors remain the responsibility
of the authors.
9You can also read