Natural gas demand in Europe: The impacts of COVID-19 and other influences in 2020 - Oxford Institute for Energy ...
←
→
Page content transcription
If your browser does not render page correctly, please read the page content below
JUNE 2020

                        Natural gas demand
                                  in Europe:
                                 The impacts of COVID-19
                               and other influences in 2020

OXFORD ENERGY COMMENT                          Anouk Honoré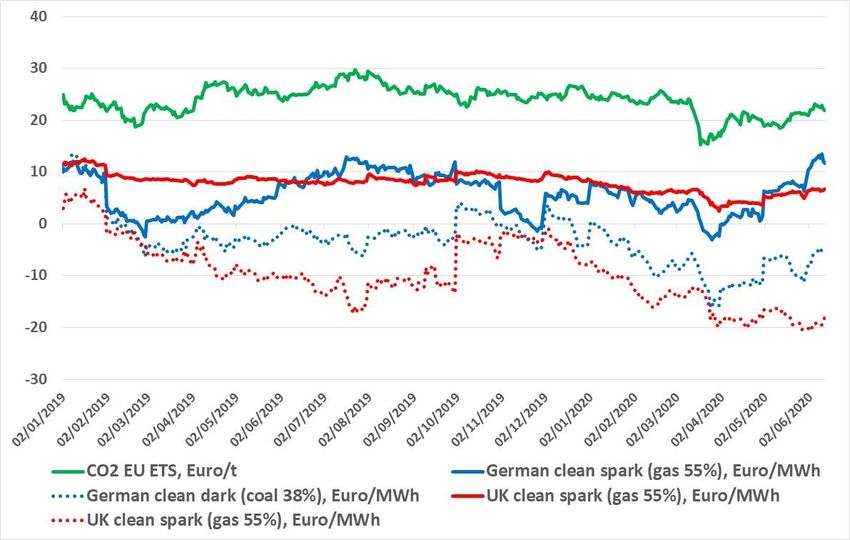
In 2019, Europe1 helped to balance the LNG market when it absorbed about a quarter of global imports.
While ample LNG supply remains available, 2020 is bound to be different from a European perspective.
A warm beginning of the year coupled with the impacts of the COVID-19 pandemic have depressed
gas demand in Europe. With storage facilities filling up fast, the region’s ability to continue to act as the
swing/sink market for LNG cargoes is being put under the spotlight.2 There is no doubt that measures
taken to fight COVID-19 will have an enormous impact on European economies and uncertainties
remain as to their ability to bounce back in the coming months. The following paragraphs, finalised at
the beginning of June, offer an initial assessment3 on expectations for natural gas demand in Europe
in 2020.

January-May 2020: gas demand down by 8 per cent

In the first five months of 2020, natural gas demand in Europe is likely to have declined by about 8 per
cent or 19 billion cubic metres (bcm)4 year on year (Figure 1) due to the successive impacts of mild
temperatures, high renewables in power generation and the consequences of COVID-19. Despite this
sharp fall, it was still above the levels seen in 2014 (+12 per cent) and even in 2015 (+2 per cent) when
gas demand was at its lowest in over two decades due to limited gas use in heating and power
generation.5
Gas demand in Europe was already weak even before the COVID-19 pandemic reached its full extent.
Winter 2019-2020 was mild, wet and windy, a combination of factors not favourable to high gas demand
in the region. Warm temperatures seen in January, especially in North West Europe, have limited the
need for gas used for heating in buildings as well as heating-related electricity consumption.6 Strong
winds in February further limited the potential for gas used in power generation. As a result, gas demand
was down by 10 per cent year on year in January and by 3 per cent in February. 7
In March, the number of COVID-19 cases increased rapidly (Figure 2) and the World Health
Organization (WHO) declared Europe to be the epicentre of the new coronavirus epidemic. Italy was
the first in the world to issue a nationwide lockdown on 11 March 2020. Within a week or two, many
other European countries had taken similar decisions. Across the region, countries closed their borders
and introduced increasingly strict restrictions on movement to stop the virus spreading.

1
  In this paper, Europe is defined as EU27 (minus Cyprus and Malta) plus Norway, Serbia, Switzerland and the UK. Because the
role of gas varies from country to country, in addition to the whole region, particular focus is on the eight largest gas markets
which accounted for more than 80 per cent of the European gas demand in 2019 according to IEA data (Germany: 92 bcm, the
UK: 79 bcm, Italy: 74 bcm, the Netherlands: 45 bcm, France: 42 bcm, Spain: 35 bcm, Poland: 21 bcm and Belgium: 18 bcm).
2
   For further discussion, see https://www.oxfordenergy.org/wpcms/wp-content/uploads/2020/05/Quarterly-Gas-Review-Issue-
9.pdf
3
  Final and detailed data on gas demand may not be published for several weeks -or even months in some cases, so the analysis
in this paper has been limited by what was available in the public domain at the time of writing and may be subject to revision
once consolidated statistics are published.
Statistics used in this comment are from the IEA, Eurostat, national TSOs, ENTSOG transparency platform, ENTSOE
transparency platform and from the author’s calculations when data was not available or needed to be adjusted due to national
differences in order to get a European picture and compare data between countries (while daily consumption can often be found
from TSOs websites or the ENTSOG transparency platform, differences in definitions, conversions and level of details make it
difficult, if not impossible, to get a definitive vision at the regional level).
4
  Author’s calculations
5
  See Figure 10 and for more information on gas demand in Europe in the 2010s, see https://www.oxfordenergy.org/wpcms/wp-
content/uploads/2018/04/Natural-gas-demand-in-Europe-in-2017-and-short-term-expectations-Insight-35.pdf;
https://www.oxfordenergy.org/wpcms/wp-content/uploads/2017/05/Natural-gas-demand-in-Europe-in-the-next-5-10-years.pdf
6
  The IEA estimated that in (OECD) Europe -which includes Turkey and Norway-, natural gas demand was down by 2.6 per cent
during Q1 2020 relative to Q1 2019. Consumption by distribution customers dropped by 3 per cent, while gas-fired power
generation declined by over 5 per cent. Source: https://www.iea.org/reports/global-energy-review-2020/natural-gas
7
  Calculated from IEA and Eurostat data

    The contents of this paper are the author’s sole responsibility. They do not necessarily represent the views of the
                                Oxford Institute for Energy Studies or any of its Members.                                     2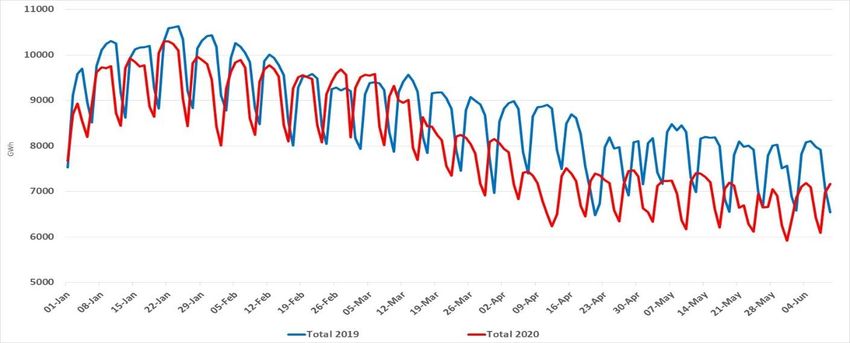
Figure 1: Monthly natural gas demand in Europe in January-May 2019 and 2020 (bcm)

Sources: IEA, Eurostat, Entsog, GRTgaz, Terega, NCG, Gaspool, SNAM, Enagas, NationalGrid and author’s
calculations

Figure 2: Distribution of confirmed cases of COVID-19 in the EU/EEA and the UK, as of 11 June
2020

Source: European Centre for Disease Prevention and Control

  The contents of this paper are the author’s sole responsibility. They do not necessarily represent the views of the
                              Oxford Institute for Energy Studies or any of its Members.                                3
Containment policies were almost exclusively national and not uniform across Europe with various
degrees of restriction, geographical coverage and starting dates. 8 These measures largely halted
economic activity in all the countries with social distancing encouraged, public events banned, schools
closed and most non-essential retail and manufacturing activities shut down or ordered to operate at
minimum levels for several weeks. The most drastic measures were taken in Italy, France and Spain
but despite the differences in response to the virus, the measures have come at huge economic and
social cost to all countries.
The effect of reduced activity or even temporary closure of power-intensive manufacturing and retail
shops, restaurants/cafes and offices on demand for gas started to be seen in the second half of March
in the industrial and power generation sectors in most countries, but at varying degrees, depending on
the severity of early lockdown measures. Total gas demand in March was still above 2019 levels due
to below average temperatures in western countries in the second half of the month. With more people
staying at home, cooler weather is thought to have had a stronger impact on gas use than usual. 9 These
factors are likely to have benefited gas demand in Western countries with high volumes of gas used in
residential heating, such as the UK, Italy, Germany, France and the Netherlands.
In both April and May, total gas demand in Europe was down by 16 per cent year on year despite the
(very) carefully relaxation of restrictions which started in mid-April in various countries as the spread of
new COVID-19 infections started to slow down across Europe.10 A gradual reopening of the economies
started in May but precautionary measures such as social distancing remained (and are likely to
continue for several months). Nonetheless, there were signs of cautious recovery as seen, for instance,
in the industrial sector in Italy (even if gas demand remained considerably lower than in 2019) (Figure
3).
Figure 3: Daily industrial gas demand in Italy, January-May 2019 vs 2020 (mcm/d)

Source: SNAM

8
  For more information, see https://www.bsg.ox.ac.uk/research/research-projects/coronavirus-government-response-tracker
9
  As reported by thermostat maker Tado based on its own consumers’ behaviours. The company’s analysis of more than 100,000
customers in Europe showed an increase of 9 per cent of heating energy demand in Germany in March and more than 40 per
cent in Italy and Spain, where restrictions started on 9 March and 14 March respectively, while outside temperatures differed by
only 1°C on average from the previous year. Source : https://www.current-news.co.uk/news/lockdown-causes-british-
households-heating-use-to-soar
10
   As of 11 June 2020, 1 454 718 cases have been reported in the EU/EEA and the UK and 170 294 deaths. Source:
https://www.ecdc.europa.eu/en/cases-2019-ncov-eueea

    The contents of this paper are the author’s sole responsibility. They do not necessarily represent the views of the
                                Oxford Institute for Energy Studies or any of its Members.                                   4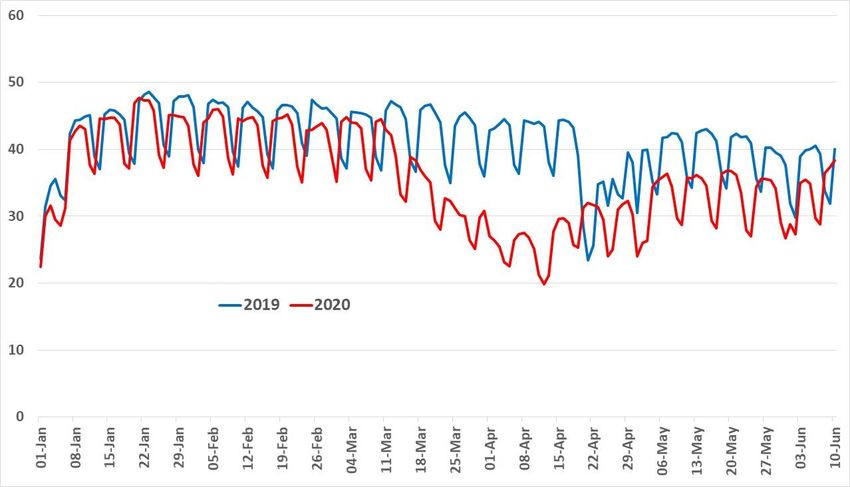
On the other hand, up until 10 June, there was no clear sign that power demand in Europe had started
to recover (Figure 4) according to ENTSO-E data.11 In the first five months of 2020, power generation
was down by 6.6 per cent year on year, while at the same time, the share of renewable generation
increased to 43 per cent (up from 37 per cent over the same period in 2019) with hydro and wind as
the main contributors (18 per cent and 17 per cent respectively). These circumstances have left little
room for other fuels in the mix (Figure 5)12 with nuclear generation down by 11 per cent, gas by 13 per
cent and coal by 28 per cent.
At the national level, the impact on gas-based power generation varied widely. As a result of the high
carbon prices (see Figure 9 later), most of the least efficient coal plants were priced out of the mix and
in countries where some coal to gas switching was still possible, gas-based generation showed good
resilience because of the low gas prices. For instance, it was up by 3 per cent in Germany, 9 per cent
in Poland and potentially by 10 per cent in the Netherlands (although data for this country seems to
need some verification). On the other hand, in countries with limited to no possibility of switching
between the two fuels, gas generation went down. In the UK, it collapsed by 31 per cent, in France, it
was down by 18 per cent, in Italy by 13 per cent and in Belgium by 7 per cent. In Spain, switching
potential was limited from March onward and higher renewables pushed gas-based generation down
by 20 per cent between January and May (year on year).
As a consequence, gas demand for electricity generation was down by about 11 per cent (around 5.8
bcm)13 in the first five months of 2020 compared to the same period a year ago (Figure 6). The largest
decline in volume can be expected in the UK (-3.4 bcm), Italy (-1.3 bcm) and Spain (-0.8 bcm).
As the role of gas in the primary energy supply varies widely across Europe, 14 not all countries have
been affected equally by mild temperatures, lockdown measures 15 or higher shares of renewables in
power generation. Seven of the eight major gas markets saw gas demand decline, with the largest
variations seen in France (-13.2 per cent) and in Italy (-11.5 per cent) while Poland registered a small
increase (+2 per cent) as a result to coal to gas switching in its power sector (Figure 7).

11
   In this paper, the data used is from information reported by the ENTSOE transparency platform for electricity generation (also
called power generation in the text). Data from the IEA (Monthly Electricity Statistics) and Eurostat differs for certain countries,
especially Germany and the Netherlands. Data reported by national grid operators’ transparency platforms or other data reporting
by various institutions may also differ. For instance, generation from gas in Germany in January 2020 was reported as 5696 GWh
by ENTSOE, 8109 GWh by Eurostat (Net electricity generation by type of fuel), 9473 GWh by the IEA (Monthly Electricity
Statistics) and 6720 GWh by Fraunhofer (Net generation of power plants for public power supply).
12
   Higher shares of wind and solar have also shown what future power systems could look like with lots of intermittent renewable
sources in the mix (sometimes well over 50 per cent). While the grids coped relatively well, it also highlighted the lack of flexibility
from market participants (producers unable to reduce their output and consumers unable to increase their demand) which resulted
in record negative power prices.
13
   Author’s calculations from ENTSOE data on electricity generation from gas (national conversion factors applied, based on
previous years). It is important to acknowledge that these calculations may differ from the data on gas for power / electricity (or
even transformation) demand reported by TSOs due to variations in definitions and/or conversion factors. However, in order to
get comparable data from one country to another at the European level in this paper, the author has calculated gas used in power
generation from the actual generation from gas as reported by ENTSOE on its transparency platform.
14
   See https://www.oxfordenergy.org/wpcms/wp-content/uploads/2014/06/NG-87.pdf for more information
15
   The IEA mentions that industrial gas demand in the countries which imposed stricter lockdown measures (Belgium, France,
Italy, Spain and the UK) fell by 15 per cent year on year (above 1 bcm) from March to May. Source: IEA, Gas 2020, p.16,
https://www.iea.org/reports/gas-2020

     The contents of this paper are the author’s sole responsibility. They do not necessarily represent the views of the
                                 Oxford Institute for Energy Studies or any of its Members.                                          5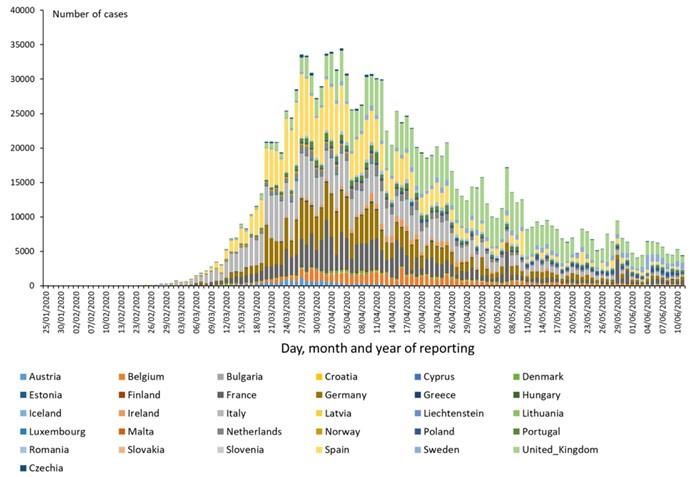
Figure 4: Daily power generation in Europe, 1 January – 10 June 2020 vs 2019 (GWh)

Source: Data from ENTSOE, Author’s calculations

Figure 5: Changes of monthly power generation in Europe by (selected) fuel type, January to
May 2020 vs 2019 (per cent)

Source: Data from ENTSOE, Author’s calculations

  The contents of this paper are the author’s sole responsibility. They do not necessarily represent the views of the
                              Oxford Institute for Energy Studies or any of its Members.                                6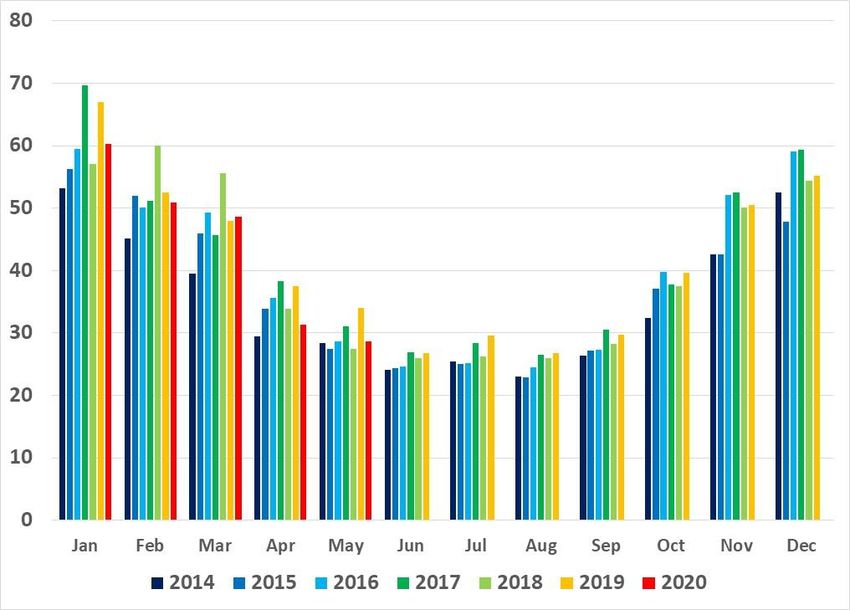
Figure 6: Changes in gas demand for electricity generation in selected countries, January to
May 2020 vs 2019 (mcm)

Source: Author’s calculations from ENTSOE data on electricity generation from natural gas

Figure 7: Monthly natural gas demand in Europe and selected countries, January to May 2019
and 2020 (bcm)

Sources: IEA, Eurostat, Entsog, GRTgaz, Terega, NCG, Gaspool, SNAM, Enagas, NationalGrid and author’s
calculations

  The contents of this paper are the author’s sole responsibility. They do not necessarily represent the views of the
                              Oxford Institute for Energy Studies or any of its Members.                                7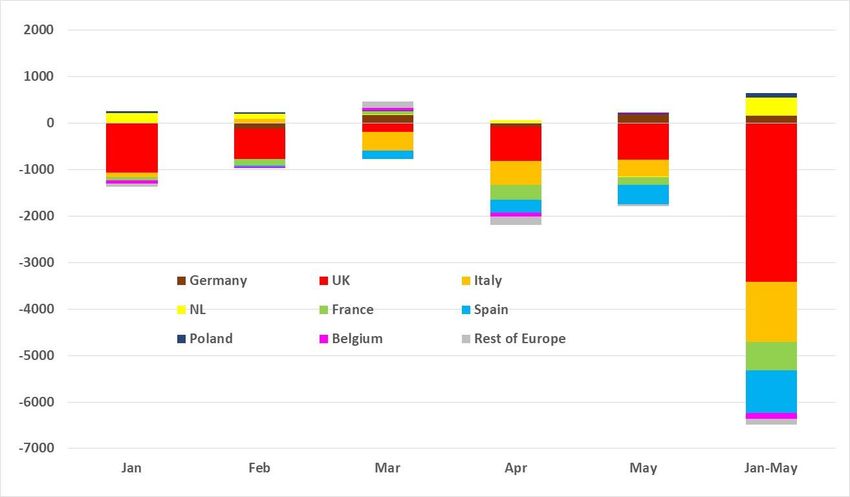
Rest of 2020: main factors and uncertainties

What can be expected for the rest of the year? While policies are likely to take the lead as the main
driver of future gas demand in Europe post 2020, for June to December much will depend on the speed
of economic recovery, the level of power demand -especially over the summer, the available mix /
competition with coal and finally, temperatures over the winter.

No economic recovery before 2021, at (the very) best?
With the dramatic impact that the lockdown has had on many economies, a great economic shock is to
be expected for the rest of 2020, but the extent of the damage is still uncertain, as is the speed and
scale of recovery, as seen in Table 1.
Early April, the International Monetary Fund (IMF) forecast a decline of 7.1 per cent of Gross Domestic
Product (GDP) in 2020 before a rebound in 2021. In May, the European Commission expected an even
worse scenario for 2020 but followed by a stronger recovery in 2021, although the European Union
(EU) economy was not expected to have fully made up for this year's losses by the end of 2021. In its
May bulletin,16 the European Central Bank suggested that the Euro area’s GDP could fall by between
5 per cent and 12 per cent in 2020 depending on the duration of the containment measures and the
success of policies to mitigate the economic consequences for businesses and workers. A rapid
rebound, the so-called ‘V’ shape, seemed unrealistic according to its President, Christine Lagarde, and
the scenario of only a 5 per cent decline was probably already out of the question. 17 Early June, the
Organisation for Economic Co-operation and Development (OECD) projected a decline of 9 per cent of
the Euro area’s GDP in 2020 in its single-hit scenario (if the virus remains contained after the end of
the lockdown in May/June) and a sharper decline of 11.5 per cent if a second pandemic wave takes
place later in 2020 (the double-hit scenario).18
Crucially, not all countries will be affected in the same way. The shock to the EU economy has hit all
Member States, but the steepness of decline in 2020 is very diverse (from -4.3 per cent in Poland to
-9.5 per cent in Italy) and the strength of the rebound in 2021 will also differ vastly. Countries heavily
reliant on tourism like Greece, Italy and Spain are expected to be hit the most in 2020, but they may
also see a proportionately higher bounce back in 2021.
The risks surrounding these forecasts seem very large and concentrated on the downside. The impact
will depend on a combination of a good policy response with strong support for the economy, as seen
in Germany for instance, and a medical response in the form of a vaccine and/or treatment to avoid
new waves of infection and further lockdown measures. The EU and national governments have been
spending more money more quickly than during the financial crisis a decade ago, but more will be
needed, especially in the hardest hit countries. 19
How quickly could energy and gas demand recover to previous levels and/or to anticipated growth rates (and
will they)? The correlation between economic recovery and gas demand is not straightforward (Figure 8).
Countries with a large share of gas demand in their industrial sector (in Central and Eastern Europe for
instance) might expect a more significant decline and rebound in gas demand due to GDP changes
than countries where demand is concentrated in the power or the building sectors as these will show
much less correlation with GDP growth.

16
   https://www.ecb.europa.eu/pub/economic-bulletin/html/eb202003.en.html#toc3
17
   https://www.lefigaro.fr/conjoncture/coronavirus-la-bce-exclut-un-rebond-rapide-de-l-economie-20200522
18
   http://www.oecd.org/economic-outlook
19
   Support for the economy is likely to protect some companies from the immediate effect of the crisis for a few months and
probably even until the end of 2020. However, once this support is gone and loans need to be repaid, many companies may
face shutting down or relocation.

     The contents of this paper are the author’s sole responsibility. They do not necessarily represent the views of the
                                 Oxford Institute for Energy Studies or any of its Members.                                   8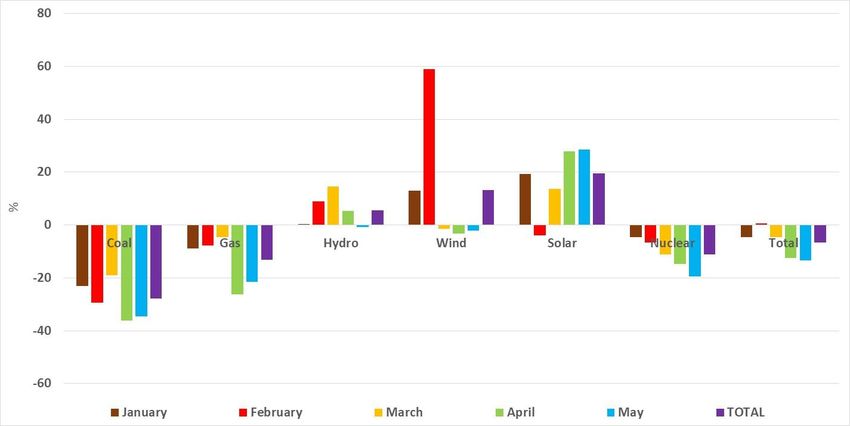
Table 1: Scenarios for economic outlook in Europe in 2020 and 2021 (per cent change of GDP
from previous quarter or year)
                                              IMF World Economic Outlook (14              EU Commission - Spring 2020
                             OECD
                                                          April)                               Forecast (6 May)
                            Q1 2020                2020                  2021                 2020                 2021

 EU27                         -3.3                  -7.1                  4.8                  -7.4                 6.1
 Euro area                    -3.8                  -7.5                  4.7                  -7.7                 6.3

 Germany                      -2.2                  -7.0                  5.2                  -6.5                 5.9

 UK                           -2.0                  -6.5                  4.0                  -8.3                 6.0
 Italy                        -4.8                  -9.1                  4.8                  -9.5                 6.5

 France                       -5.8                  -7.2                  4.5                  -8.2                 7.4
 NL                           -1.7                  -7.5                  3.0                  -6.8                 5.0

 Spain                        -5.2                  -8.0                  4.3                  -9.4                 7.0
 Poland                       -0.5                  -4.6                  4.2                  -4.3                 4.1

 Belgium                      -3.9                  -6.9                  4.6                  -7.2                 6.1
Sources: OECD, IMF and the EU Commission

Figure 8: GDP and gas demand in Europe, 2013-2020 (per cent)

Sources: Eurostat, IEA, GDP in 2020: EU Commission – Spring 2020, Gas demand in 2020: Author’s estimate as
of (early) June 2020

Power demand and generation mix
As countries slowly restart their economies, industrial and commercial power demand is expected to pick
up, and indeed there seem to be small signs of a tentative recovery in May from factories and other large
energy users, albeit nowhere near a return to normal. For the rest of 2020, utilities and industry will be able
to continue to take advantage of record low gas prices when the economy eventually starts to recover.

  The contents of this paper are the author’s sole responsibility. They do not necessarily represent the views of the
                              Oxford Institute for Energy Studies or any of its Members.                                  9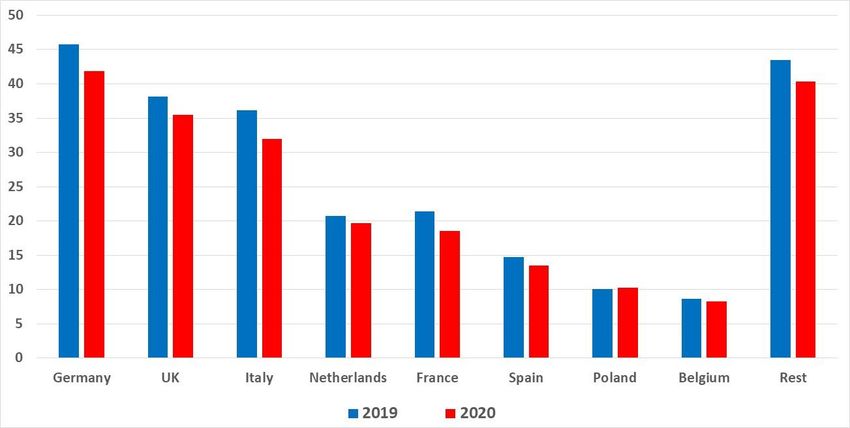
But there are other factors that may also support gas demand for power in the rest of 2020, even if economic
recession sets in:
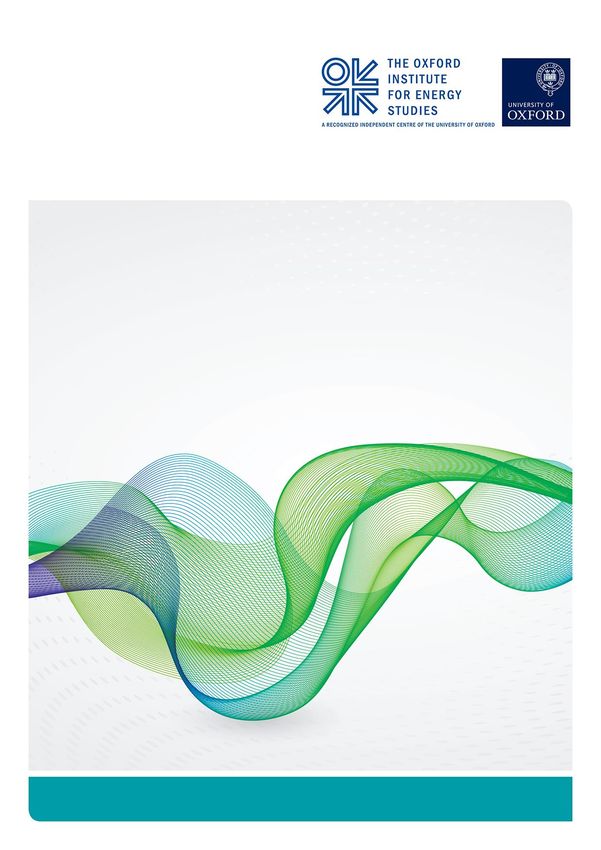
First, while renewables availability remains high, very cheap gas (and high level of carbon prices at
or above 20 euros/tonne) means that gas-fired plants are competitive with coal-fired units, almost
regardless of the efficiency rates. As of early June, clean spark spreads were at least €10/MWh or
more above clean dark spreads in most countries (Argus data for 55 per cent efficiency gas plants
and 38 per cent coal) as seen in Figure 9 with the German and the UK examples. Gas prices are
expected to remain very low for the rest of 2020,20 so to the extent that coal switching can continue,
it will continue (by early June, eleven countries21 already had zero coal in their mix).
Second, in addition to the market conditions, plants that are subject to a Transitional National Plans
(TNPs) under the Industrial Emission Directive will have to meet at least the emission limit values
set out in Annex V22 from 1 July 2020. Units that have not concluded retrofitting works will not be
allowed to continue operating.23 In addition, various countries around Europe have decided on coal-
phase out, and about 20 GW are due to close down by 2023. 24 These restrictions, coupled with bad
economics, could mean an acceleration of coal retirement in Europe in 2020 and 2021.
Exactly how much capacity could close and how much would be replaced by gas is of course
uncertain and hard to evaluate, although some companies have started to announce plans for
specific units. If for instance 20 GW of coal plants were to be retired in 2020 and considering a level
of ‘avoided’ generation similar to patterns observed in January-May 2020, this could potentially
represent about 6 bcm25 of additional gas in June-December if all this avoided generation was to
be replaced by gas. This is an unlikely scenario, but an interesting figure to get a maximum potential
for switching about 20 GW from coal to gas in 2020. As a matter of comparison, last year’s coal
decline was replaced half by gas and half by renewables.
Finally, hot temperatures over the summer could increase demand for air conditioning, especially
in Southern Europe. There are already signs that there is a good probability of a particularly hot
summer as well as potential drought problems.26 If this were to happen, power demand would go up
and availability of hydro power could be limited during the summer months, despite good hydropower
reserves seen in May. There may also be potential problems with nuclear power as seen in previous
summers in France and Germany where high water temperatures and limited flows reduce the ability
to use river water to cool reactors.27 As seen for gas demand in residential heating, a question remains
on the potential impact of a power demand increase which may be different from previous hot summers. If
20
See https://www.oxfordenergy.org/wpcms/wp-content/uploads/2020/06/2-Gas-in-Europe-Part-III-Down-Down-Deeper-and-
Down.pdf and https://www.oxfordenergy.org/wpcms/wp-content/uploads/2020/05/Quarterly-Gas-Review-Issue-9.pdf for more
information
21
Austria, Belgium, France, Latvia, Lithuania, Montenegro, Norway, Portugal, Sweden, Switzerland and the UK according to
ENTSOE data.
22
Under Article 32 of the Industrial Emissions Directive (IED) the TNP allowed certain large combustion plants (LCPs) an
additional four and a half years (until 1 July 2020) in which to make the necessary investments in emissions abatement technology
to achieve compliance with the stringent IED emission limits for three key pollutants (nitrogen oxides, sulphur dioxide, and dust).
Source: https://ec.europa.eu/environment/industry/stationary/ied/faq.htm
23
The total of coal plants in TNPs represented about 55 GW in 2016, at the beginning of the period. Note that in addition, the
‘best available techniques’ (BAT) reference document (BREF) and BAT conclusions for LCPs were published in 2017 and will
need to be implemented by 2021, a fairly short time frame while coal plants economics are not expected to improve anytime
soon. This could contribute to the decision to close down some coal plants capacity in 2020 and 2021.
24
And 30 GW more are due to close by 2025. Source: Author’s research.
25
Author’s calculations
26
https://www.dw.com/en/europes-hot-summer-weather-could-worsen-the-effects-of-covid-19/a-53089956 ;
http://www.journaldelenvironnement.net/article/plus-de-la-moitie-de-l-hexagone-exposee-a-un-risque-de-secheresse-
estivale,106109
27
In addition, mid-April, EDF announced that it would take nuclear plants offline until 2022 as a result of lower electricity demand
from Covid-19. Its nuclear electricity generation will drop to 300 terawatt hours (TWh) in 2020, down from an initial expectation
of 375 to 390 TWh before the outbreak. It forecast a range from 330 TWh to 360 TWh each year in 2021 and 2022. Source:
https://www.carbonbrief.org/analysis-coronavirus-has-cut-co2-from-europes-electricity-system-by-39-per-cent
The contents of this paper are the author’s sole responsibility. They do not necessarily represent the views of the
Oxford Institute for Energy Studies or any of its Members. 10offices, retail shops and restaurants remain partially closed, their demand for air conditioning will be more
limited than usual, and whether this could be replaced by higher residential demand for air conditioning
would depend on whether households have the appliances in place. Despite the uncertainty, it could still
create favourable conditions for additional gas demand in the power sector over the summer months.
Figure 9: EU ETS carbon price, German and UK clean spark and dark spreads, January 2019 to
June 2020
Source: Argus Media
Residential / building demand for heating
Following on from the impact of hot weather on gas demand, cold temperatures could boost gas
demand for heating at the end of the year. A difference between a cold and a warm winter in Europe
can easily increase gas demand by 20-30 bcm. However, if people continue to social distance and work
from home for the rest of the year, even milder temperatures may well rise gas demand above what
could be normally expected or anticipated.
Conclusions: relatively minor effect on gas demand in 2020 (-7 per cent) but
higher uncertainty for the 2020s
There are still important uncertainties for the rest of 2020. However, even if the economic situation does
not recover before 2021/2022, other drivers may influence (sustain) gas demand for the rest of the year.
Figure 10 shows a possible decline of gas demand in Europe of about 7 per cent in 2020 based on
GDP decline of 7.4 percent (EU Commission, Spring 2020), slow recovery in the second half of the year
with softer confinement measures from May/June across all countries, strong financial stimulus, low
coal in the generation mix and continued low gas prices, a hot summer and an average winter at the
end of the year. In this scenario, gas consumption would go down to about 462 bcm28 (35 bcm less
than in 2019), which would still be above the low levels seen in 2014 and 2015 (433 and 450 bcm
respectively29).
28
Author’s estimates
29
IEA and Eurostat data
The contents of this paper are the author’s sole responsibility. They do not necessarily represent the views of the
Oxford Institute for Energy Studies or any of its Members. 11In this scenario, the second quarter would be the most affected with a drop in demand of about 14 per
cent compared to Q2 2019. Demand would continue to decline year on year in third quarter (-8 per
cent) and in the fourth quarter (-5 per cent). The biggest variations would be expected in the countries
that were hardest hit by the COVID-19 pandemic, which were also essentially the largest gas markets
in Western Europe (Figure 11).
Figure 10: Natural gas demand in Europe, 2000-2020 (bcm)
Source: 2000-2019: IEA and Eurostat data, 2020: Author’s estimate as of (early) June 2020
Figure 11: Natural gas changes in 2020 vs 2019 in Europe and selected counties (per cent)
Source: Author’s estimate as of (early) June 2020
All in all, the impact on gas demand in 2020 could be relatively minor while governments focus on
immediate recovery, gas continues to benefit from (very) low gas prices (about $2/MMBtu) and weather
helps sustain gas demand for the rest of the year.
Although comparing 2020 with the financial crisis of 2009 is difficult as both the crisis and the structure
of the gas market were different, a 7 per cent decline would be smaller than the one experienced in
2009 when gas demand in Europe went down by 8.2 per cent (42 bcm). The longer-term aftermath of
the 2009 crisis is worth noticing as gas demand continued to decline up to 2014 (except for a quick
The contents of this paper are the author’s sole responsibility. They do not necessarily represent the views of the
Oxford Institute for Energy Studies or any of its Members. 12rebound in 2010 which was strongly supported by very cold weather). Could we be facing the same
situation in the first half of the 2020s?
As seen in Figure 8, economic bounce-back may not necessarily equate to longer term gas demand
recovery. In the first half of the 2010s, slow economic recovery and (very) high gas prices kept gas
demand low in the European industrial sector although the main factor was a much lower demand in
the power sector where gas could not compete against coal (in a context of low coal and carbon prices)
and the rise of non-market based renewable capacity. This time, low gas prices (and very favourable
coal/gas price spread) will support gas demand in the early 2020s, especially if we witness an
accelerated coal phase-out in the next one or two years, which could come from a combination of
economic reasons and/or governmental decisions.
However, this support would only be for a few years and (fossil) gas demand in Europe should not
expect to recover for much longer. What happens in and post 2020 will only define how quickly the role
of unabated gas will decline (or disappear) from the energy mix. And post COVID-19, the future seems
even more uncertain. Will recovery measures and policies impact (fossil) gas demand earlier than
expected, in the 2020s? Will the EU recovery package presented on 27 May alongside the EU budget
for 2021-2027 and the EU Green Deal initiatives accelerate the decarbonisation of the economy? Could
we see differences between the EU level and the national level? Will national governments decide to
focus on short term economic recovery rather than faster decarbonisation measures as emissions have
plummeted in the first five months of 2020 and record high renewables shares have been registered in
the power sector?
The contents of this paper are the author’s sole responsibility. They do not necessarily represent the views of the
Oxford Institute for Energy Studies or any of its Members. 13You can also read