Quinte Health

                cope491:djk
←
→
Page content transcription
If your browser does not render page correctly, please read the page content below
Quinte Health
cope491:djk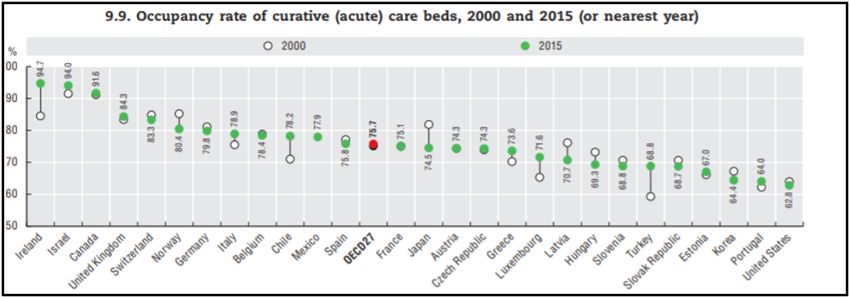
The Progressive Conservative government has claimed that its 2019 Budget “Protects
What Matters Most” and that it will end hallway health care. In fact, the PCs are
planning to reduce real funding to hospitals. Far from protecting what matters most, this
government is making things worse. The real capacity of hospitals in Quinte Health and
right across the province will be seriously reduced – if communities do not stand up and
demand better.

These cuts are especially troubling as Ontario hospitals are already grappling with
serious problems of under-capacity and “hallway health care”.

Low Hospital Capacity in Ontario

Although for decades Ontario funded hospitals at the same level as the other provinces,
since 2004-2005 we have fallen far behind. The graph below shows the dramatic
change.

                ONTARIO HOSPITAL PER CAPITA FUNDING
            SHORTFALL COMPARED TO REST OF CANADA, 1984/5
                             TO 2018/9
     1984–1985               1995–1996               2006–2007              2017–2018 f
 $500.00

 $400.00

 $300.00

 $200.00

 $100.00

   $0.00

 -$100.00

                                                                          P a g e 2 | 17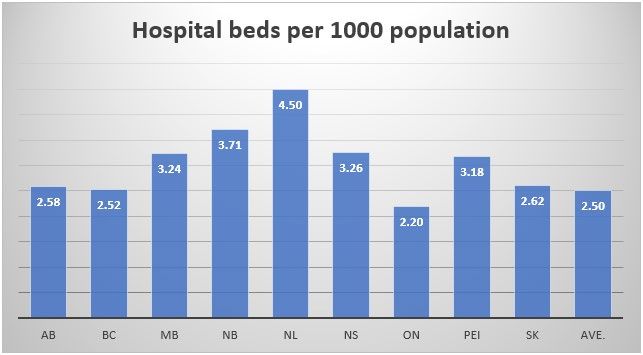
As a result, Ontario hospitals must provide inpatient care for much less than any other
province. In fact, the province with the second lowest costs (New Brunswick) provides
$356 more per standard patient than Ontario. The Canada-wide average is $677 more
than Ontario. (As the Canada-wide average includes Ontario, the cost difference
between Ontario and the rest of Canada is even greater.)

The $677 gap is up $45 from a $632 differential in 2016-2017 of $632.

Low hospital funding also means that patients must be discharged more quickly ―
length of stay in a hospital is 10.4% longer in Canada as a whole than in Ontario:

                   Average Length of Hospital Stay, 2017/18

               10.4
                         9.1                                    9.7
      8.6                          8.7
                                             7.4                                    7.8       7.6         7.4
                                                       6.7                6.7

Source: CIHI, Report name: “Inpatient Hospitalizations: Volumes, Length of Stay and Standardized Rates”

                                                                                              P a g e 3 | 17
Despite quick discharges, fewer patients are admitted into a hospital in Ontario than in
the rest of Canada. There are 12.5% more discharges per 1000 population in the rest of
Canada (TROC) than in Ontario:
Inpatient discharges per 1000 population
Ontario vs. the rest of Canada
90.0
87.5
88.0
86.0
84.0
82.0
80.0
77.8
78.0
76.0
74.0
72.0
Ontario TROC
Source: CIHI, Report name: “Inpatient Hospitalizations: Volumes, Length of Stay and Standardized Rates”
As a result, the rest of Canada has 31.2% more inpatient days per 1000 population than
Ontario.
INPATIENTS DAYS PER 1000 POPULATION
ONTARIO VS. THE REST OF CANADA
800
681
700
600
519
500
400
300
200
100
-
ONTARIO TROC
P a g e 4 | 17Another key result of low funding is a very low number of beds per capita, both in
comparison to other provinces and in comparison, to other developed countries.
Ontario would need another 4,352 beds to meet the Canada-wide average (including
Ontario) of 2.5 beds per 1,000 population. To meet the average for provinces outside of
Ontario (2.81 beds per 1,000) we would need another 8,793 beds. This in large part
explains the very high bed occupancy and hallway health care often reported by Ontario
media.
Notably, even Canada as a whole has a high hospital bed occupancy compared to other
nations. In other developed nations bed occupancy averages 76%, significantly below
the 80% or 85% levels often identified as maximums for safe patient care:
Under the OECD definition, "curative" hospital beds excludes rehabilitative and long-term care
beds. Source: Eurostat, “Health care resource statistics – beds,” 2016,
http://ec.europa.eu/eurostat/statistics-explained/index.php/Healthcare_resource_statistics_-_beds
P a g e 5 | 17Hospital beds however are simply a marker for hospital staffing levels. Accordingly,
staffing in Ontario hospitals is also much lower than the rest of Canada.
Hospital employees as percent of population
Ontario The Rest of Canada
2.00%
1.80% 1.88%
1.60%
1.40% 1.56%
1.20%
1.00%
0.80%
0.60%
0.40%
0.20%
0.00%
2017
Hospitals across the rest of Canada are already staffed 21% more than in Ontario.
If Ontario hospitals had the same staffing as hospitals in the rest of Canada, there
would be 45,000 more hospital employees in Ontario.
Instead of dealing with this lack of hospital capacity, and despite promising to end
hallway health care, the new government instead follows the path of previous
governments – along the well worn path of restructuring and privatization.
The Restructuring Diversion ― Bill 74 and The People’s Care Act, 2019
While the government has promised to end hallway health care, they are in fact going
back to the same play book as past governments – ignore hospital under-capacity and
instead pretend to fix the problem by diverting attention to restructuring.
P a g e 6 | 17Bill 74 was introduced and quickly passed by the government. Bill 74 in no way
addresses the main problems causing hallway health care and related health care
issues, the issue the Ford government was elected upon. Instead it creates cover for
not solving that problem by diverting attention to restructuring and (quiet) suggestions
of solutions via privatization.
This is not the first time this has been tried. The previous two rounds of restructuring
proposed a similar diversion – a diversion that blamed poor health care structure and
suggested a costless fix in the form of restructuring and, sometimes, privatization.
Those previous restructurings did not fix health care – instead they led us to hallway
health care and a dire lack of capacity.
The last PC government of the 1990s privatized home care, shut or merged scores
of hospitals, moved chronic care hospital services to less well funded (and often
privatized) long-term care facilities, and cut hospital funding by hundreds of millions
of dollars. Their goal was to move services out of hospitals and into home and
community care.
The Auditor General revealed however, that the mergers and hospital restructuring
actually cost the province $3.2 billion dollars. Despite hopes that these mergers would
help them cut spending, the Harris government quietly recognised reality, starting in
1998. By 2000, they quietly completed a U-turn on hospital funding, increasing funding
12.6% in one year.
Between 1998 and 2003 (when the PC government was defeated), funding increased
on average 7.5% per year. The Health Services Restructuring Commission completed
its work and shut down in March 2000. So arguably the fruits of its work might be
expected to have been gained in the five following years (including the first full year of
Liberal governance). But funding increases averaged 8.7% for the 2000-2004 period.
This, needless to say, is not strong evidence that the mergers, closures and
restructuring did anything to reduce costs.
P a g e 7 | 17Provincial Hospital Funding Annual Percentage Increase (or Decrease):
1995 -1.5
1996 1.9
1997 -4.8
1998 5.2
1999 6.1
2000 12.6
2001 3.1
2002 8.4
2003 9.7
2004 9.6
Source: CIHI National Health Expenditure Trends, Table D.4.6.1
Another round of restructuring began in 2007 with the creation of fourteen Local Health
Integration Networks (LHINs) to fund, oversee and restructure hospital, long-term care,
and other health care services. Again, the hope was to cut hospital capacity and solve
the ensuing problems through home and community care. This time, however, the cuts
expanded to include tight restrictions on long-term care, further compounding the
dramatic increase in the acuity of home care patients and leading to the removal of
some patients from publicly funded home care. The ultimate result is the lack of
capacity described earlier in this brief.
Now we are getting similar restructuring fairy dust for a third time in twenty-two years.
Despite the obvious problems with capacity in our hospitals, this reform does not add
any extra capacity at all. Instead, just like the two previous restructurings of our health
care system, it turns away from that need and focuses on restructuring our system,
once again.
Under the proposed legislation, the Minister may designate “Integrated Care Delivery
Systems” (ICDSs, sometimes referred to by the ministry as “Health Teams”).
P a g e 8 | 17Absent any commitment to protect services, a single accountability agreement will allow
ICDSs moving work from one organization to another. This was also the goal of the past
two restructurings of health care, with for-profit home care providers the preferred
provider. The government has passed legislation (via Bill 100) that they believe will
enable work to be transferred without transferring the workers, and without maintaining
collective agreement rights.
The last two restructurings did not solve the current capacity problem ― they have led
to it. The new government is using the same restructuring excuse to avoid re-building
capacity.
Privatization: Bill 74 and The People’s Care Act also opens up the potential for
privatization in many ways. This was also tried in the previous health care restructurings
– leading to the disasters of home care privatization, the exhaustion of unpaid family
caregivers, and the assorted associated crises of health care privatization over the last
two decades: (e.g. eHealth consultant fees; $8 billion in extra P3 hospital costs;
unlimited billing by private physiotherapy clinics; for-profit blood banks defying the
government and skirting the law; the ORNGE air ambulance use of privatization to
enable secrecy, deceptions, and a very high CEO salary; the repeated problems with
regulating for-profit surgical clinics; etc.).
The Act allows the transfer of all or part of 20 existing health agencies (employing
thousands of staff) into a new super agency: “Health Ontario”. A single Agency, with a
single government-appointed board of directors, can implement the government’s
agenda far more nimbly than the 14 LHINs ever could. So, it is notable that corporate
Canada has been given a very prominent role on the newly appointed board of the
super agency. Given their role in corporate Canada and profit maximization, it is very
hard to believe they will see the value of public health care and be as skeptical of for-
profit health care as much as ordinary citizens.
The Minister of Health and LTC is given even greater powers to restructure and
privatize health care providers. The Minister is also given powers to require Health
Ontario and any organization it funds to comply with her specific directives. This creates
P a g e 9 | 17another way in which services may be turned over to for-profit providers. Earlier, leaked,
documents suggest that the government would like to use economies of scale to
fundamentally change health care procurement services and supply chains.
The government was explicit in the budget about privatization, specifically singling out
the movement of hospital services to retirement homes, which are largely run by for-
profit corporations:
By creating transitional care spaces, patients can move from a hospital bed
to a transitional care bed in the community (such as a retirement home).
This is a more extreme, more corporate version of the last PC government’s movement
of whole categories of patients from hospitals to less well funded long-term care homes.
Long-Term Care Promises
An additional thirty thousand LTC beds over ten years will only partially offset the rapid
growth in the 85+ population. The Ontario Ministry of Finance projects 42.5% growth in
the most relevant population (85 and over) between 2018 and 2028. That growth would
require an additional 33,300 LTC beds. 1 By other measures, the need for beds is even
greater. The Ministry of Finance estimates the 75 and over population will increase
54.5% and the 90 and over population will increase 49%. 2
In other words, 30,000 new beds will not offset aging and will require either more
patients to be treated in home care, hospitals, doctor’s offices, or nowhere. It will
not help to resolve the hospital capacity problem.
Indeed, it will not make up for any portion of the decline in LTC capacity between 2004
and 2018 when the 85 and older population grew twenty times faster than the bed
1
This may underestimate the number of beds required as in recent years the government has begun to move
young people into LTC homes. If this policy is deepened, the number of beds required would increase further.
2
The Conference Board estimates 78% growth in the need for LTC beds in Canada between 2017 and 2035 – even
while assuming a marked reduction in the percentage of elderly people in LTC and increased number of patients
dealt with through home care. Applied to Ontario this would mean an additional 60,800 LTC beds.
P a g e 10 | 17supply. By itself, it will not even reduce the LTC wait list which has grown from 19,000 to
34,000 in just a few years. Instead, LTC admission requirements will have to become
even more stringent. 3
Real funding cuts
The stated plan of the provincial government is to increase nominal spending for all
programs (health and all other programs) by $125 million this year – i.e. by less than
1/10th of one percent. The government’s five-year plan to balance the books would see
an annual average increase of 1% per year, with the biggest increase coming as the
government faces re-election in 2022-23. With the provincial government’s inflation
forecast averaging 1.9% per year for the next five years, and the government’s
population growth forecast averaging 1.22% per year for the next five years, this is a
real cut in program funding of just over 2.1% per year – or more than 10% over five
years.
For health care, the plan is, on the surface, slightly better. But overall the news for
health care is actually significantly worse. For hospitals, the official plan is worse
still.
On the one hand, the Progressive Conservative government has responded to
community campaigns by promising to end hallway health care and to “protect what
matters most” – a reference to protecting health care and schools.
So, this fiscal year, health care funding is budgeted to increase $1.35 billion, while all
other programs are budgeted to decrease $1.2 billion. 4 This year’s increase health care
funding increase is 2.17%.
But far from protecting what matters most, this level of funding has led to immediate and
dramatic cuts.
3
This strategy was adopted by the previous Liberal government at the beginning of this decade, leading to a
temporary decline in wait lists.
4
Outside of education (which is receiving special funding to slow but not stop the elimination of teachers) and the
Solicitor General (police and jails), all other programs are scheduled to decrease $2.5 billion – or 5.2%.
P a g e 11 | 17Health Cuts to Date
The Ontario Health Coalition has compiled a list of health care cuts to date under the
new government:
• Cut OHIP+ so families with sick children will have to seek private coverage first
and pay deductibles and co-payments. (June 2018)
• Cut planned mental health funding by more than $330 million. (July 2018)
• Canceled all new planned overdose prevention sites. (Autumn 2018). Cut funding
for six overdose prevention sites. (April 2019)
• Cut funding to the College of Midwives of Ontario. (December 2018)
• Cut funding for the dementia strategy.
• Let surge funding run out for hospital overcrowding. Surge beds are now closed
without replacement, despite overcrowding crisis. (Fall-Winter 2018/19)
• Cut and restructured autism funding. (Winter 2018/19)
• Municipalities revealed Ford government plan to cut and restructure ambulance
services, down from 59 to 10. (April 2019)
• Leaked document reveals plans to cut half a billion dollars in OHIP services. On
the chopping block are sedation for colonoscopies, chronic pain management
services and others. (April 2019)
• Cut OHIP funding for residents travelling out of Canada. (May 2019)
• Cut 44 positions at the Ontario Telemedicine Network (OTN) — provider of video
medical services — which previously employed 265 people. In other words,
1 in every 6 telemedicine staff positions are being cut. The official dollar figure
has not yet been released, but, OTN received $42 million in provincial funding
2017-2018, nearly all came from the Ministry of Health. (May 2019)
• Abandonment of the long-held arrangement with municipalities for land
ambulance funding, cutting millions in provincial funding for emergency medical
services. This arrangement had allowed Emergency Medical Services to avoid
the worst austerity cuts of the previous government.
• Plans to reduce the number of Public Health Units from 35 to 10 and cut 27%, or
$200 million, of provincial funding for public health.
• Cut more than $70 million from eHealth’s budget. (May 2019)
• Cut almost $53 million from the Health System Research Fund, a fund dedicated
to research relevant to provincial policy and health-care system restructuring.
(May 2019)
• Cut $5 million in annual funding for stem-cell research at the Ontario Institute for
Regenerative Medicine. (May 2019)
• Cut $24 million in funding for artificial intelligence research from the Vector
Institute for Artificial Intelligence as well as the Canadian Institute for Advanced
Research. (May 2019)
• Cut $1 million in funding to Leave the Pack Behind a free program designed to
help young adults quit smoking. (May 2019)
• Cut $22 million from cancer screening programs. (May 2019)
P a g e 12 | 17The OHC also notes hospitals are being forced to make cuts:
• Cutting 40 nursing positions from Grand River Hospital in Kitchener – Waterloo.
Threat of more layoffs with new budget. (February 2019)
• Cutting obstetrical care on weekends at West Lincoln Memorial, women need
to travel to Hamilton if they go into labour on weekends. (February 2019)
• Cutting 14 full-time registered nurses at Orillia Soldiers’ Memorial Hospital.
(May 2019)
• Privatizing lab service, microbiology testing, transcription, Seniors’ Centre
of Care and patient transportation at South Bruce Grey Health Centre.
(January 2019)
• Cutting 40 clerical staff at St. Michael’s Hospital in Toronto. (May 2019)
• Cutting 80 staff from Windsor Regional Hospital (WRH) mostly in housekeeping
and food services departments. (April 2019)
• Cutting pediatrics and obstetrics-gynecology from the Birchmount campus of
Scarborough Health Network. (January 2019)
After the Budget, London Health Sciences Centre announced it was eliminating
165 full-time equivalent positions and cutting $28 million to deal with its deficit which
would otherwise grow this year by $29 million to $54 million. It has asked all
departments to cut 2% to 2.5%.
The Royal Ottawa hospital has also announced cuts of 6.5 full-time equivalent positions
in the CUPE bargaining units and more cuts in other bargaining units at the hospital.
Addiction and Mental Health Services – Kingston, Frontenac, Lennox and Addington
(AMHS-KLFS) is cutting 60 positions. (June 2019)
The reported elimination of 815 positions at the health agencies (LHINs, Cancer Care
Ontario, etc.) taken over by the provincial government’s new “super agency,” Health
Ontario (June 18).
But the PCs plan much more austerity…
This year’s 2.17% nominal health care funding increase will fall to an average of 1.4%
for the following three years. Funding will increase in 2023-24 by 2.6%, with the result
that over five fiscal years, the PC government plans an average annual nominal
increase of 1.77% for health care funding.
The five year health care annual increase averages 0.77% more than the overall
program funding increase of 1%. However, health care cost pressures also include
the aging population. Typically, this is put at 1% per year for Ontario. As a result,
health care actually faces more cost pressure than programs overall – in total by over
P a g e 13 | 174% annually. 5 As a result, health care funding as a whole will fall behind cost pressures
by 2.4% per year over the five years forecasted (1.9% inflation + 1.22% population
growth + 1% aging = 4.17% cost pressures, and 4.17% cost pressures – 1.77% nominal
funding increasing = 2.4% annual shortfall).
The situation is worse than this, however, for hospitals. A large portion of the future
health care funding increases will go to doctors despite the fact that doctors (unlike
hospitals and health care as a whole) are funded in Ontario at the same per-capita level
as in other provinces (both are at close to $1,000 per year per-capita in 2018-19).
Here’s the comment from Ontario’s Financial Accountability Office:
The FAO estimates that 43 per cent of the annual average increase of
$1.1 billion (or about $0.5 billion annually) will go to the OHIP (physicians
and practitioners) program area. 6
That is a 3.1% annual average increase over the next five years for the second biggest
part of the Ministry of Health and Long-Term Care budget, according to the FAO. Higher
than average increases will also be found in some other areas.
For hospitals, however, that means smaller increases. The FAO reports that “to achieve
the health ministry spending restraint outlined in the 2019 budget, the Province will be
required to restrict base hospital operating funding growth to less than one per cent
annually over five years.” 7
One percent funding would mean that hospital funding will fall on average 0.9% behind
the government’s inflation forecast. As a result, real funding would be reduced 4.6%
due to inflation over five years. The impact on services would be slightly less as only
85% of hospital revenue comes from the provincial government. The impact on services
would be a 3.91% cut (4.6% x 85%). Applied to beds and staff, this would mean an
absolute cut of 1,230 beds (31,466 beds x 3.91%) and 8,641 staff (221,000 current
staff x 3.91%). In Quinte Health this would mean a cut of 10 beds and 70 staff.
5
Health care cost pressures also often include an increase for utilization – if that was included in this analysis,
health care would be further behind.
6
FAO, Expenditure Estimates 2019-20 Ministry of Health and Long-Term Care, May 27, 2019, page 9.
7
Ibid, page 15.
P a g e 14 | 17As noted, however, other cost pressures mean that the actual impact on services is
greater. Inflation, population growth, and aging cost pressures combined equal 4.17%,
meaning that the real per-capita funding shortfall is over 3% per year. In other words,
we would be looking at a real per-capita funding cut of well over 15% over five years.
Real Per-Capita Hospital Funding
2019-20 2020-21 2021-22 2022-23 2023-24
-3%
-6%
-9%
-12%
-15%
Based on an annual average nominal funding increase of 1%
A 15% cut to this year’s provincial hospital real per-capita funding is the equivalent of a
$2.85 billion cut in this year’s hospital funding ($19 billion x 15% = $2.85 billon). Again,
the impact on services would be somewhat less as only 85% of hospital revenue comes
from the provincial government. As a result, the impact on all services would be a
12.75% cut (15% x 85% = 12.75%).
The government’s plans are vague at best. The main reform affecting hospitals (the
proposed creation of Integrated Care Delivery Systems or ICDSs) leaves the main
decisions about the nature of the changes up to health providers. The plan is also
evolving as this is being written. Moreover, the government’s plan is to “reduce reporting
and reporting burdens where possible”. 8 All this means that the nature of the ultimate
reforms are unknown even to the government.
8
So for example the 1,800 health service providers in the province have one or more accountability agreements
with a LHIN. The plan is to have only one accountability agreement with each of the approximately 50 ICDSs.
P a g e 15 | 17In this situation one way to understand the impact of the cuts would be to assume that
the cuts affect all areas of hospital operation equally – neither more nor less in any
given area of hospital activity – and then measure the impact in specific areas. Under
this assumption, if applied to this year’s population, the real funding cuts would mean
Ontario would have to get by with 4,012 fewer hospital beds than currently exists
(31,466 existing beds x 12.75%) and 28,187 fewer staff than there currently are
employed (221,000 existing hospital staff x 12.75%). 9
For Quinte Health, this would be akin to a loss of 33 beds and 230 staff for the hospitals
operating today.
Even if the hospitals were to somehow find thirty percent of these cuts without touching
hospital beds or staff at all, the real funding cuts would mean 2,808 fewer beds to serve
our current population (31,466 x 12.75% x 70%) and 19,724 fewer staff (221,000 x
12.75% x 70%).
Conclusion
Based on comments during the election campaign, we estimated last summer that the
PCs would implement cuts to hospital services in Ontario. We noted that those plans
require at least a 4% funding cut.
However, we are now able to rely on information provided in the 2019/20 Budget rather
than campaign rhetoric. It is now apparent that the new government is actually planning
to make larger cuts. We estimate that inflation will eat away 4.6% of provincial funding.
As a result, we estimate that currently operating beds will be cut by 1,230 and current
staffing levels will be cut by 8,641.
However, this does not capture the full damage that will be done to hospital capacity as
it does not consider the extra capacity needed due to population growth and population
aging. When also considering population growth and aging, the real per-capita funding
9
In the past, hospital beds and inpatient services have been especially targeted for cuts, so, if that patterns
continues, this may underestimate the impact on beds.
P a g e 16 | 17cuts proposed are over 15% over five years. If that level of cuts were applied to
hospitals today that would mean 4,012 fewer beds and 28,187 fewer staff to serve our
current population. Even if, somehow, the hospitals were able to make 30% of these
cuts without affecting staff or beds, that would still be a cut equivalent to 2,808 fewer
beds and 19,724 fewer staff for our current population.
For Quinte Health, this would mean an absolute cut of 10 beds and 70 staff over five
years. Given population growth and aging, that would be akin to a cut of 33 beds and
230 staff in the local hospitals today.
The brief shows that Ontario already has far fewer hospital beds and staff than the rest
of Canada. The new government’s plans will make this much worse.
The new government is not “protecting what matters most”. Instead, the problems of
hospital under-capacity will sharply intensify, unless communities speak out and require
this government to change direction.
P a g e 17 | 17You can also read