Healthcare Development Opportunities - Research 2020 - Knight Frank
←
→
Page content transcription
If your browser does not render page correctly, please read the page content below
C-19 only a short-term      Upgrading the market has    New development and
disrupter to construction   never been more important   re-development will be essential

Healthcare
Development
Opportunities
Research 2020
H E A LT H C A R E D E V E L O P M E N T O P P O R T U N I T I E S 2 0 2 0 H E A LT H C A R E D E V E L O P M E N T O P P O R T U N I T I E S 2 0 2 0
CARE HOME Fig 2: Elderly care beds (per 100 people aged 85+), by region in 2020
STOCK CHECK North East 35.9
North West 32.4 480k
Total care beds
East Midlands 31.6 in the UK
Yorks & The Humber 31.5
West Midlands 28.4
Our annual analysis of UK elderly care stock shows that the market
totalled 12,170 homes and 479,600 beds, as of April 2020. South East 28.1
South West 27.2
While the number of homes has fallen
marginally from the 12,250 homes Fig 1: Number of care homes by region, total = 12,170
East of England 26.2
12,170
19.7 Total care homes
measured last year, the number of London
in the UK
beds increased by 2,500. The growth
is partly because larger purpose-built South East 1,920
homes are beginning to replace smaller
outdated homes; partly because many North West 1,460 Northern Ireland 34.9
existing homes are adding beds to meet
demand and maximise income; and South West 1,400 Scotland 28.9
partly down to better data coverage.
East of England 1,120
Wales 25.7
uu
West Midlands 1,100 Source: Tomorrow’s Guides, ONS 40
The pace of building needs
to increase to keep pace East Midlands 1,030
beds
with our rapidly ageing average home
size in the UK
population. Yorks & The Humber 1,000 Fig 3: UK elderly care beds (per 100 people aged 85+)
uu 36
London 730 FORECAST*
34
While the UK care home market 550
32
North East
is growing in absolute terms, it is 30
shrinking in relative terms. As shown
28
in Figure 3, the number of care home
beds per 100 people over the age of 85 26
Scotland 830
has fallen from 33.7 to 28.7 since 2010. 24
2.1m
If the same rate of growth in beds (0.6%
Wales 630 22
CAGR) is applied to the next decade,
bed provision will fall much further 20
over 85s by 2030
Northern Ireland 330
2020
2030
2028
2026
2029
2025
2022
2024
2023
unless new development increases to
2027
2010
2018
2014
2016
2019
2015
2012
2021
2013
2017
(1.6m in 2020)
2011
keep pace with our rapidly growing
elderly population. Source: Tomorrow’s Guides
Source: Knight Frank, Tomorrow’s Guides, ONS
*Forecast calculated by applying CAGR growth rate for beds from 2010-2020 (0.6%) to ONS population projections
2 3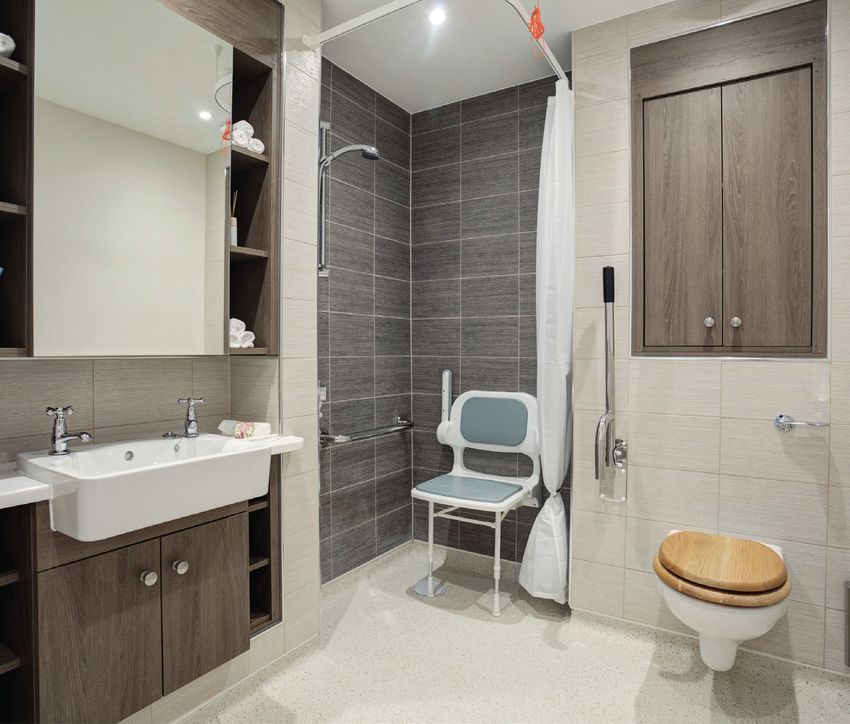
H E A LT H C A R E D E V E L O P M E N T O P P O R T U N I T I E S 2 0 2 0 H E A LT H C A R E D E V E L O P M E N T O P P O R T U N I T I E S 2 0 2 0
ASSESSING THE CLOSURES AND
IMPACT OF COVID-19 OPENINGS
Moderate impact to occupancy: The case death toll will not be enough to derail and while nobody wants to see care homes In the 2019/20 financial year, a total of 7,058 beds (122 homes) were newly registered
higher risk of mortality among the elderly the growth in our elderly population in struggle, COVID-19 may act as a reminder and 6,789 (233 homes) were de-registered.
population has inevitably put the care the approaching decades. As the current that changes are desperately needed to
sector in the spotlight. While mortality baby boom generation (currently aged 55- better fund the care sector and future-
As has been the case in recent years, Why is the level of home closure
rates have been elevated and individual 75) enters old age, we will see the over 85 proof the market.
the level of home closures continues so high? With 58% of de-registered Fig 6: De-registration vs new
homes have suffered, operators have population grow from 1.6 million in 2020 registration (beds)
Design implications: This pandemic to offset the building of new homes homes rated as ‘inadequate’ or
collectively dealt with the pandemic to 3.7 million by 2050. Inevitably, the long-
will also have a significant impact on (Figure 6). That said, many existing ‘requires improvement’ by the Care De-registered beds
incredibly well. Knight Franks’ tracking of term demographics will continue to drive New registered beds
care home design and specification. This homes are now adding beds through Quality Commission (CQC), failing
major operators shows that occupancy has bed demand. 9,000
includes wider corridors to help enable extensions and redevelopments, care standards are a clear cause of
typically declined between 6-10% – much
Which homes are at risk? We expect the social distancing; larger rooms with full en helping somewhat to grow the number closure. Financial stress is an equally 8,000
less than what many feared at the onset of
pandemic to have a more pronounced suite and wet room facilities (as pictured of beds. significant cause of closure. Increasing 7,000
COVID-19. Crucially, mortality rates have
effect on smaller independent homes that below) as standard to promote resident costs, especially staffing costs, have
now normalised and new admissions are As evidenced by Figure 5, regions with 6,000
lack the scale to cope with occupancy loss, isolation; adapted fixtures and fittings to impacted many care homes in recent
also steadily returning. Additional waves higher urban concentrations have 5,000
or the building design and management limit touch points; and safer visitor areas years at a time when fee levels derived
of the virus are a possibility, but the strict reported greater net gains in care beds
infrastructure to better protect against with enhanced communication systems. from local authorities have been frozen. 4,000
infection control demonstrated by the over the last three years. This is the
the virus. As shown in Figure 4, there While care is fundamentally about The COVID-19 pandemic will add to the 3,000
sector so far suggests most operators are case for the South East, North West
are over 6,500 homes below the 40-bed people, hopefully the virus will promote financial pressures for many smaller 2016/17 2017/18 2018/19 2019/20
well-prepared. and Midlands regions but London is
marker and half of these homes lack the a more widespread use of technology independent homes not ready for a Source: Knight Frank, Tomorrow’s Guides
an exception because of the barriers to
Long-term drivers won’t change: While en suite or wet room provision – one of (E.g. acoustic monitoring) both to protect severe hit to occupancy.
new development in this region. The
its been a difficult period for many, it's many things needed to support social residents against outbreaks, but also to
Southwest has lost the most beds, with
important to remember that even a worse distancing. This outdated stock is at risk drive efficiency and assist care staff. Profiles of de-registered and new registered homes
many outdated and rurally located
homes closing.
Care type Size En suite provision Care inspections Build type
Personal : Nursing ratio Average beds % of beds % rated inadequate % converted use
or requires improvement
Fig 4: UK care homes by size
and en suite provision
With En suite Fig 5: Net gain/loss of beds by
Without En suite region (last three years)
registration (beds) 70% 20%
5,000
40
800 30%
58:42
600
4,000
400
3% 75:25
3,000 200
0 n/a 30
2,000
-200
94% 51%
-400
1,000
-600 60 58%
52%
South East
North West
West Midlands
East Midlands
Scotland
Northern Ireland
Wales
London
North East
Yorks & The Humber
East of England
South West
40:60
0
1-19 beds
20-39 beds
40-59 beds
60-79 beds
80-99 beds
100+ beds
Source: Knight Frank, Tomorrow's Guides
Source: Knight Frank, Tomorrow’s Guides Source: Knight Frank, Tomorrow’s Guides New registered homes All UK care homes De-registered homes
Market-leading en suite facilities, Hallmark Care
4 5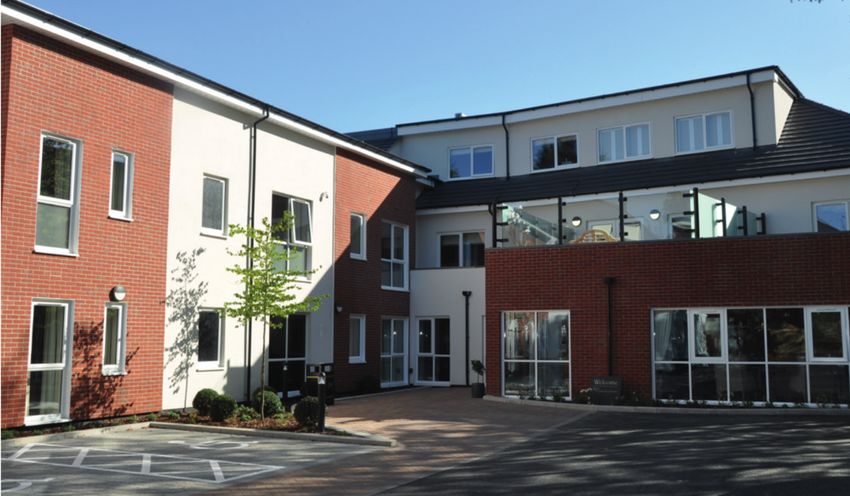
H E A LT H C A R E D E V E L O P M E N T O P P O R T U N I T I E S 2 0 2 0 H E A LT H C A R E D E V E L O P M E N T O P P O R T U N I T I E S 2 0 2 0
NEW BUILD
Table 1: Specification and costing of care home classes
TERTIARY SECONDARY PRIME (INCLUDING SUPER PRIME
DEVELOPMENT (CONVERSIONS) (OLDER PURPOSE-BUILT) REDEVELOPMENTS) NEW BUILDS
Build type Converted use Purpose built Modern purpose built Modern purpose built
Age pre 1990 1990 to 2000 2000 to present 2015 onwards
Size (beds) 25 to 40 40 to 80 60 to 80 60 to 80
S P E C I F I C AT I O N
Room Size c.12m2 12 to 15m2 c.16m2 17m2 +
Shared facilities or Shared facilities or
En suite En suite
Bathrooms en suite rooms (WC & en suite (WC, wash basin
(WC and wet room) (WC and wet room)
wash basin only) and sometimes wet room)
Care home developers have been active in recent years, adding around 5,000 new
care beds per annum to the market since 2015. Land size Mixed 0.5 to 1 acre 1 to 1.2 acres
1 to 2 acres (regional)
0.5+ acres (London)
Lower income / high Average income / high Higher income / high Higher income / low
Typical Resident
dependency and low dependency and low dependency dependency / dementia care
Our tracking of new builds shows that
Fig 8: New build care homes (2015 to April 2020) Build cost (per bed)* n/a n/a £100K+ £125k+
79 new homes completed in 2019,
COSTINGS*
while 2020 was on course to post a Year built Size reflective Average weekly fees £550 to £950 £650 to £1,050 £850 to £1,250 £1,300+
of home size
similar number until construction
2016 EBITDARM (at maturity) 20% to 25% 25% to 30% 30% to 35% 35% to 45%
sites were frozen in the COVID-19 2017
2018
outbreak. A quarter of new builds are Yield (net initial) 6% to 7% 6% to 7% 4% to 5% 3.5% to 4%
2019
occurring in South East of England 2020
where the demand fundamentals are Source: Knight Frank *Please note: costings will differ according to region, funding type and care type
strongest, owing to a large elderly
population and an affluent one at As shown in figure 9, most new care Higher expectations of care quality showcase the homes at this end of the
that. Despite this, new build activity homes take at least 24 months to reach are also driving improvements in market in order to inspire innovation
is widespread across the UK with mature levels of occupancy. However, design for new build care homes. across the broader care sector.
opportunities for development across there is huge variation between new Leading prime quality homes have
all regions (Figure 8). homes – some reaching maturity after an exceptional range of facilities and
only 12 months and others only 50% amenities that aim to improve the
occupied after three years of trading. quality of later living. Of course, many What makes a care home
This highlights the importance of homes and communities do not possess property super prime?
Fig 7: New beds completed
(16 months to April 2020) careful site selection and due diligence the levels of income required to fund
ooms: Apartment-style
R
for new sites so new homes can reach such facilities – a separate matter. suites with full wet room
New beds (L) optimal income as soon as possible. Nevertheless, it’s important that we facilities and private space
New beds as a % of stock (R)
Dining: Restaurant & café
2,500 3.0%
as well as private dining
2.5% Fig 9: Fill rates, occupancy since opening and bar areas
2,000
2.0% Highest Lowest Average Leisure: Cinema rooms and
1,500 activity rooms
1.5% 100%
1,000 90% Wellbeing: Fully
1.0% 80% landscaped gardens, salon,
70% spa or therapy rooms
Occupancy rate
500
0.5%
60%
50%
Visitors: additional visitors
0 0.0% Sources:
Esri,
40%
areas and crèche facilities
South East
West Midlands
North West
South West
East of England
Yorks & The Humber
East Midlands
London
Scotland
Wales
North East
30%
Memory Care: Dementia
20%
care suites, assistive
10%
technology and decorative
0%
adaptations
less than 12 months 12 to 24 months 24 to 36 months 36 months +
Period since opening Finish: luxury hotel quality
Source: Knight Frank, Tomorrow’s Guides Source: Knight Frank Source: Knight Frank
furnishing and decoration
6 7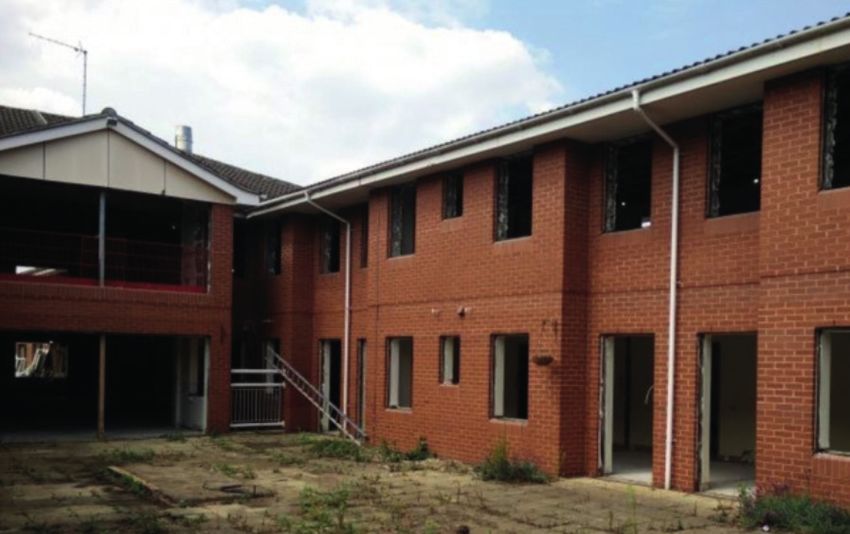
H E A LT H C A R E D E V E L O P M E N T O P P O R T U N I T I E S 2 0 2 0 H E A LT H C A R E D E V E L O P M E N T O P P O R T U N I T I E S 2 0 2 0
WHERE TO BUILD? –
THE CARE VILLAGE: SYNERGIES BETWEEN
HEALTHCARE & SENIOR LIVING KNIGHT FRANK DEVELOPMENT
The senior living (or retirement living)
sector is typically seen as a separate
(Continuing Care Retirement
Community) model. While in its
HOTSPOTS INDEX
sector from that of care homes, but infancy in the UK, CCRC’s are already
uu
there are some increasing synergies. an established and successful concept
The retirement village Top-end care homes are beginning in the US and Australia. These large
or CCRC model is in its to adopt the “living” element by scale retirement schemes offer elderly
infancy in the UK, but is an incorporating more leisure and people a pathway from downsizing
established concept in the lifestyle facilities as well as luxury from their family home into an assisted
US and Australia. hotel style furnishing and decoration. living or extra care property with the
Similarly, senior living developments further option of part-time home care
uu
also focus on the “care” element by packages, all the way through to the
branching out their models to include option of full-time care within a care
Knight Frank’s Care Home Development Index identifies locations that are considered to
assisted living, memory care and home on the same site. While this all-
present the best future prospects for care home development. The index analyses 50 counties
personal care packages for residents. encompassing model targets a more
in England and Wales and 12 in Scotland, based on eight equally weighted variables
affluent demographic, developers are
These synergies are best displayed comprising demographic and economic projections, levels of wealth, existing bed supply, the
moving into the affordable space and
through the emergence of the future supply pipeline, land values and operational performance. The next two tables show
there is a huge opportunity.
retirement village or CCRC a county’s ranking on each variable. The Index score indicates a county’s total score relative
to the national average with indices above one implying above average scores.
Care home development prospects – top 15 counties in England and Wales out of 50 in analysis
COUNTY REGION ELDERLY ECONOMIC WEALTH CURRENT FUTURE LAND AVERAGE STAFF TOTAL
POPULATION* GROWTH* SUPPLY SUPPLY VALUES WEEKLY COSTS SCORE
FEES INDEX
1. Buckinghamshire South East 5 3 4 16 8 46 3 47 1.54
2. Greater London Greater London 1 1 1 3 23 50 11 43 1.53
3. South Glamorgan Wales 19 8 15 11 12 10 17 44 1.49
4. Berkshire South East 6 2 2 8 46 46 2 42 1.32
5. Cambridgeshire East of England 9 7 9 10 36 44 16 25 1.30
6. Essex East of England 16 11 27 15 13 38 30 15 1.23
7. Hampshire South East 14 10 10 22 34 43 8 38 1.14
8. Bedfordshire East of England 2 9 20 14 35 36 28 35 1.14
9. Cornwall South West 35 15 43 7 7 14 9 50 1.13
10. Avon & Somerset South West 26 14 12 12 26 40 21 29 1.13
11. West Midlands West Midlands 36 32 24 1 16 25 31 19 1.10
12. Cumbria North West 48 43 16 9 3 10 36 20 1.10
13. Warwickshire West Midlands 30 30 7 31 1 33 32 21 1.10
14. Northamptonshire East Midlands 4 26 18 29 44 31 26 9 1.09
15. West Yorkshire Yorks & The Humber 25 21 23 30 28 9 40 11 1.09
Source: Knight Frank
Retirement Village Letcombe Regis, Richmond Villages (part of Bupa), Castloak Development *Based on 15 year projection, 2020 to 2035 Top rank Bottom rank
8 9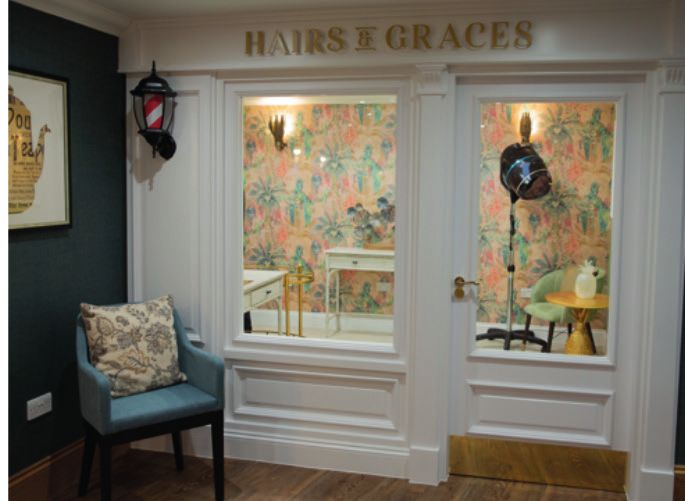
H E A LT H C A R E D E V E L O P M E N T O P P O R T U N I T I E S 2 0 2 0 H E A LT H C A R E D E V E L O P M E N T O P P O R T U N I T I E S 2 0 2 0
REFURBISHMENT AND
Care home development prospects – top 6 regions of out of 12 in analysis
REDEVELOPMENT
COUNTY ELDERLY ECONOMIC WEALTH CURRENT FUTURE LAND AVERAGE STAFF TOTAL
POPULATION* GROWTH* SUPPLY SUPPLY VALUES WEEKLY COSTS SCORE
FEES INDEX
Lothian (Edinburgh) 1 1 3 5 7 12 1 12 1.23
Grampian (Aberdeen) 5 2 1 8 4 10 3 10 1.20
Borders 8 7 10 1 3 2 11 1 1.20
Highlands & Islands 9 9 4 2 6 1 5 8 1.17 Building enough new care homes is one challenge for the sector, but what about
Central (Stirling & Falkirk) 4 5 6 4 12 4 2 9 1.12 existing stock? With 70% of UK care home facilities built prior to 2000, the more
Glasgow & Renfrewshire 3 3 2 12 10 11 4 5 1.03 pressing issue for many operators is how to upgrade their existing portfolio.
Source: Knight Frank
*Based on 15 year projection, 2020 to 2035
This process is certainly underway with refurbished homes generating an
Top rank Bottom rank
with 884 UK care homes undergoing additional £3,000 of EBITDARM per bed Fig 11: Trading data for
refurbished care homes vs
refurbishment or extension, as of March per annum, according to our sample. non-refurbished
Counties in the South East and East private pay market. The main challenges Both counties rank in the top 15 for 2020 according to Glenigan. While
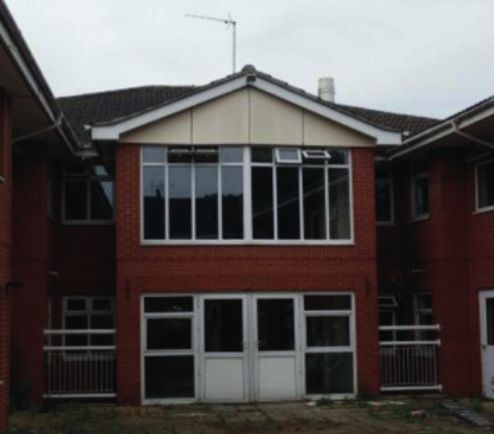
In some cases, a much larger
of England score highly because of to development in these regions are high levels of wealth, but also have a limited COVID-19 may cause some disruption Not refurbished Refurbished
redevelopment may be required to take
projected economic growth, elderly land and build costs, as well as staff costs amount of new developments in the to refurbs already underway, the need
an underperforming home and turn it
population growth and wealth, the latter which are typically above average for pipeline. Lower land values in localities to upgrade will increase with operators
into a prime quality care home. There are AVERAGE WEEKLY FEES
measured as average levels of income. England and Wales. such as these may present developers having to adapt and re-design homes for
some exciting examples of this, including £940
Prospects for care home development are with significant opportunities to exploit future pandemics.
Cumbria and Warwickshire were the Candlewood House (pictured), which
strong in these markets, especially for any supply-demand imbalance. £870
biggest climbers in the index this year. The right refurbishments not only transformed a stressed facility into a £850
those homes targeting the more affluent
improve the quality of care, but luxury home with full en suite rooms, £790
can dramatically improve financial outstanding indoor and outdoor space,
performance. Data from Knight Frank’s an orangery and a retro music room.
annual Trading Performance Review While every redevelopment location Conversion Purpose Built
The case for redevelopment: TLC’s Candlewood House
shows that homes refurbished in the last is different, carefully planned, well
five years, including both conversion designed and well located developments OCCUPANCY RATES
and purpose build, are able to generate such as this one have been able to 89.4% 89.7%
fees 10% higher while maintaining transform into prime future-proofed 88.0% 88.0%
similar occupancy levels. This results homes with fee rates that reflect this.
in a significant uplift to profitability,
Conversion Purpose Built
Fig 10: Homes undergoing refurbishment or extension, as of April 2020
PROFITABILITY (EBITDARM PER BED)
South East 141
BEFORE West Midlands 99 £13,400 £13,720
South West 97
North West 91 £10,990
£10,400
East of England 90
AFTER East Midlands 79
Yorks & The Humber 63
London 61
Scotland 61 Conversion Purpose Built
Wales 58
North East 34
Northern Ireland 10 Source: Knight Frank Trading Performance Index 2019
0 30 60 90 120 150 Refurbished includes homes refurbished in the last 5
years; Not refurbished includes all homes in the index
Source: Glenigan (April 2020) opened before 2000
Candlewood House (Cricklewood, London), TLC Care, DWA Architects
10 11
FORWARD VIEW
in the market currently not up to classes into healthcare or retirement
standard. Although the rate of care living residences.
home closures may accelerate in the
Developers, investors and operators
aftermath of COVID-19, construction
active in the care home market
activity has returned and the long-
Mandip Bhogal, Healthcare will require a greater level of due
term demand story is unchanged.
Development Consultant diligence to understand the risks
In the next 18 months, we expect to and benefits at play. Whether
Demand for modern purpose-built see the repositioning of existing care you require expertise on sourcing
and future-proof care facilities homes as they look to adapt to a post- suitable development sites, require
will only continue to increase, COVID-19 environment. As part of a acquisition due diligence or needs
owing to our ageing population broader high street revitalisation, we assessments, Knight Frank have
and the national care bed crisis also expect to see the re-purposing of range of services to suit.
we face with many care homes well-located alternative use property
Front cover photo: Windsor Court, Wetherby, Ideal Please get in touch with us
Carehomes, LNT Group (Chris Wallbank Photography)
Healthcare Commercial Research
Case study – Candlewood House (page 10): TLC
Care, DWA Architects, MP Brothers Construction, Julian Evans FRICS Joe Brame
John Cobb Consulting and Hide and Seek Studios for
Head of Healthcare Senior Analyst (Healthcare)
interior design.
+44 20 7861 1147 +44 20 3967 7139
julian.evans@knightfrank.com joe.brame@knightfrank.com
Patrick Evans MRICS
Senior Living
Head of Corporate Valuations
Recent Publications
+44 20 7861 1757 Tom Scaife
RESEARCH
Transactions hit Domestic and overseas Returns hold strong
patrick.evans@knightfrank.com Head of Senior Living
Trading Performance Review
£1.76 billion in 2019 capital targets healthcare relative to core sectors
Healthcare Capital Markets
2019
CARE HOMES Healthcare +44 20 7861 5429
knightfrank.com/research
TRADING PERFORMANCE REVIEW
Capital Markets Kieren Cole
tom.scaife@knightfrank.com
Research 2020
Head of Commercial Valuations
+44 20 7861 1563 Lauren Harwood
kieren.cole@knightfrank.com Head of Senior Living Research
HIGHLIGHTS
Average weekly fees up for
Staff costs continue to grow Profit margins remain squeezed
+44 20 7268 2599
Mandip Bhogal, BSc (Hons)
with operators increasingly but the private pay market is
the eighth year in a row
dependent on agency workers performing well
lauren.harwood@knightfrank.com
Why is investment 6 key trends Case studies: Germany,
Associate, Development Consultant
European Healthcare Report
interest growing? driving the market France & Spain
European +44 203 869 4702
knightfrank.com/research
knightfrank.com/research
Project & Building Consultancy
UK Healthcare Overview
Healthcare
Elderly Care Market, Research 2020
mandip.bhogal@knightfrank.com
UK
E
AR Puneet Vedhera
LT HC RTY
A E
HE PROP RKET
MA VIEW
ER
20
20
Associate, Project & Building Consultancy
OV
ER
MM
/ SU
RING
SP
+44 20 7861 1101
puneet.vedhera@knightfrank.com
Knight Frank Research Knight Frank Research provides strategic advice, consultancy services and forecasting to a wide range of clients
worldwide including developers, investors, funding organisations, corporate institutions and the public sector. All
Reports are available at our clients recognise the need for expert independent advice customised to their specific needs. © Knight Frank
knightfrank.com/research LLP 2020. Terms of use: This report is published for general information only and not to be relied upon in any way. All
information is for personal use only and should not be used in any part for commercial third party use. By continuing to
access the report, it is recognised that a licence is granted only to use the reports and all content therein in this way.
Although high standards have been used in the preparation of the information, analysis, views and projections presented
in this report, no responsibility or liability whatsoever can be accepted by Knight Frank LLP for any loss or damage
resultant from any use of, reliance on or reference to the contents of this document. As a general report, this material
does not necessarily represent the view of Knight Frank LLP in relation to particular properties or projects. The content
is strictly copyright and reproduction of the whole or part of it in any form is prohibited without prior written approval
from Knight Frank LLP. Knight Frank LLP is a limited liability partnership registered in England with registered number
OC305934. Our registered office is 55 Baker Street, London, W1U 8AN, where you may look at a list of members’ names.

You can also read