Investor Presentation - Citi Global Property CEO Conference March 4 - 6, 2019 - Together with you, we make a house a home - Invitation ...
←
→
Page content transcription
If your browser does not render page correctly, please read the page content below
Investor Presentation

 Citi Global Property CEO
        Conference

    March 4 - 6, 2019

                            Together with you, we make a house a home.
Disclaimer
This presentation contains forward-looking statements within the meaning of Section 27A of the Securities Act of 1933, as amended (the "Securities
Act") and Section 21E of the Securities Exchange Act of 1934, as amended (the "Exchange Act"), which include, but are not limited to, statements
related to the Company’s expectations regarding the anticipated benefits of the merger with Starwood Waypoint Homes, the performance of the
Company’s business, its financial results, its liquidity and capital resources, and other non-historical statements. In some cases, you can identify
these forward-looking statements by the use of words such as "outlook," "believes," "expects," "potential," "continues," "may," "will," "should,"
"could," "seeks," "projects," "predicts," "intends," "plans," "estimates," "anticipates" or the negative version of these words or other comparable
words. Such forward-looking statements are subject to various risks and uncertainties, including, among others, risks associated with achieving
expected revenue synergies or cost savings from the merger, risks inherent to the single-family rental industry sector and the Company’s business
model, macroeconomic factors beyond the Company’s control, competition in identifying and acquiring the Company’s properties, competition in
the leasing market for quality residents, increasing property taxes, homeowners' association fees and insurance costs, the Company’s dependence
on third parties for key services, risks related to evaluation of properties, poor resident selection and defaults and non-renewals by the Company’s
residents, performance of the Company’s information technology systems, and risks related to the Company’s indebtedness. Accordingly, there are
or will be important factors that could cause actual outcomes or results to differ materially from those indicated in these statements. Additional
factors that could cause the Company’s results to differ materially from those described in the forward-looking statements can be found under the
section entitled "Part I. Item 1A. Risk Factors," of the Annual Report on Form 10-K for the fiscal year ended December 31, 2018, filed with the
Securities and Exchange Commission (the "SEC"), as such factors may be updated from time to time in the Company’s periodic filings with the SEC,
which are accessible on the SEC’s website at http://www.sec.gov. These factors should not be construed as exhaustive and should be read in
conjunction with the other cautionary statements that are included in this presentation and in the Company’s filings with the SEC. The forward-
looking statements speak only as of the date of this presentation, and we expressly disclaim any obligation or undertaking to publicly update or
review any forward-looking statement, whether as a result of new information, future developments or otherwise, except to the extent otherwise
required by law.

                                                                         2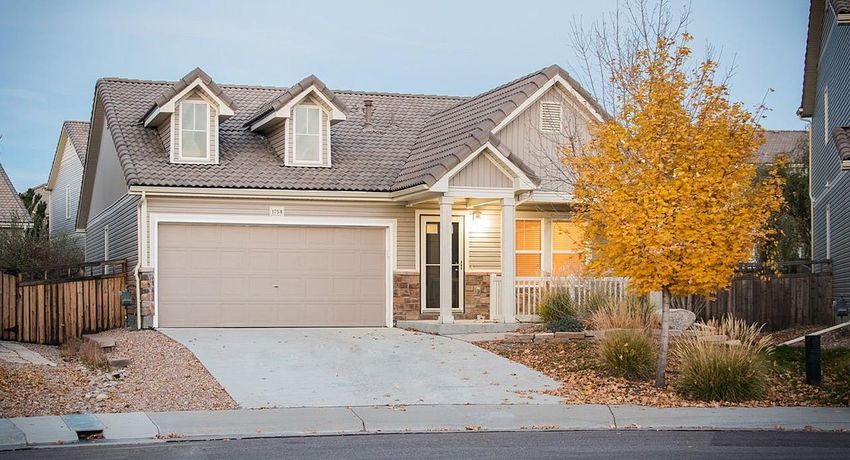
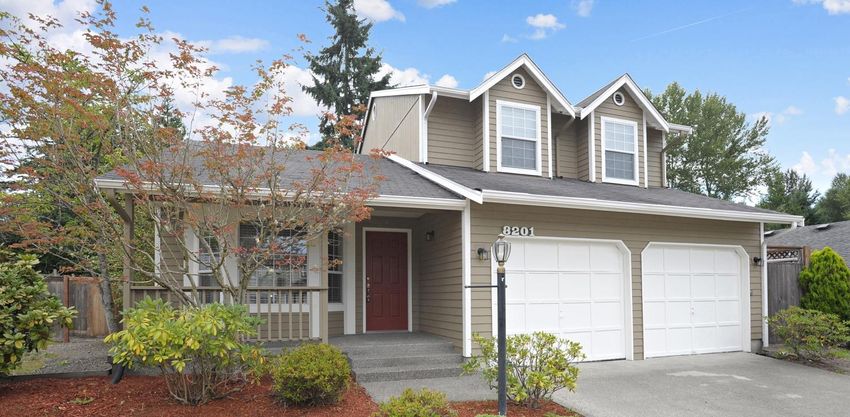
Southern California

      I.              INVITATION HOMES INVESTMENT HIGHLIGHTS

                                          3
Investment Summary
 Leading investor and operator of over 80k homes in a sector with outsized growth prospects

                                           • 12.5M net households to form in next 10 years; millennials reaching age where needs align with single-family housing (1)
  Outsized Growth
                                           • Single-family housing supply growth remains low, and increasingly constrained by rising construction costs
  Prospects for SFR
                                           • Affordability moving more in favor of single-family rental versus homeownership

                                           • Significant scale and market density – 80,807 total homes, with ~4,750 homes per market on average
  Premier Portfolio
  with Unmatched                           • Focused on strategically selected high-growth markets (70% of revenue from Western U.S. and Florida)
  Scale & Locations
                                           • Household growth ~2x the US average in INVH markets; more affordable to rent a home than own in 15 of 17 markets (1)

                                           • Deep, experienced management team with track record of creating value through focused management and innovation
       Best-In-Class
        Operating                          • Local, in-house expertise and customer care, empowered by centralized strategy and support tools
         Platform
                                           • Platform productivity initiatives to further enhance service efficiency as systems and processes are fine-tuned

                                           • Nearing completion of unified operating platform implementation in all markets to unlock field efficiencies from merger
      Long Runway for
       Further Value                       • Developing initiatives to expand service offerings to residents over time, and to further refine operating model
         Creation
                                           • Recycling capital to enhance portfolio, while simultaneously progressing toward investment grade balance sheet

                                           • Providing an option for consumers wishing to combine single-family living with a professionally managed leasing lifestyle
        Serving our
                                           • Quality of resident service and homes in desirable neighborhoods offer a differentiated value proposition to residents
       Communities
                                           • ~$2B invested in renovation to revitalize communities, support local vendors, and enhance residents’ experience

________________________________________________
(1)     Source: John Burns Real Estate Consulting (JBREC).

                                                                                            4
Strong Start to 2019
Occupancy and rent growth accelerating into 2019
Same Store Average Occupancy
                                                                                          96.4%
                                                                   96.3%
                                              96.0%

                                                                                 95.7%
                   95.6%
                                 95.3%                    95.3%
      95.0%

              Q3                         Q4                  January                February
                          2017   2018                                     2018   2019

Same Store Blended Rental Rate Growth

                                                                                          4.7%
       4.4%
                   4.2%                                            4.3%
                                                                                 4.1%
                                              3.7%
                                 3.5%                     3.4%

              Q3                         Q4                  January                February
                          2017   2018                                     2018   2019

                                                      5
Premier Single-Family Portfolio
Unmatched scale and density in high-growth locations; Recycling capital to enhance portfolio

                                   The IH Way: “Channel Agnostic, Location Specific”
       70%
 of Revenue Generated
  in Western U.S. and             Seattle
     Florida Regions                5%

                                                                                        Minne-
                                                                                        apolis
                                                                                         1%

     ~4,750                Northern                                                              Chicago
   Homes per Market        California                                                              4%
     on Average               7%                          Denver
                                                            3%
                                             Las
                                            Vegas
                             Southern        3%                                                    Nashville             Carolinas
                             California         Phoenix                                              1%                     5%

      >95%                     13%                7%
                                                                         Dallas
                                                                                                               Atlanta
                                                                                                                            Jacksonville
                                                                                                                13%
of Revenue from Markets                                                   3%
                                                                                                                                2%

   with >2,000 Homes                                                          Houston                                    Orlando
                                                                                3%
                                                                                                                           7%
                                                                                                           Tampa
                                                                                                            10%                       South
                                                                                                                                      Florida
       4.5%                                                                                                                            13%

Increase in FY 2018 Same                                     Percent of 4Q18 Core revenues
  Store Core Revenues

                                                               6
Best-in-Class Operating & Asset Management Platform
Innovative ProCare Service Platform drives resident loyalty and operating efficiency

                                   The IH Way: “Eyes on Assets”

                                                      •   Proactive approach to resident care and maintenance

                                                      •   Local resident service and leasing, with centralized
                                                          oversight and revenue management tools

                                                      •   Collaboration between Operations and Investment
                                                          Teams to identify opportunities and drive consistency

                                                      •   Enhancing efficiency through better technology, in-
                                                          house technician utilization, and route optimization

                                                          Trailing Twelve Months Turnover Rate
                                                          (Same Store)
                                                           35.8%
                                                                         35.3%
                                                                                  34.5%
                                                                                              33.8%

                                                                                                         32.7%

                                                           4Q 17         1Q 18    2Q 18       3Q 18      4Q 18

                                                  7
Pursuing Investment Grade Balance Sheet
 Significant enhancement of balance sheet in 2018; Continuing to prioritize deleveraging

Low Cost, Flexible Capital Structure                                 Making Progress Towards Investment Grade

                                                                                                                       12/31/18
   ► No debt maturities until 2021(1)                                                                      12/31/17   Pro Forma(1)

                                                                                                             9.5x

                                                                                                                         8.8x
                                                                        Net Debt to Adjusted EBITDAre
   ► ~90% fixed rate or swapped to fixed rate debt in 2020

                                                                                                                          5.5

   ► Flexible capital stack, mostly prepayable at no cost                                                    4.1
                                                                         Weighted Average Maturity (Yrs)

   ► Significant liquidity with $1.1 billion available through                                                           48%

           revolving lines of credit and unrestricted cash
                                                                         % of Assets Unencumbered            42%

   ► Prioritizing excess cash after dividend for debt                                                        3.4%
                                                                                                                         3.3%
           repayment
                                                                         Weighted Average Cost of Debt
________________________________________________
Note: For additional detail, please see Notes on page 21.

                                                                 8
Seattle
II. COMPELLING INDUSTRY FUNDAMENTALS
9Demographics to Drive Household Formation
JBREC expects 12.5M net households to form over the next 10 years
Significant pent up demand in millennial generation likely to move toward single family rental over the next decade
Current Population by Age Cohort Percentage of 30-Year-Olds Hitting ‘Adult’ Milestones
(millions of people)
Future Delayed milestones = significant future demand
1975 2015
Demand
24
56%
Own a home
23 23.3 33%
Avg. IH
Resident
Age: 40
22 76%
22.1 Live with a child
21.9
47%
21 21.2
21.1
20.9
89%
Have ever married
20 57%
19.6
19 90%
Live on their own
70%
18
15-19 20-24 25-29 30-34 35-39 40-44 45-49
________________________________________________
Source: US Census Bureau and John Burns Real Estate Consulting (JBREC), February 2019.
10Favorable Near-term Demand Trends
Location advantage adds another tailwind to demand for Invitation Homes
Job growth and household formation in Invitation Homes markets significantly exceeds U.S. averages
Projected Employment Growth Projected Household Formations
(Employment Growth, 2019e) (Household Growth, 2019e)
1.5% 1.9%
1.0%
1.0%
(1) (1)
U.S. Average Invitation Homes Markets U.S. Average Invitation Homes Markets
________________________________________________
Source: John Burns Real Estate Consulting (JBREC), February 2019.
Note: For additional detail, please see Notes on page 21.
11Affordability Positions Single-Family Rentals to Take Market Share
Strong household formation + declining home purchase affordability creates ideal SFR conditions
Affordability has become a challenge for potential homebuyers, resulting in declining home purchases
The need for affordable single family housing is even greater in Invitation Homes markets
US New Home Sales (Census Bureau) Weighted Average Burns Affordability Index (1)
(YOY % Change) (Based on relationship between household income and housing
ownership costs; higher index values represent lower affordability)
30%
25% RESI 6.5
20%
Balanced market
15% AMH 6.7 = 5.0
10%
US 7.2
5%
0%
TAH 7.8
-5%
-10% INVH 8.0
-15%
Nov-17 Jan-18 Mar-18 May-18 Jul-18 Sep-18 Nov-18 0 1 2 3 4 5 6 7 8 9
________________________________________________
Source: John Burns Real Estate Consulting (JBREC), February 2019.
Note: For additional detail, please see Notes on page 21.
12Invitation Homes Provides a Solution to Affordability
Renting more affordable than owning in 15 of 17 Invitation Homes markets
Invitation Homes offers high-quality homes in attractive neighborhoods and high-touch resident service, without the
financial commitment of homeownership
Same Store move-outs to homeownership declined 17% year-over-year in FY 2018
Monthly Single-Family Rental Costs Minus Housing Ownership Costs (Home Rentership Discount) (1)
Southern California $(818)
Seattle $(759)
Northern California $(559)
Denver $(398)
Dallas $(388)
Las Vegas Cheaper to Rent $(341)
Than Own
Orlando $(252)
Phoenix $(237)
Nashville $(231)
South Florida $(197)
Atlanta $(126)
Minneapolis $(105)
Jacksonville $(98)
Houston $(59)
Tampa $(53) Cheaper To
Carolinas $5 Own Than Rent
Chicago $121
$(880)
________________________________________________ $(680) $(480) $(280) $(80) $120
Source: John Burns Real Estate Consulting (JBREC), February 2019.
Note: For additional detail, please see Notes on page 21.
13Shortage of Single Family Housing Supply Likely to Continue
Single family home construction remains constrained
Homebuilders cite rising labor costs, materials costs, impact fees, and regulatory hurdles as barriers to new supply
Replacement cost increases for single family housing continue to outpace consumer inflation and household incomes
Total Housing Permits (Single and Multifamily) as a % of Households in Invitation Homes’ Markets
4.0%
Single-Family Multifamily 80-'18 Avg
3.0%
2.0%
1.0%
0.0%
1980 1986 1992 1998 2004 2010 2016
________________________________________________
Source: US Census Bureau and John Burns Real Estate Consulting (JBREC), February 2019.
14Barriers to New Supply are Higher at Lower Price Points
Rising input costs have pushed homebuilders to larger homes at higher price points
Invitation Homes’ portfolio competes primarily at the “starter” and “move-up” home segments of the housing market
– Average purchase price on new acquisitions in 2018 for Invitation Homes was $298k
Nationally, new home sales at sub-$300k price points in 2018 were a record-low 43% of all new home sales, vs. 75% in 2009
Median Price of New Supply Percentage of New Homes Built with < 1,800 Square Ft
$400K 40% 37%
36%
New Home Median Price - INVH Markets 34% 34%
33% 33%
32% 32% 32%
New Home Median Price - United States 31%
$360K (1) 29% 29%
INVH Implied Enterprise Value per Home 30% 28% 28%
24%
$320K 22% 22% 22%
21%
20%
$280K
10%
$240K
$200K 0%
04 05 06 07 08 09 10 11 12 13 14 15 16 17 18 99 00 01 02 03 04 05 06 07 08 09 10 11 12 13 14 15 16 17
________________________________________________
Source: John Burns Real Estate Consulting (JBREC), February 2019.
Note: For additional detail, please see Notes on page 21.
15What If There is a Recession?
Single-family rent growth has historically remained positive even in recessionary periods
A mature, financially stable, and low-turnover resident base could provide cushion in a more challenging economy
Invitation Homes Average Resident Profile
• Age: 40 yrs • Wage Earners per Household: 2 • Household Income: $100k • Income-to-Rent Ratio: 4.7x
Historical Single-Family New Lease Rent Growth(1)
Recession
________________________________________________
Source: John Burns Real Estate Consulting (JBREC), February 2019.
Note: For additional detail, please see Notes on page 21.
16Denver
III. THE INVITATION HOMES WAY – LEVERAGING OUR RESOURCES
TO SERVE COMMUNITIES
17Our Mission, Vision, and Values
Mission
Together with you, we make a house a home.
Vision Values
Unshakeable Integrity Continuous Excellence
We hold ourselves accountable We always find a way to
Be the premier choice in home leasing by to act with honesty, trust and innovate and deliver.
continuously enhancing our residents’ respect.
Standout Citizenship
living experience. Genuine Care We strive to benefit our
We serve with heart. neighbors and our
communities.
18Positive Impact on Residents and Communities
Providing a high quality leasing experience for families and improving communities
Resident Experience Community Investment
“ProCare” professional resident services provided by in- ~$2 billion investment rehabilitating homes to date
house local management and service teams
$289 million local taxes supporting communities in 2018
24/7 resident service hotline
$256 million to maintain homes for residents in 2018
Resident First Look program for home sales
Technology-enhanced resident experience $31 million paid to homeowner associations in 2018
High quality homes in desirable neighborhoods Hundreds of local vendors supported
19Glossary
Adjusted EBITDAre
We define EBITDA as net income or loss computed in accordance with accounting principles generally accepted in the United States (“GAAP”) before the following items: interest expense;
income tax expense; and depreciation and amortization. National Association of Real Estate Investment Trusts ("Nareit") recommends as a best practice that REITs operating as real estate
companies which report an EBITDA performance measure also report EBITDAre in all financial reports for periods beginning after December 31, 2017. We define EBITDAre, consistent with the
Nareit definition, as EBITDA, further adjusted for gain on sale of property, net of tax and impairment on depreciated real estate investments. Adjusted EBITDAre is defined as EBITDAre before
the following items: sharebased compensation expense; IPO related expenses; merger and transaction-related expenses; severance; casualty losses, net; acquisition costs; and interest income
and other miscellaneous income and expenses. EBITDA, EBITDAre and Adjusted EBITDAre are used as supplemental financial performance measures by management and by external users of
our financial statements, such as investors and
commercial banks. Set forth below is additional detail on how management uses EBITDA, EBITDAre and Adjusted EBITDAre as measures of performance. The GAAP measure most directly
comparable to EBITDA, EBITDAre and Adjusted EBITDAre is net income or loss. EBITDA, EBITDAre and Adjusted EBITDAre are not used as measures of our liquidity and should not be considered
alternatives to net income or loss or any other measure of financial performance presented in accordance with GAAP. Our EBITDA, EBITDAre and Adjusted EBITDAre may not be comparable to
the EBITDA, EBITDAre and Adjusted EBITDAre of other companies due to the fact that not all companies use the same definitions of EBITDA, EBITDAre and Adjusted EBITDAre. Accordingly, there
can be no assurance that our basis for computing these non-GAAP measures is comparable with that of other companies.
Average Occupancy
Average occupancy for an identified population of homes represents (i) the total number of days that the homes in such population were occupied during the measurement period, divided by
(ii) the total number of days that the homes in such population were owned during the measurement period.
Core Revenues
Core revenues for an identified population of homes reflects total revenues, net of any resident recoveries and/or bad debt attributable to such population.
Rental Rate Growth
Rental rate growth for any home represents the percentage difference between the monthly rent from an expiring lease and the monthly rent from the next lease, and, in each case, reflects
the impact of any amortized non-service rent concessions and contractual rent increases. Leases are either renewal leases, where our current resident chooses to stay for a subsequent lease
term, or a new lease, where our previous resident moves out and a new resident signs a lease to occupy the same home.
Same Store / Same Store Portfolio
Same Store or Same Store portfolio includes, for a given reporting period, homes that have been stabilized for at least 15 months prior to January 1st of the year in which the Same Store
portfolio was established, excluding homes that have been sold, homes that have been identified for sale to an owner occupant and have become vacant, and homes that have been deemed
inoperable or significantly impaired by casualty loss events or force majeure. Homes are considered stabilized if they have (i) completed an initial renovation and (ii) entered into at least one
post-initial renovation lease. An acquired portfolio that is both leased and deemed to be of sufficiently similar quality and characteristics as the existing Invitation Homes Same Store portfolio
may be considered stabilized at the time of acquisition. Additionally, homes acquired via the Starwood Waypoint Homes merger have been deemed to qualify for the Same Store portfolio
beginning in 2018 if they were stabilized, according to the Invitation Homes criteria for stabilization, within Starwood Waypoint Homes’ portfolio prior to the merger. We believe presenting
information about the portion of our portfolio that has been fully operational for the entirety of a given reporting period and its prior year comparison period provides investors with
meaningful information about the performance of our comparable homes across periods and about trends in our organic business. In order to provide meaningful comparative information
across periods that, in some cases, pre-date the Starwood Waypoint Homes merger, all information regarding the performance of the Same Store portfolio for periods prior to December 31,
2017 is presented as though the Starwood Waypoint Homes merger was consummated on January 1, 2017.
Total Homes / Total Portfolio
Total homes or total portfolio refers to the total number of homes we own, whether or not stabilized, and excludes any properties previously acquired in purchases that have been
subsequently rescinded or vacated.
Turnover Rate
Turnover rate represents the number of instances that homes in an identified population become unoccupied in a given period, divided by the number of homes in such population.
20Notes
Page 8
1) Pro forma the conversion of $230 million of convertible notes maturing in 2019, for which Invitation Homes has announced its intent to settle in common shares.
Page 11
1) Weighted by total homes in each Invitation Homes market, as of December 31, 2018.
Page 12
1) Index ranges from 0 to 10 based on relationship between median household income and annual housing ownership costs. JBREC considers values of 4-6 to be
within the range of normal affordability levels.
Page 13
1) For both ownership and rentership costs, assumes a home that is valued at 80% of the current median-priced existing home in each market. For ownership costs,
includes PITI (30-year fixed rate mortgage with 5% down payment) plus mortgage insurance and maintenance costs. For rental costs, includes rent payment
(based on survey of market asking rents) and renter’s insurance.
Page 15
1) INVH implied enterprise value per home based on February 28, 2019 closing stock price of $23.00 per share.
Page 16
1) Single-family rent is based on Burns Single-Family Rent Index weighted average rollup of 63 markets.
21You can also read