Analysis of a severe air pollution episode in India during Diwali festival - a nationwide approach

Page created by Doris Ortiz
 
CONTINUE READING
Analysis of a severe air pollution episode in India during Diwali festival - a nationwide approach
Atmósfera 32(3), 225-236 (2019)
doi: 10.20937/ATM.2019.32.03.05

                   Analysis of a severe air pollution episode in India during
                           Diwali festival – a nationwide approach

      Nandita D. GANGULY1, Chris G. TZANIS2*, Kostas PHILIPPOPOULOS2 and Despina DELIGIORGI2

1
  Department of Physics, St. Xavier’s College, Ahmedabad-380009, Gujarat, India
2
  Section of Environmental Physics and Meteorology, Department of Physics, National and Kapodistrian University
  of Athens, University Campus, 15784 Athens, Greece
* Corresponding author; email: chtzanis@phys.uoa.gr

                                     Received: December 7, 2017; accepted: June 17, 2019

                                                               RESUMEN
     En años recientes, los episodios de contaminación del aire han sido motivo de gran preocupación a nivel
     mundial, dado el incremento tanto en su frecuencia como en su intensidad. Un episodio particularmente
     alarmante de alta contaminación se observó en algunas partes de la India entre los últimos días de octubre
     y los últimos días de noviembre de 2016. El índice de calidad del aire pasó de deficiente a muy malo en el
     norte y oeste de la India, mientras que fue de satisfactorio a moderado en el sur y el este. En este trabajo se
     analizan las causas de este episodio de alta contaminación. Aparte del efecto Diwali en la contaminación del
     aire, los hallazgos del estudio indicaron la importancia de la quema de biomasa sobre la India.

                                                              ABSTRACT
     Air pollution events have been a subject of major concern worldwide in recent years, since their frequency
     and intensity is increasing with time. An alarmingly high air pollution episode was observed in some parts
     of India during late October to the end of November in the year 2016. The Air Quality Index was observed
     to vary from poor to severe in northern and western parts of India, while it was satisfactory to moderate in
     the east and south of the country. The causes of this observed high pollution episode are examined in this
     paper. Apart from the Diwali effect on air pollution the study findings indicated the importance of biomass
     burning over India.

     Keywords: Air pollution, transport, fireworks, biomass burning, Diwali.

1. Introduction                                                          and Sturman, 2004; Mavrakou et al., 2012; Varotsos
The adverse effects of atmospheric air pollution are                     et al., 2012; Deligiorgi et al., 2013; Amanollahi et
currently well known (Tzanis et al., 2009, 2019; de la                   al., 2013, 2016; Alimissis et al., 2018). Large-scale
Fuente et al., 2011; Ganguly and Tzanis, 2011; Sinha                     airflows interact with mountain and valley winds
et al., 2016; Fallahi et al., 2018). Air pollution occurs                to increase pollutant concentrations (Triantafyllou,
due to a number of factors such as interaction among                     2001; Kitada and Regmi, 2003). Meteorological
local weather patterns, atmospheric circulation fea-                     conditions also influence the chemical and physical
tures, topography, human activities, emissions from                      processes involved in the formation of secondary
vehicles, industries using coal for power, dust from                     pollutants (Nilsson et al., 2001a, b; Tzanis, 2005,
construction activities and long-range transport of                      2009a, b). India is the seventh largest country in the
air pollutants (Rappengluck et al., 1999; Kossmann                       world spanning between 8º 4’-37º 6’ N and 68º 7’-97º

                           © 2019 Universidad Nacional Autónoma de México, Centro de Ciencias de la Atmósfera.
                 This is an open access article under the CC BY-NC License (http://creativecommons.org/licenses/by-nc/4.0/).
Analysis of a severe air pollution episode in India during Diwali festival - a nationwide approach
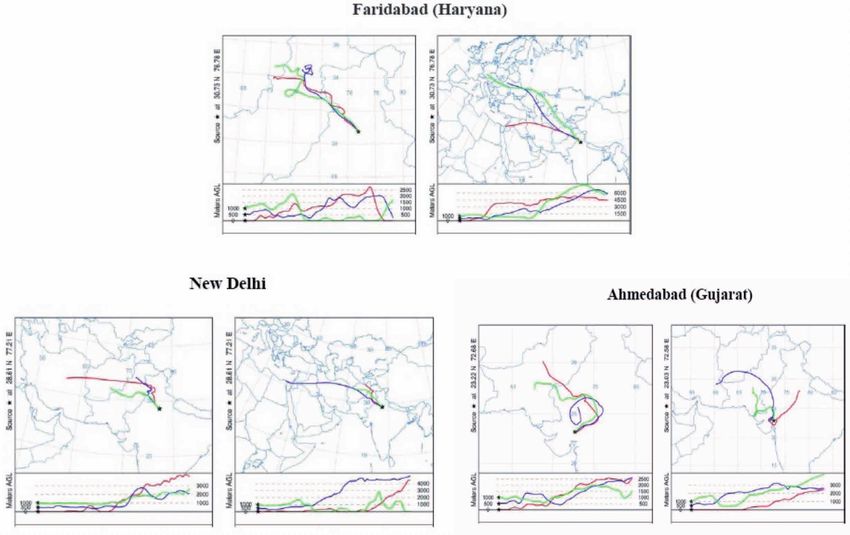
226                                             N. D. Ganguly et al.

25’ E. It is also the world’s second largest populated        time frames (pre and during the Diwali festival).
nation. Primary sources of air pollution in India in-       • Association of air pollution levels and health
clude industries, power plants, biomass burning and           impacts using indices (i.e., the Air Quality Index
vehicular transport. The growth in urban population           [AQI] – Table I).
and extensive development activities have further           • Analysis of the effects of principal factors that
added to the increased levels of air pollution. The lack      determine air pollution dispersion conditions,
of an efficient public transport system in most cities        focusing on the effect of synoptic scale and local
and growing travel demands have fuelled the growth            meteorological conditions.
of private vehicles, thereby increasing pollutants con-     • Assessment of the effect of additional air pollution
centrations. Particulate matter and NOx are the major         sources. In the case of India during the Diwali
pollutants that have been reported (Mahtta, 2015).            festival the effect of uncontrolled combustion and
An alarming increase in air pollution was observed            long-range air pollution transport is evaluated.
in India during late October to the end of November
in the year 2016. As the frequency and intensity of         2.2. Area of study and data
similar pollution events has increased in the recent        The case study is based on a nation-wide analysis of
years, the causes for this observed high pollution          air pollution concentration levels due to the signifi-
event are examined.                                         cant effect of the Diwali festival in every part of the
    A possible cause of these high pollution levels         country (Fig. 1).
could be the ignition of fireworks during the Diwali
festival, which was celebrated on October 30, 2016                     40
(Attri et al., 2001; Kulshrestha et al., 2004; Ganguly,
2009; Deka and Hoque, 2014; Saha et al., 2014;
                                                                       35
Ganguly, 2015). Another possible cause of the high
pollution levels could be the burning of stubble in
                                                                       30
paddy fields in the states of Punjab, Haryana and                                     New Delhi
                                                                                                  ** Faridabad
Uttar Pradesh during the months of October and                                          Jaipur*           *
November (Mittal et al., 2009) to prepare the field                    25

for the next crop. It is an uncontrolled combustion                         Ahmedabad *
                                                            Latitude

                                                                                                                    *
                                                                                                                    Kolkota
process during which several tones of CO2, NOx,                        20
CH4, CO, NH3, NMHC, SO2 and particulate matter                                                               *Vishakapatnam
are emitted (Streets et al., 2003; Gadde et al., 2009;                 15
Sahai et al., 2011; Jain et al., 2014). Finally, the high                             Bangalore *      * Chennai
levels of pollution could also be due to long-distance                 10
transport of various air pollutants. The predominant
cause for the observed pollution in different cities of                 5
India is examined in this study.                                         65      70        75         80      85        90    95   100
                                                                                                      Longitude

                                                            Fig. 1. India map and sites location.
2. Methods
2.1. Methodology
The unique characteristics of the Diwali festival and           The selected sites are presented in Table II along
its effects on air pollution levels over India require      with the availability of air pollutant concentrations
a nation-wide approach according to the following           and wind speed data. In more detail, mean daily
steps:                                                      particulate matter (PM2.5), sulfur dioxide (SO2),
                                                            ozone (O3), nitrogen oxides (NOx), benzene (C6H6)
• Analysis of air pollution concentration levels for        concentrations and wind speed and direction data are
  multiple air pollutants, using a representative air       extracted from the database of the Indian Central Pol-
  quality network in a countrywide level for two            lution Control Board (CPCB). According to the na-
Analysis of a severe air pollution episode in India during Diwali festival - a nationwide approach
Air pollution in India during Diwali                                    227

Table I. Air Quality Index categories and associated health impacts.

AQI                          Health impacts.
Good            0-50         Minimal impact.
Satisfactory    51-100       May cause minor breathing discomfort to sensitive people.
Moderately      101-200      May cause breathing discomfort to people with lung disease such as asthma, and
polluted                     discomfort to people with heart disease, children and older adults.
Poor            201-300      May cause breathing discomfort to people on prolonged exposure, and discomfort to
                             people with heart disease.
Ver poor        301-400      May cause respiratory illness to the people on prolonged exposure. Effect may be more
                             pronounced in people with lung and heart diseases.
Severe          401-500      May cause respiratory effects even on healthy people and serious health impacts on
                             people with lung/heart diseases. The health impacts may be experienced even during
                             light physical activity.

tional ambient air quality standards, the permissible        ing has been visualized from EOSDIS Worldview
levels for NOx and SO2 concentrations are 80 µg m–3          (https://earthdata.nasa.gov/labs/worldview).
for a 24-h average; 60 µg m–3 for PM2.5, 100 µg m–3
for O3, and 2 µg m–3 of CO for an 8-h average; and
5 µg m–3 for C6H6 in an annual average.                      3. Results
    Additionally to the above-mentioned ambient              3.1. Air quality assessment
air pollutant concentrations, the daily AQI is also          The AQI time series for the period under study and
extracted from the CPCB database. The AQI in India           the selected sites over India are presented in figure 2.
is developed to inform the public about the exposure         The overall air quality conditions over Faridabad,
risk to air pollution and to help authorities to adopt       New Delhi and Lucknow range from very poor to
effective air pollution control measures. The AQI            severe (greater than 300 and 400, respectively) for
system considers eight pollutants (PM10, PM2.5, NO2,         significant number of days with important health
SO2, CO, O3, NH3, and Pb), calculates a sub-index            implications even on healthy people. The conditions
for one of them and the overall AQI corresponds to           at Jaipur and Ahmedabad are considered poor or
the maximum value of the individual sub-indices.             very poor for a small fraction of days whereas for
The proposed AQI index, based on the dose-response           the remaining sites (Kolkata, Chennai, Bangalore
relationships for each pollutant, has six categories         and Vishakapatnam) the conditions are considered
ranging from good to severe that relate to specific          healthier with very few days exceeding the 200 and
health impacts (Akolkar, 2014).                              300 limits. It should be noted that the higher AQI
    The effect of synoptic conditions is examined in         values are associated with the sites located at the
terms of mean sea level pressure (MSLP), and the re-         northern and western parts of India (Faridabad, New
sulting wind field at 10 m is obtained from the NCEP/        Delhi, Lucknow, Jaipur and Ahmedabad) and lower
NCAR Reanalysis I (Kalnay et al., 1996), whereas             at the southern and eastern parts (Kolkata, Chennai,
local wind conditions are extracted from the Indian          Vishakapatnam and Bangalore).
Environment Network. The 5-day back trajectories                 Regarding the mean daily PM2.5, SO2, O3, CO,
at different altitudes have been retrieved from the          NOX and C6H6 concentrations for a normal day
HYSPLIT model of NOAA Air Resources Laboratory               prior and post the Diwali festival (October 24 and
(Stein et al., 2015) based on Global Forecast System         November 5, 2016) and for the Diwali day (October
(GFS) meteorological data, while biomass burn-               30, 2016), in Table III it is observed that in most cases
Analysis of a severe air pollution episode in India during Diwali festival - a nationwide approach
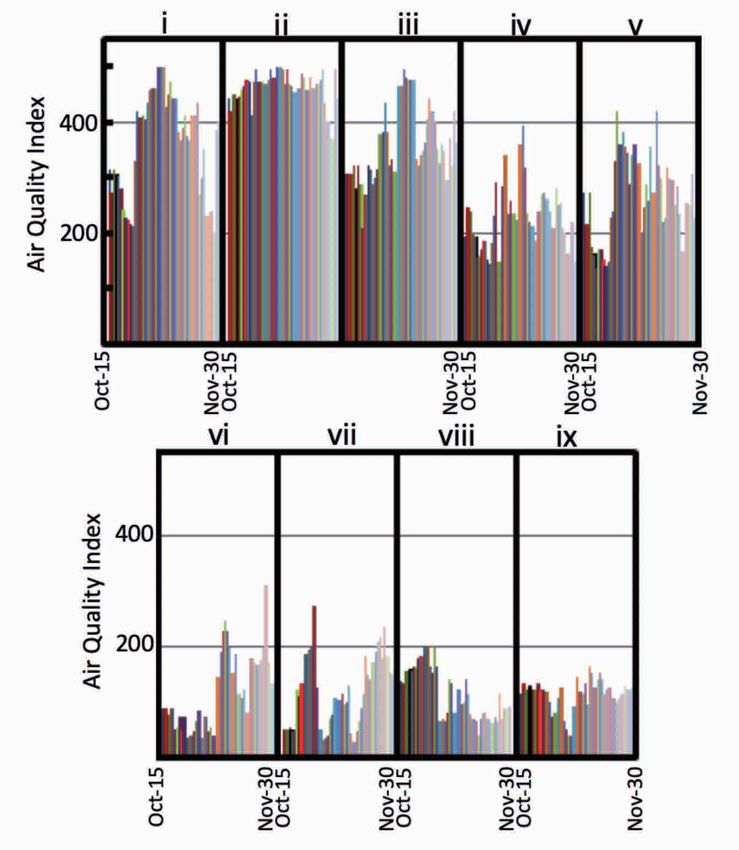
228                                                                                                            N. D. Ganguly et al.

                                                i                ii             iii             iv              v                      Figure 3 shows the time series of air pollutant con-
                                                                                                                                   centrations for the selected sites. A general remark is
                                                                                                                                   that, instead of subsiding after the Diwali festivities,
Air quality index

                    400
                                                                                                                                   pollution levels remained high from several days to
                                                                                                                                   about a month. In more detail, PM2.5 concentrations
                                                                                                                                   maxima are observed at the Ahmedabad site during
                    200
                                                                                                                                   the Diwali day (1056 µg m–3) and on November 14
                                                                                                                                   and 23 (1183 and 883 µg m–3, respectively). High
                                                                                                                                   PM2.5 concentrations are also observed at the Farid-
                                                                                                                                   abad, New Delhi and Jaipur sites from October 27
                        Oct-15

                                                     Nov-30
                                                     Oct-15

                                                                                      Nov-30
                                                                                      Oct-15

                                                                                                       Nov-30
                                                                                                       Oct-15

                                                                                                                          Nov-30
                                                                                                                                   to mid-November. The PM2.5 pollution levels at the
                                                                                                                                   Vishakapatnam and Bangalore sites are considered
                                                      vi               vii             viii             ix
                                                                                                                                   normal with maximum values not exceeding 80 µg m–3
                                                                                                                                   during the entire period of study. Regarding SO2
                                                                                                                                   concentration levels, the maximum values are also re-
                      Air quality index

                                          400
                                                                                                                                   ported at the Faridabad site prior and after the Diwali
                                                                                                                                   festival and at the New Delhi site from October 29-31.
                                          200                                                                                      High levels of O3 concentrations are observed only at
                                                                                                                                   the Ahmedabad site from the Diwali day to November
                                                                                                                                   22, while its maximum value (235 µg m–3) is observed
                                                                                                                                   on November 15. For the remaining sites, concentra-
                                            Oct-15

                                                              Nov-30
                                                              Oct-15

                                                                             Nov-30
                                                                             Oct-15

                                                                                              Nov-30
                                                                                              Oct-15

                                                                                                                 Nov-30

                                                                                                                                   tion levels were below the 100 µg m–3 permissible
                                                                                                                                   level during the majority of days. Maximum CO
 Fig. 2. Air Quality Index for the selected sites and period                                                                       concentrations were observed at Jaipur (8.39 µg m–3)
 of study for Faridabad (i), New Delhi (ii), Lucknow (iii),                                                                        on the October 29, whereas high pollution levels were
 Jaipuir (iv), Ahmedabad (v), Kolkota (vi), Chennai (vii),                                                                         observed in New Delhi throughout the study period.
 Bangalore (viii) and Vishakapatnam (ix).
                                                                                                                                   Furthermore, high CO concentrations were report-
                                                                                                                                   ed on October 17 and 19 at the Kolkata site (6.24
 for the Faridabad, New Delhi, Lucknow, Jaipur and                                                                                 and 8.06 µg m–3, respectively) from October 25 to
 Ahmedabad sites the concentrations during the Di-                                                                                 November 23 at Ahmedabad, between October 17
 wali day increased compared to normal days before                                                                                 to November 30 at Faridabad, and about November
 and after Diwali. On the contrary, for the rest of the                                                                            15 at Lucknow. For the remaining sites (Chennai,
 sites either minor increases or even decreases in air                                                                             Vishakapatnam and Bangalore), CO concentrations
 pollutant concentrations are observed.                                                                                            were below the 2 µg m–3 level. The NOX pollution

                                             Table II. Air monitoring stations and availability of air quality and wind data.

                                             City                              State                                      PM2.5       SO2    O3    CO     NOX     C6H6     WS
                                             Faridabad                         Haryana                                       ✓        ✓      ✓      ✓      ✓        ✓      ✓
                                             New Delhi                         Delhi                                         ✓        ✓      ✓      ✓      ✓        ✓      ✓
                                             Lucknow                           Uttar Pradesh                                 ✓        ✓      ✓      ✓      ✓        ✓      ✓
                                             Jaipur                            Rajasthan                                     ✓        ✓      ✓      ✓      ✓        ✓      ✓
                                             Ahmedabad                         Gujarat                                       ✓        ✓      ✓      ✓      ✓        ✓      ✓
                                             Kolkata                           West Bengal                                   ✗        ✗      ✓      ✓      ✓        ✗      ✗
                                             Chennai                           Tamilnadu                                     ✓        ✓      ✓      ✓      ✓        ✓      ✗
                                             Bangalore                         Karnataka                                     ✓        ✓      ✓      ✓      ✓        ✓      ✗
                                             Vishakapatnam                     Andhra Pradesh                                ✓        ✓      ✓      ✓      ✓        ✓      ✗
Analysis of a severe air pollution episode in India during Diwali festival - a nationwide approach
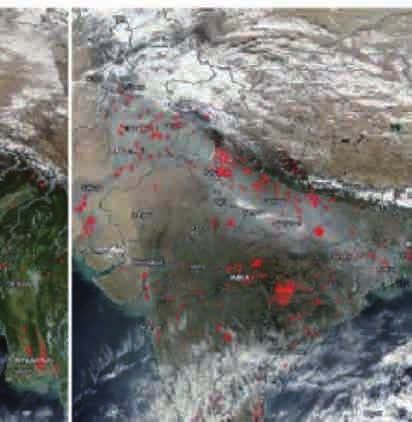
Air pollution in India during Diwali                                                          229

            1200                                                                                  160
                                                                                                  140
            1000
                                                                                                  120
 PM2.5 (μg/m3)

                 800

                                                                                   SO2 (μg/m3)
                                                                                                  100

                 600                                                                               80

                                                                                                   60
                 400
                                                                                                   40
                 200
                                                                                                   20

                       Oct   Oct   Oct     Oct   Nov   Nov    Nov      Nov   Nov                       Oct   Oct    Oct   Oct      Nov   Nov   Nov   Nov   Nov
                       15    20    24      30     5     11    17       23    30                        15    20     24    30        5     11   17    23    30
                 250                                                                               9
                                                                                                   8
                 200
                                                                                                   7
                                                                                                   6

                                                                                   CO (mg/m3)
 O3 (μg/m3)

                 150
                                                                                                   5
                                                                                                   4
                 100
                                                                                                   3

                  50                                                                               2

                                                                                                   1

                       Oct   Oct   Oct     Oct   Nov   Nov    Nov      Nov   Nov                       Oct   Oct    Oct   Oct      Nov   Nov   Nov   Nov   Nov
                       15    20    24      30     5     11    17       23    30                        15    20     24    30        5     11   17    23    30
                 800                                                                              50
                 700
                                                                                                  40
                 600
                                                                                   C6H6 (μg/m3)
 NOx (μg/m3)

                 500                                                                              30
                 400
                                                                                                  20
                 300

                 200
                                                                                                  10
                 100

                       Oct   Oct   Oct     Oct   Nov   Nov    Nov      Nov   Nov                       Oct   Oct    Oct   Oct      Nov   Nov   Nov   Nov   Nov
                       15    20    24      30     5     11    17       23    30                        15    20     24    30        5     11   17    23    30

                               Faridabad               New Delhi               Lucknow                                    Jaipur               Ahmedabad

                               Kolkata                       Chennai                                    Bangalore                          Vishakapatnam

 Fig. 3. Time series of air pollutant concentrations from October 15 to November 30, 2016 (pre-Diwali [October
 24], Diwali [October 30] and post-Diwali [November 5]).

levels exhibit significant differences between the                                  18. NOX concentrations were below the 80 µg m–3
New Delhi site and the remaining stations. Between                                  level at the Jaipur, Chennai and Bangalore sites. Re-
October 15 to November 13, NOX values ranged                                        garding C6H6 concentrations, the highest pollution
from 302 to 773 µg m–3. High NOX concentrations                                     levels were observed at the Ahmedabad site between
were also observed on November 9 and between                                        October 18 and November 30, with a maximum value
November 16 to 21 at Ahmedabad; in the Kolkata                                      of 46 µg m–3. Days with higher than 100 µg m–3 were
site, an increasing trend is observed after November                                also observed at the Faridabad, Lucknow, New Delhi
Analysis of a severe air pollution episode in India during Diwali festival - a nationwide approach
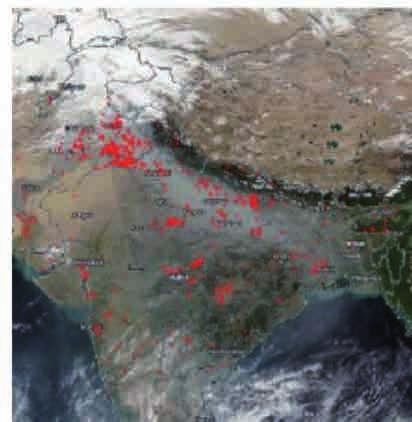
230                                               N. D. Ganguly et al.

and Vishakapatnam sites, which may be attributed to           active fires (marked with red dots) associated with
emissions from vehicles and from coal combustion              the burning of agricultural crop residues over Punjab,
industries for power generation (Mahtta, 2015).               Haryana, Uttar Pradesh and New Delhi in north In-
    The above findings indicate that firework emis-           dia, as well as the scattered occurrence of fires over
sions during the Diwali festival are not the primary          Rajasthan and Gujarat in west India, and West Ben-
cause of pollution, but they might have added to              gal in east India are easily identified, validating the
already existing polluting sources. It should be not-         importance of biomass burning emissions. The AQI
ed that, compared to previous years, in 2016 fewer            results are consistent with findings of the biomass
firecrackers were ignited due to a government ban             burning fire events, highlighting their importance
on firecrackers to control noise and air pollution.           in the increased levels of pollution over specific
There was no increase in sound levels, but the levels         areas of India. Other studies have also identified the
of atmospheric pollutants (CO, NOx, O3, C6H6, SO2             effect of crop residues burning fires in north India
and PM2.5) increased significantly in the states of           during October and November (Mittal et al., 2009).
Haryana, Uttar Pradesh and Delhi (in northern India),         This indicates that the high levels of CO, NOX, SO2
and at Rajasthan and Gujarat (in western India).              and particulate matter can also be attributed to the
    Under this assumption, the effect of emissions            burning of agriculture crop residues, in addition to
from biomass burning is also examined. The fire               the Diwali festival and other local sources such as
events during October and November are evident                vehicle emissions, coal burning power generation,
in the EOSDIS Worldview images (Fig. 4). Intense              and dust emissions from construction activities.

            15 Oct 2016                     20 Oct 2016
                                                                                                      14 Nov 2016
                                                                         5 Nov 2016

              25 Oct 2016                     30 Oct 2016
                                                                          22 Nov 2016             30 Nov 2016

Fig. 4. Intense active fires (marked with red dots) associated with the burning of agricultural crop residues over Punjab,
Haryana, Uttar Pradesh and New Delhi in north India, as well as scattered occurrence of fires over Rajasthan, Gujarat
in west India, and West Bengal in east India, during October-November 2016.
Analysis of a severe air pollution episode in India during Diwali festival - a nationwide approach
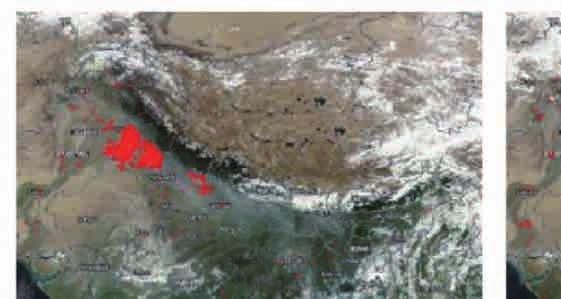
Air pollution in India during Diwali                                                          231

3.2. Meteorological conditions and long- range                             resentative normal days prior and after the festival (a
transport of air pollution                                                 normal day is a day where pollutant concentrations
The synoptic conditions and the resulting surface                          have the same air pollution levels as the average of
wind field are considered the most important factor                        a 10-day period prior and after the Diwali day). As it
in the conditions for air pollution dispersion. The                        can be observed, unfavorable dispersion conditions
daily MSLP, along with the wind field over India are                       prevail over India during the Diwali festival, as a
examined for the entire period of study and visualized                     result of a smooth pressure field. Higher wind speed
in figure 5 during the Diwali festival and for two rep-                    values are only observed at the southern part of the

                    Oct-24-2016                                       Oct-30-2016                                   Nov-5-2016
          39N           NOAA/ESRL Physical Sciences   39N               NOAA/ESRL Physical Sciences   39N             NOAA/ESRL Physical Sciences
                        Division                                        Division                                      Division

          33N                                         33N                                             33N

          27N                                         27N                                             27N
   MSLP

          21N                                         21N                                             21N

          15N                                         15N                                             15N

          9N                                           9N                                             9N

            60E   70E   80E        90E       100E       60E     70E     80E        90E       100E       60E   70E     80E        90E       100E

          39N           NOAA/ESRL Physical Sciences   39N               NOAA/ESRL Physical Sciences   39N             NOAA/ESRL Physical Sciences
                        Division                                        Division                                      Division

          33N                                         33N                                             33N

          27N                                         27N                                             27N
   u

          21N                                         21N                                             21N

          15N                                         15N                                             15N

          9N                                           9N                                             9N

            60E   70E   80E        90E       100E       60E     70E     80E        90E       100E       60E   70E     80E        90E       100E

          39N           NOAA/ESRL Physical Sciences   39N               NOAA/ESRL Physical Sciences   39N             NOAA/ESRL Physical Sciences
                        Division                                        Division                                      Division

          33N                                         33N                                             33N

          27N                                         27N                                             27N
   v

          21N                                         21N                                             21N

          15N                                         15N                                             15N

          9N                                           9N                                             9N

            60E   70E   80E        90E       100E       60E     70E     80E        90E       100E       60E   70E     80E        90E       100E

   Fig. 5. Synoptic conditions and associated wind field in terms of MSLP, u and v wind components at 10 m over
   India during the Diwali festival (October 30, 2016), and before and after Diwali (October 24 and November
   5, 2016, respectively).
Analysis of a severe air pollution episode in India during Diwali festival - a nationwide approach
232                                                         N. D. Ganguly et al.

                  4.5

                   4

                  3.5

                   3
       WS (m/s)

                  2.5

                   2

                  1.5

                   1

                  0.5

                   0
                    Oct-15   Oct-20     Oct-24     Oct-30         Nov-5         Nov-11      Nov-17     Nov-23       Nov-30
                                      pre-Diwali   Diwali

                                  Faridabad        New Delhi          Lucknow            Jaipur      Ahmedabad

       Fig. 6. Wind time series for New Delhi, Jaipur, Ahmedabad, and Chennai sites during the study period.

Indian peninsula with an easterly direction. During                       are transported to the urban regions of Hyderabad
normal days, a low-pressure center is located at the                      and the Arabian Sea.
Bengal Bay leading to better dispersion conditions
at the southern and eastern parts of India, and to
stagnation of pollutants and higher resulting pollution                   4. Conclusions
levels at the northern and eastern parts.                                 The predominant cause for the sudden degradation
    Wind time series for the New Delhi, Jaipur,                           of ambient air quality in the year 2016 at Faridabad
Ahmedabad, and Chennai sites are presented in                             and Lucknow was biomass burning emissions in
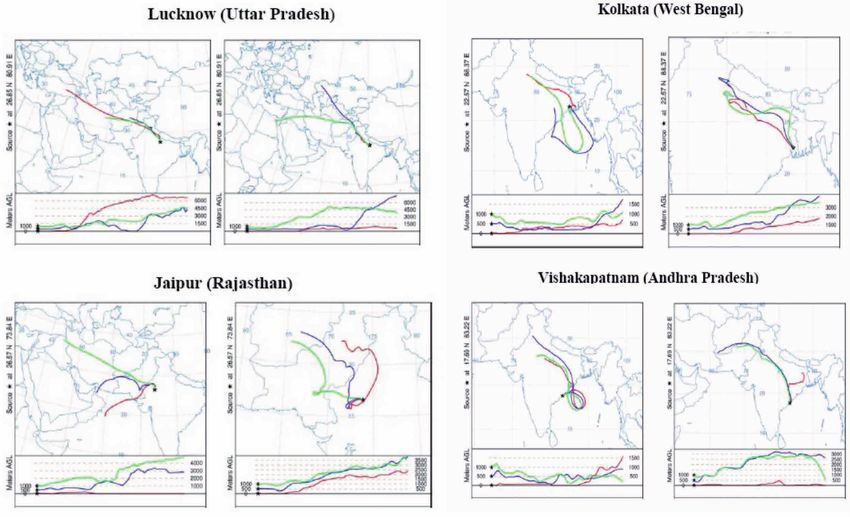
figure 6. Figure 7 presents the NOAA HYSPLIT                              Uttar Pradesh, Punjab and Haryana. Long range
derived five-day back trajectories ending at the                          transport of this polluted air led to the deterioration
Indian cities of Faridabad, New Delhi, Lucknow,                           of air quality in Ahmedabad, New Delhi, Jaipur and
Jaipur, Ahmedabad, Kolkata and Vishakapatnam at                           Kolkata (with approximately 35 million inhabitants).
three altitudes (0, 500 and 1000 m) at 12:00 UTC on                       Ignition of fireworks, emissions from vehicles, indus-
October 27 and November 7, 2016. The back trajec-                         tries using coal for power and dust from construction
tories indicate transport from the north, north-west                      activities have further added to the existing pollution.
and west at Faridabad, New Delhi, Lucknow, Jaipur,                        Low wind speed at Ahmedabad and New Delhi
Ahmedabad, Kolkata and Vishakapatnam during the                           might have caused lower dispersive capacity in the
study period at three altitudes. Low wind speed values                    atmosphere, leading to stagnation of these pollutants.
are denoted for each experimental site. The above                         Future work will be focused on numerical modeling
findings are also in accordance with the assumption                       for supporting the observational findings.
that high pollution levels of AQI, CO, NOX, SO2 and
PM over northern, western and eastern India may be
attributed to the transport of polluted air associated                    Acknowledgments
with the burning of agriculture crop residues in the                      The Air Quality Index, concentration of gaseous
states of Punjab, Haryana and Uttar Pradesh. Badar-                       pollutants and meteorological parameters for Indian
inath et al. (2009a, b) also present similar findings.                    cities was obtained from the website of the Central
These authors state that aerosols/trace gases from                        Pollution Control Board (CPCB). The 5-day back
regions where agriculture crop residues are burnt,                        trajectories at different altitudes have been retrieved
Analysis of a severe air pollution episode in India during Diwali festival - a nationwide approach
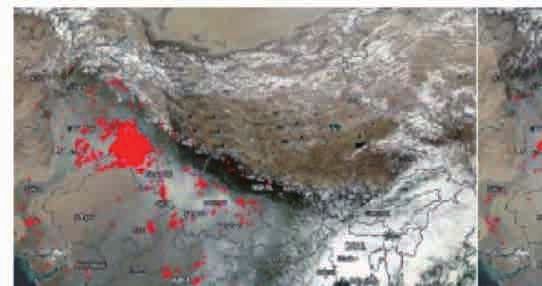
Air pollution in India during Diwali                                                                                                                         233

                                                                                                                         Faridabad (Haryana)

                                                            at 30.73 N 76.78 E

                                                                                                                                          at 30.73 N 76.78 E
                                                            Source

                                                                                                                                          Source
                                                            Meters AGL

                                                                                                                                          Meters AGL
                                                                                                                               2500
                                                                                                                                                                                                                       6000
                                                                                                                               2000
                                                                                                                               1500                                                                                    4500
                                                                                            1000                               1000                                                                                    3000
                                                                                             500                               500                             1000                                                    1500
                                                                                              0                                                                  0

                                                 New Delhi                                                                                                                                                           Ahmedabad (Gujarat)
             at 30.73 N 76.78 E

                                                                                      at 30.73 N 76.78 E

                                                                                                                                                                                                                                      at 30.73 N 76.78 E
                                                                                                                                                                                   at 30.73 N 76.78 E
             Source

                                                                                      Source

                                                                                                                                                                                                                                      Source
                                                                                                                                                                                   Source
              Meters AGL

                                                                                       Meters AGL

                                                                                                                                                                                                                                      Meters AGL
                                                                                                                                                                                   Meters AGL                                  2500
                                                  3000                                                                                 4000                                                                                    2000                                           3000
                                                                                                                                       3000                                                                                    1500
                                                  2000                                                                                                                                                                                                                        2000
                                                                                                                                       2000                                                              1000                  1000
                                    1000          1000                                                     1000                        1000                                                               500                  500                              1000          1000
                                     500                                                                    500                                                                                            0                                                     500
                                      0                                                                      0                                                                                                                                                    0

                                           Lucknow (Uttar Pradesh)                                                                                                                                                   Kolkata (West Bengal)
at 30.73 N 76.78 E

                                                         at 30.73 N 76.78 E

                                                                                                                                                                      at 30.73 N 76.78 E

                                                                                                                                                                                                                                      at 30.73 N 76.78 E
Source

                                                         Source

                                                                                                                                                                      Source

                                                                                                                                                                                                                                      Source
Meters AGL

                                                         Meters AGL

                                                                                                                                                                       Meters AGL

                                                                                                                                                                                                                                      Meters AGL

                                                 6000                                                                           6000                                                                                          1500
                                                 4500                                                                           4500                                                                                                                                          3000
                                                 3000                                                                           3000                                                               1000                       1000
                                                                                                                                                                                                                                                                              2000
                                                 1500                                                                           1500                                                                    500                   500                                    1000     1000
                                  1000                                                    1000
                                    0                                                       0                                                                                                                                                                         500
                                                                                                                                                                                                         0                                                             0

                                            Jaipur (Rajasthan)                                                                                                                                                  Vishakapatnam (Andhra Pradesh)
at 30.73 N 76.78 E

                                                                                 at 30.73 N 76.78 E

                                                                                                                                                                      at 30.73 N 76.78 E

                                                                                                                                                                                                                                                at 30.73 N 76.78 E
Source

                                                                                 Source

                                                                                                                                                                      Source

                                                                                                                                                                                                                                                Source
Meters AGL

                                                                                 Meters AGL

                                                                                                                                                                      Meters AGL

                                                                                                                                                                                                                                                 Meters AGL

                                                                                                                                                                                                                                                                                3500
                                                                                                                                      3500                                                                                    1500                                              2500
                                                4000                                                                                  3000                                                                                                                                      2000
                                                                                                                                                                                                   1000                       1000
                                                3000                                                                                  2500                                                                                                                                      1500
                                                                                                                                      2000                                                              500                   500                                      1000     1000
                                                2000                                                                                  1500                                                                                                                              500     500
                                  1000          1000                                                       1000                       1000                                                               0                                                               0
                                   500                                                                      500                       500
                                    0                                                                        0

Fig. 7. NOAA HYSPLIT derived 5-day back trajectories ending at Indian cities Faridabad (Haryana), New Delhi and
Lucknow (Uttar Pradesh), Jaipur (Rajasthan), Ahmedabad (Gujarat), Kolkata (West Bengal), and Vishakapatnam (Andhra
Pradesh) at three altitudes (0, 500 and 1000 m) at 12:00 UTC on October 27 and November 7, 2016.
Analysis of a severe air pollution episode in India during Diwali festival - a nationwide approach
234                                                 N. D. Ganguly et al.

      Table III. Comparison of normal days pre and post-Diwali to Diwali day air pollutant concentrations.

                                             PM2.5         SO2             O3         CO          NOX          C6H6
      Faridabad           Pre-Diwali       326.05         12.38         16.02        2.88        68.05        11.84
                          Diwali           338.86         52.34         40.91        2.35        96.21        16.38
                          Post-Diwali      915.15         38.28         33.31        4          101.66        18.26
      New Delhi           Pre-Diwali       209.37         20.51         23.13        3.38       372.42          1.63
                          Diwali           350.21         46.97         77.07        4.25       361.11          2.42
                          Post-Diwali      783.31         23.36         39.8         5.52       627.72          7.86
      Lucknow             Pre-Diwali       149.18          8.21         45           0.43        46.78          0.19
                          Diwali           270.39          9.6          34.16        0.28        48.25          1.51
                          Post-Diwali      248.27          4.7          45.65        0.31        74.82          3.1
      Jaipur              Pre-Diwali        71.42         12.09         31.77        1.63         5.39          7.1
                          Diwali           185.56         16.95         23.86        2.6         25.48          2.95
                          Post-Diwali       39.77         15.65         11.66        1.37        62.83          2.07
      Ahmedabad           Pre-Diwali        74.22        115.96         86.66        1.13        15.7          7
                          Diwali          1055.72         66.88         87.76        4.24        44.49        24.67
                          Post-Diwali      260.27         68.01         92.1         5.82        55.28        30.48
      Kolkata             Pre-Diwali          NA           NA            11.64       0.93        80.02          NA
                          Diwali              NA           NA             5.38       1.12        45.74          NA
                          Post-Diwali         NA           NA             2.7        NA          28.48          NA
      Chennai             Pre-Diwali        56.71          2.21         42.59        0.49        17.77          NA
                          Diwali            30.7           7.08         21.42        0.7          5.54          NA
                          Post-Diwali       46.61          2.36         27.45        0.47        25.71          NA
      Bangalore           Pre-Diwali        46.77          2.37         34.72        0.81        11.12          NA
                          Diwali            52.35          9.1          19.08        1.56         6.07          NA
                          Post-Diwali       41.17          3.07         38.58        1.54        15.64          NA
      Vishakapatnam       Pre-Diwali        63.19         32.65         58.71        1.54        77.2           9.85
                          Diwali            45.56         15.19         46.06        0.77        57.94          3.65
                          Post-Diwali       19.17          8.71         31.98        0.75        75.46          3.08

      Values in bold type: lower Diwali day air pollutant concentrations; NA: not available data.

from the HYSPLIT transport and dispersion model                    Environment 191:205-213.
of NOAA Air Resources Laboratory (ARL). Biomass                    DOI: 10.1016/j.atmosenv.2018.07.058
burning has been visualized from NASA EOSDIS                     Amanollahi J, Tzanis C, Abdullah AM, Ramli MF, Pi-
Worldview.                                                         rasteh S. 2013. Development of the models to estimate
                                                                   particulate matter from thermal infrared band of
                                                                   Landsat Enhanced Thematic Mapper. International
References                                                         Journal of Environmental Science and Technology
Akolkar AB. 2014. National Air Quality Index. Central              10:1245-1254.
   Pollution Control Board, Ministry of Environment,               DOI: 10.1007/s13762-012-0150-7
   Forests and Climate Change, India.                            Amanollahi J, Tzanis C, Ramli MF, Abdullah AM. 2016.
Alimissis A, Philippopoulos K, Tzanis CG, Deligiorgi D.            Urban heat evolution in a tropical area utilizing Landsat
   2018. Spatial estimation of urban air pollution with the        imagery. Atmospheric Research 167:175-182.
   use of artificial neural network models. Atmospheric            DOI: 10.1016/j.atmosres.2015.07.019
Air pollution in India during Diwali                                     235

Attri AK, Kumar U, Jain VK. 2001. Formation of ozone by       Jain N, Bhatia A, Pathak H. 2014. Emission of air pollut-
   fireworks. Nature 411:1015. DOI: 10.1038/35082634              ants from crop residue burning in India. Aerosol and
Badarinath KVS, Kumar KS, Sharma AR. 2009a. Long-                 Air Quality Research 14:422-430.
   range transport of aerosols from agriculture crop              DOI: 10.4209/aaqr.2013.01.0031
   residue burning in Indo-Gangetic Plains – A study          Kalnay E, Kanamitsu M, Kistler R, Collins W, Deaven D,
   using LIDAR, ground measurements and satellite data.           Gandin L, Iredell M, Saha S, White G, Woollen J, Zhu
   Journal of Atmospheric and Solar-Terrestrial Physics           Y, Chelliah M, Ebisuzaki W, Higgins W, Janowiak J,
   71:112-120. DOI: 10.1016/j.jastp.2008.09.035                   Mo KC, Ropelewski C, Wang J, Leetmaa A, Reynolds
Badarinath KVS, Kharol SK, Sharma AR, Krishna PV.                 R, Jenne R, Joseph D 1996. The NCEP/NCAR 40-year
   2009b. Analysis of aerosol and carbon monoxide                 reanalysis project. Bulletin of the American Meteoro-
   characteristics over Arabian Sea during crop residue           logical Society 77:437-471.
   burning period in the Indo-Gangetic Plains using               DOI: 10.1175/1520-0477(1996)077%3C0437:T-
   multi-satellite remote sensing datasets. Journal of            NYRP%3E2.0.CO;2
   Atmospheric and Solar-Terrestrial Physics 71:1267-         Kitada T, Regmi RP. 2003. Dynamics of air pollution trans-
   1276. DOI: 10.1016/j.jastp.2009.04.004                         port in late wintertime over Kathmandu valley, Nepal,
De la Fuente D, Vega JM, Viejo F, Díaz I, Morcillo M.             as revealed with numerical simulation. Journal of
   2011. City scale assessment model for air pollution ef-        Applied Meteorology and Climatology 12:1770-1798.
   fects on the cultural heritage. Atmospheric Environment        DOI: 10.1175/1520-0450(2003)042%3C1770:DOAP-
   45:1242-1250. DOI: 10.1016/j.atmosenv.2010.12.011              TI%3E2.0.CO;2
Deligiorgi, D, Philippopoulos K, Karvounis G. 2013.           Kossmann M, Sturman A. 2004. The surface wind field
   Estimation of pollution dispersion patterns of a power         during winter smog nights in Christchurch and coastal
   plant plume in complex terrain. Global NEST Journal            Canterbury, New Zealand. International Journal of
   15:227-240. DOI: 10.30955/gnj.000955                           Climatology 24:93-108. DOI: 10.1002/joc.981
Deka P, Hoque RR. 2014. Incremental effect of festive         Kulshrestha UC, Nageswara RT, Azhaguvel S Kulshrestha
   biomass burning on wintertime PM10 in Brahmaputra              MJ. 2004. Emissions and accumulation of metals in
   Valley of Northeast India. Atmospheric Research                the atmosphere due to crackers and sparkles during
   143:380-391.                                                   Diwali festival in India. Atmospheric Environment
   DOI: 10.1016/j.atmosres.2014.03.003                            38:4421-4425. DOI: 10.1016/j.atmosenv.2004.05.044
Fallahi S, Amanollahi J, Tzanis CG, Ramli MF. 2018.           Mahtta R. 2015. Green growth and air pollution in India.
   Estimating solar radiation using NOAA/AVHRR and                The Energy and Resources Institute (TERI), New
   ground measurement data. Atmospheric Research                  Delhi, 18 pp.
   199:93-102. DOI: 10.1016/j.atmosres.2017.09.006            Mavrakou T, Philippopoulos K, Deligiorgi D. 2012. The
Gadde B., Bonnet S, Menke C, Garivait S. 2009. Air pol-           impact of sea breeze under different synoptic patterns
   lutant emissions from rice straw open field burning in         on air pollution within Athens basin. Science of the
   India, Thailand and the Philippines. Environmental             Total Environment 433: 31-43.
   Pollution 157:1554-1558.                                       DOI: 10.1016/j.scitotenv.2012.06.011
   DOI: 10.1016/j.envpol.2009.01.004                          Mittal SK, Singh N, Agarwal R, Awasthi A Gupta PK. 2009.
Ganguly ND. 2009. Surface ozone pollution during the              Ambient air quality during wheat and rice crop stubble
   festival of Diwali, New Delhi, India Earth Science             burning episodes in Patiala. Atmospheric Environment
   India 2:224-229.                                               43:238-244. DOI: 10.1016/j.atmosenv.2008.09.068
Ganguly ND, Tzanis C. 2011. Study of stratosphere-tropo-      Nilsson ED, Paatero J, Boy M. 2001a. Effects of air mass-
   sphere exchange events of ozone in India and Greece            es and synoptic weather on aerosol formation in the
   using ozonesonde ascents. Meteorological Applica-              continental boundary layer. Tellus B: Chemical and
   tions 18:467-474. DOI: 10.1002/met.241                         Physical Meteorology 53:462-478.
Ganguly ND. 2015. Short term change in relative humid-            DOI: 10.3402/tellusb.v53i4.16619
   ity during the festival of Diwali in India. Journal of     Nilsson ED, Rannik U, Kulmala M, Buzorius G, O’Dowd
   Atmospheric and Solar-Terrestrial Physics 129:49-54.           CD. 2001b. Effects of continental boundary layer
   DOI: 10.1016/j.jastp.2015.04.007                               evolution, convection, turbulence and entrainment, on
236                                              N. D. Ganguly et al.

    aerosol formation. Tellus B: Chemical and Physical          mates and atmospheric emissions. Global Biogeochem-
    Meteorology 53:441-461.                                     ical Cycles 17:1099, doi: 10.1029/2003GB002040
    DOI: 10.3402/tellusb.v53i4.16617                         Triantafyllou AG. 2001. PM10 pollution episodes as a
Rappengluck B, Oyola P, Olaeta I, Fabian P. 1999. The           function of synoptic climatology in a mountainous
    evolution of photochemical smog in the metropolitan         industrial area. Environmental Pollution 112:491-500.
    area of Santiago de Chile. Journal of Applied Meteo-        DOI: 10.1016/S0269-7491(00)00131-7
    rology 39:275-290.                                       Tzanis C. 2005. Ground-based observations of ozone at
    DOI: 10.1175/1520-0450(2000)039%3C0275:TEOP-                Athens, Greece during the solar eclipse of 1999. In-
    SI%3E2.0.CO;2.                                              ternational Journal of Remote Sensing 26:3585-3596.
Saha U, Talukdar S, Jana S, Maitra A. 2014. Effects of          DOI: 10.1080/01431160500076947
    air pollution on meteorological parameters during        Tzanis C. 2009a. On the relationship between total ozone
    Deepawali festival over an Indian urban metropolis.         and temperature in the troposphere and the lower
    Atmospheric Environment 98:530-539.                         stratosphere. International Journal of Remote Sensing
    DOI: 10.1016/j.atmosenv.2014.09.032                         30:6075-6084. DOI: 10.1080/01431160902798429
Sahai S, Sharma C, Singh SK, Gupta PK. 2011. Assess-         Tzanis C. 2009b. Total ozone observations at Athens,
    ment of trace gases, carbon and nitrogen emissions          Greece by satellite-borne and ground-based instru-
    from field burning of agricultural residues in India.       mentation. International Journal of Remote Sensing
    Nutrient Cycling in Agroecosystems 89:143-157. DOI:         30:6023-6033.
    10.1007/s10705-010-9384-2                                   DOI: 10.1080/01431160902798411
Sinha PR, Sahu LK, Manchanda RK, Sheel V, Deushi M,          Tzanis C, Tsivola E, Efstathiou M, Varotsos C, 2009.
    Kajino M, Schultz MG, Nagendra N, Kumar P, Trive-           Forest fires pollution impact on the solar UV irradi-
    di DB, Koli SK, Peshin SK, Swamy YV, Tzanis CG,             ance at the ground. Fresenius Environmental Bulletin
    Sreenivasan S. 2016. Transport of tropospheric and          18:2151-2158.
    stratospheric ozone over India: Balloon-borne observa-   Tzanis CG, Alimissis A, Philippopoulos K, Deligiorgi D.
    tions and modeling analysis. Atmospheric Environment        2019. Applying linear and nonlinear models for the
    131:228-242. DOI: 10.1016/j.atmosenv.2016.02.001            estimation of particulate matter variability. Environ-
Stein AF, Draxler RR, Rolph GD, Stunder BJB, Cohen              mental Pollution 246:89-98.
    MD, Ngan F. 2015. NOAA’s HYSPLIT atmospheric                DOI: 10.1016/j.envpol.2018.11.080
    transport and dispersion modeling system. Bulletin of    Varotsos C, Efstathiou M, Tzanis C, Deligiorgi D. 2012.
    the American Meteorological Society 96:2059-2077.           On the limits of the air pollution predictability: The
    DOI: 10.1175/BAMS-D-14-00110.1                              case of the surface ozone at Athens, Greece. Environ-
Streets DG, Yarber KF, Woo JH, Carmichae GR. 2003.              mental Science and Pollution Research 19:295-300.
    Biomass burning in Asia: Annual and seasonal esti-          DOI: 10.1007/s11356-011-0555-8
You can also read