Explaining Extreme Events of 2019 from a Climate Perspective
←
→
Page content transcription
If your browser does not render page correctly, please read the page content below
Explaining Extreme
Events of 2019 from
a Climate Perspective

              Special
              Special Supplement
                       Supplement toto the
                                       the
  Bulletin
  Bulletin of
           of the
              the American
                   American Meteorological
                              Meteorological SocietySociety
            Vol.
             Vol. 102,
                  102, No.
                       No. 1,
                           1, January
                              January 2021
                                       2021
                                        Unauthenticated | Downloaded 02/27/21 09:22 PM UTC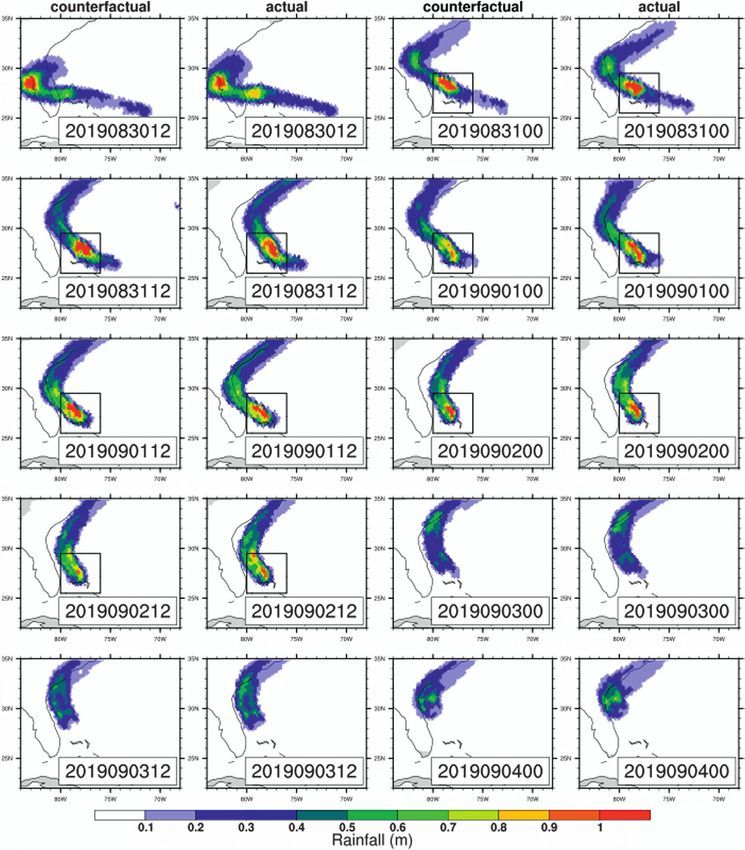
EXPLAINING EXTREME
EVENTS OF 2019 FROM A
CLIMATE PERSPECTIVE

                           Editors

    Stephanie C. Herring, Nikolaos Christidis, Andrew Hoell,
             Martin P. Hoerling, and Peter A. Stott

           BAMS Special Editors for Climate

               Andrew King, Thomas Knutson,
          John Nielsen-Gammon, and Friederike Otto

                 Special Supplement to the

        Bulletin of the American Meteorological Society

                 Vol. 102, No. 1, January 2021

       American Meteorological Society

                                                   Unauthenticated | Downloaded 02/27/21 09:22 PM UTC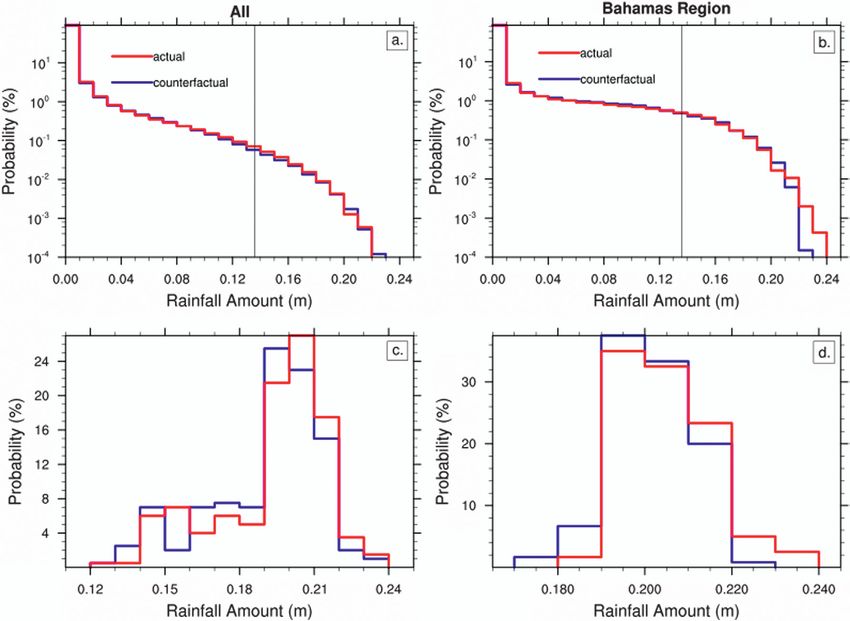
Corresponding Editor:
Stephanie C. Herring, Ph.D.
NOAA National Centers for Environmental Information
325 Broadway, E/CC23, Rm 1B-131
Boulder, CO 80305-3328
E-mail: stephanie.herring@noaa.gov
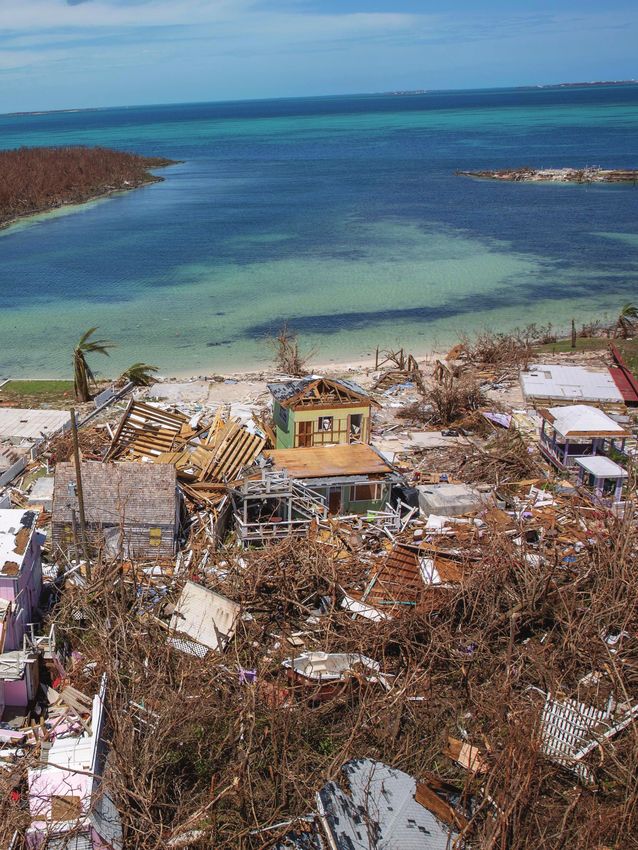
Cover: Ruins and rubble are all that are left of homes destroyed by Hurricane Dorian viewed from a U.S. Customs
and Border Protection rescue helicopter 5 September 2019 in Marsh Harbour, Abaco, Bahamas. Dorian struck the
small island nation as a Category 5 storm with winds of 185 mph. (credit: Planetpix/Alamy Stock Photo)
HOW TO CITE THIS DOCUMENT
Citing the complete report:
Herring, S. C., N. Christidis, A. Hoell, M. P. Hoerling, and P. A. Stott, Eds., 2021: Explaining Extreme Events
of 2019 from a Climate Perspective. Bull. Amer. Meteor. Soc., 102 (1), S1–S112, https:/doi.org/10.1175/BAMS-
ExplainingExtremeEvents2019.1.
Citing a section (example):
Amaya, D. J., M. A. Alexander, A. Capotondi, C. Deser, K. B. Karnauskas, A. J. Miller, and N. J. Mantua, 2021: Are
Long-Term Changes in Mixed Layer Depth Influencing North Pacific Marine Heatwaves? [in “Explaining Extremes
of 2019 from a Climate Perspective”]. Bull. Amer. Meteor. Soc., 102 (1), S59–S66, doi:https://doi.org/10.1175/
BAMS-D-20-0144.1.
Sii | JANUARY 2021
Unauthenticated | Downloaded 02/27/21 09:22 PM UTCTABLE OF CONTENTS
1. Increased Risk of the 2019 Alaskan July Fires due to Anthropogenic Activity. . . . . S1
2. Anthropogenic Influence on Hurricane Dorian’s Extreme Rainfall. . . . . . . . . . . . . . S9
3. Quantifying Human-Induced Dynamic and Thermodynamic Contributions
to Severe Cold Outbreaks Like November 2019 in the Eastern United States. . . . S17
4. Anthropogenic Influences on Extreme Annual Streamflow into Chesapeake
Bay from the Susquehanna River. . . . . . . . . . . . . . . . . . . . . . . . . . . . . . . . . . . . . . . . S25
5. Anthropogenic Contribution to the Rainfall Associated with the 2019
Ottawa River Flood. . . . . . . . . . . . . . . . . . . . . . . . . . . . . . . . . . . . . . . . . . . . . . . . . . . S33
6. Extremely Warm Days in the United Kingdom in Winter 2018/19 . . . . . . . . . . . . . S39
7. CMIP6 Model-Based Assessment of Anthropogenic Influence on the
Long Sustained Western Cape Drought over 2015–19. . . . . . . . . . . . . . . . . . . . . . . S45
8. Has Global Warming Contributed to the Largest Number of Typhoons
Affecting South Korea in September 2019?. . . . . . . . . . . . . . . . . . . . . . . . . . . . . . . S51
9. Are Long-Term Changes in Mixed Layer Depth Influencing North Pacific
Marine Heatwaves?. . . . . . . . . . . . . . . . . . . . . . . . . . . . . . . . . . . . . . . . . . . . . . . . . . . S59
10. Was the Extended Rainy Winter 2018/19 over the Middle and Lower
Reaches of the Yangtze River Driven by Anthropogenic Forcing?. . . . . . . . . . . . . S67
11. Roles of Anthropogenic Forcing and Natural Variability in the Record-
Breaking Low Sunshine Event in January–February 2019 over the
Middle-Lower Yangtze Plain. . . . . . . . . . . . . . . . . . . . . . . . . . . . . . . . . . . . . . . . . . . S75
12. Attribution of the Extreme Drought-Related Risk of Wildfires in Spring
2019 over Southwest China . . . . . . . . . . . . . . . . . . . . . . . . . . . . . . . . . . . . . . . . . . . . S83
13. Attribution of 2019 Extreme Spring-Early Summer Hot Drought over
Yunnan in Southwestern China. . . . . . . . . . . . . . . . . . . . . . . . . . . . . . . . . . . . . . . . . S91
14. Anthropogenic Influence on 2019 May–June Extremely Low Precipitation
in Southwestern China. . . . . . . . . . . . . . . . . . . . . . . . . . . . . . . . . . . . . . . . . . . . . . . . S97
15. Anthropogenic Influences on Heavy Precipitation during the 2019
Extremely Wet Rainy Season in Southern China . . . . . . . . . . . . . . . . . . . . . . . . . . S103
AMERICAN METEOROLOGICAL SOCIETY JANUARY 2021 | Siii
Unauthenticated | Downloaded 02/27/21 09:22 PM UTCSiv | JANUARY 2021
Unauthenticated | Downloaded 02/27/21 09:22 PM UTCAnthropogenic Influence
on Hurricane Dorian’s
Extreme Rainfall
Kevin A. Reed, Michael F. Wehner, Alyssa M. Stansfield,
and Colin M. Zarzycki
Hindcast attribution simulations suggest that
anthropogenic climate change increased the
likelihood of Hurricane Dorian’s extreme 3-hourly
rainfall amounts and total accumulated rainfall by
8%–18% and 5%–10%, respectively.
AFFILIATIONS: Reed and Stansfield—School of
H
Marine and Atmospheric Sciences, Stony Brook urricane Dorian formed on 24 August 2019 from a
University, Stony Brook, New York; Wehner— tropical wave and developed into a Category 5 hur-
Lawrence Berkeley National Laboratory, Berke- ricane on 1 September 2019 before making landfall
ley, California; Zarzycki—Pennsylvania State in the Bahamas (Avila et al. 2020). The impacts on the
University, State College, Pennsylvania Bahamas were extreme, including rainfall totals over 0.5 m
in the region (Avila et al. 2020). This was on the heels of
CORRESPONDING AUTHOR: Kevin Reed, kevin.
the recent damaging North Atlantic hurricanes of 2017 and
reed@stonybrook.edu
2018, which impacted various regions with different com-
DOI:10.1175/BAMS-D-20-0160.1 binations of hazards (Klotzbach et al. 2018a; Avila 2019).
Tropical cyclones are very costly natural disasters
A supplement to this article is available online (Klotzbach et al. 2018b) due to a diverse set of impacts,
(10.1175/BAMS-D-20-0160.2) including high winds, extreme rainfall, storm surge, and
fresh and/or saltwater flooding. Previous work has ex-
©2021 American Meteorological Society plored the potential impact of climate change, both in
For information regarding reuse of this content
the past and projected into the future, on these hazards
and general copyright information, consult the
(e.g., Knutson et al. 2010, 2019, 2020; Christensen et al.
AMS Copyright Policy.
2013; Walsh et al. 2016). A recent review by Knutson et al.
AMERICAN METEOROLOGICAL SOCIETY JANUARY 2021 | S9
Unauthenticated | Downloaded 02/27/21 09:22 PM UTC(2020) estimates that the global mean near-storm rainfall increases at about 7% per 1°C.
Significant advances have been made in attribution frameworks to help quantify the ef-
fect of climate change on individual hurricanes. Investigations of individual storms us-
ing various attribution methodologies suggest that changes in rainfall can exceed the
Knutson et al. (2020) estimate, although there are uncertainties associated with the use
of different rainfall metrics (e.g., Risser and Wehner 2017; van Oldenborgh et al. 2017;
Emanuel 2017; Wang et al. 2018; Keellings and Hernández Ayala 2019). Here we apply a
hindcast attribution methodology to Hurricane Dorian previously developed and test-
ed for Hurricane Florence (Reed et al. 2020), Typhoon Haiyan (Wehner et al. 2019), and
numerous other tropical cyclones (Patricola and Wehner 2018) that focuses on storm
rainfall due to confidence in the model’s ability to simulate precipitation processes.
Methods.
This work makes use of the variable-resolution configuration of the Community At-
mosphere Model version 5 (CAM5; Neale et al. 2012) with a 28-km nest over the North
Atlantic [as in Reed et al. (2020)]. CAM5, at grid spacings of 28 km, has been used
previously to explore tropical cyclones and rainfall at both climate (e.g., Wehner et
al. 2014; Zarzycki and Jablonowski 2014; Wehner et al. 2015; Bacmeister et al. 2018;
Stansfield et al. 2020a) and weather time scales (e.g., Zarzycki and Jablonowski 2015;
Wehner et al. 2019; Reed et al. 2020). Following the methodology of Zarzycki and Jablo-
nowski (2015), short 7-day ensemble hindcasts are initialized both in advance of and
after Hurricane Dorian’s landfall in the Bahamas at 12-h increments starting at 1200
UTC 30 August and ending at 0000 UTC 4 September for a total of 10 initialization
times. The CAM5 hindcasts are initialized with atmospheric and ocean surface anal-
yses from NOAA’s GDAS and OISST, respectively, to construct an ensemble under the
“actual” climate and weather conditions. Twenty ensemble members are created at
each initialization time by perturbing a set of three parameters (convective time scale,
precipitation coefficient, and parcel fractional mass entrainment rate) in the Zhang
and McFarlane (1995) deep convection parameterization [following Reed et al. (2020),
who used the parameter ranges from He and Posselt (2015)], resulting in a 200-member
ensemble. Note that since modifying parameters in the convective parameterization
can modulate precipitation (e.g., Zhao et al. 2012) the ensembles are perturbed with
the same values on a member-to-member basis across all experiments.
A “counterfactual” ensemble (20 members at each initialization time) is construct-
ed by removing the anthropogenic signal from the 3D air temperature, 3D specific hu-
midity, and 2D sea surface temperature (SST) initial conditions used for the actual
ensemble. Following Reed et al. (2020), the anthropogenic signal is approximated by
computing the difference between the All-Hist (with prescribed SST, sea ice, green-
house gases, and aerosols derived from observations) and Nat-Hist (with prescribed
SST, surface ice, greenhouse gases, and aerosols boundary conditions modified to
remove anthropogenic forcings) CAM5 simulations completed under Climate of the
Twentieth Century (C20C+) Detection and Attribution Project protocols (available at
portal.nersc.gov/c20c), designed for event attribution (Stone et al. 2019), for the average
of August and September for the last 20 years (1996–2016). This results in a difference
of SST of about 0.75°C in the Bahamas region. Dynamical fields, such as zonal and
meridional wind, are not adjusted in the initial conditions counterfactual ensemble,
consistent with Reed et al. (2020).
For both the actual and counterfactual ensembles, the TempestExtremes software
package (Ullrich and Zarzycki 2017) is used to detect and track the simulated storms
and extract storm-related rainfall using the approach of Stansfield et al. (2020b), which
specifies storm rainfall to be within an outer radius defined by a 8 m s–1 threshold of
the azimuthally averaged azimuthal wind speed. Hurricane Dorian’s observed rainfall
estimates from NASA’s Integrated Multi-satellitE Retrievals for GPM (IMERG; https://
pmm.nasa.gov/data-access/downloads/gpm) are used to calculate the maximum 3-hourly
S10 | JANUARY 2021
Unauthenticated | Downloaded 02/27/21 09:22 PM UTCrainfall amount, while recognizing that there are substantial uncertainties associated
with heavy tropical cyclone rainfall in satellite estimates (e.g., underestimating storm
rainfall over land; Chen et al. 2013).
Given resolution limitations, this work focuses on characterizing changes in the
precipitation associated with Hurricane Dorian in the CAM5 hindcasts simulations. It
is well known that intensity can influence storm rainfall and that numerical simula-
tions at these grid spacings are limited in their ability to represent intensity (i.e., max-
imum surface wind; Davis et al. 2018). Furthermore, the work of Patricola and Wehner
(2018) demonstrated, using a comparable hindcast attribution framework with the
Weather Research and Forecasting (WRF) Model, that while the simulated intensity
(i.e., maximum wind speed) of hurricanes is underestimated at 27-km grid spacing
compared to 3-km grid spacing, changes in storm rainfall due to warming are relative-
ly insensitive to this resolution difference. The CAM5 actual ensemble simulates an
average intensity bias at a lead time of 72 h (120 h) of approximately 47 hPa (39 hPa),
which is comparable to the intensity errors for the 27-km grid spacing simulation of
other category 5 hurricanes in Patricola and Wehner (2018) and consistent with other
operational numerical weather prediction for an intensifying major hurricane. While
imperfect, CAM5 hindcasts of tropical cyclones have demonstrated skill in represent-
ing storm rainfall (Reed et al. 2020) and tracks comparable to forecasts from operation-
al numerical weather prediction (Zarzycki and Jablonowski 2015).
Results.
Comparing 3-hourly rainfall amounts and total accumulated rainfall across the ac-
tual and counterfactual ensembles allows for an analysis of the potential impact of
observed climate change on Hurricane Dorian. The ensemble mean accumulated pre-
cipitation throughout the lifetime of the simulated storms at all initialization times is
shown in Fig. 1. The spatial ensemble mean rainfall patterns suggest that there are
similarities in the simulated tracks for the actual and counterfactual ensembles for
a given initialization time, allowing for direct comparison. However, there are varia-
tions in the simulated tracks across different initialization times (Fig. ES1), consistent
with real-time operational forecasts. Furthermore, additional analysis shows that the
average CAM5 hindcast track error at a lead time of 72 h (120 h) is 144 km (230 km),
which is within range of track errors associated with the official operational models
used by the National Hurricane Center. When comparing the magnitude of the ensem-
ble mean accumulated rainfall at individual initialization times between the actual
and counterfactual ensembles, Fig. 1 indicates that many areas experience increased
precipitation in the actual ensemble compared to the counterfactual. This is also true
in the region near the Bahamas (defined to be 25.5°–29.5°N, 76°–80°W; outlined in Fig.
1) where the most extreme rainfall accumulations were observed to occur (Fig. ES2),
providing some evidence that the model represents extreme rainfall sufficiently well
in the region. The Bahamas region is simulated to experience the highest rainfall ac-
cumulations in the ensembles during the initializations between 0000 UTC 31 August
and 1200 UTC 2 September.
Figure 2a shows the probability distribution of the 3-hourly rainfall amounts asso-
ciated with the simulated storm over its lifetime for all ensembles. The results suggest
that there is a shift toward higher 3-hourly rainfall amounts in the actual ensemble
with climate change. The likelihood of 3-hourly precipitation above the IMERG esti-
mated maximum of 0.136 m increases from approximately 0.145% in the counterfactu-
al ensemble to about 0.168% in the actual ensemble, representing an increase of 16%
(95% confidence interval: 14%–18%) in the likelihood of such events. It is worth noting
that a Dorian-like storm with rainfall at or above the IMERG estimated 3-hourly max-
imum is a 99.8th percentile event across the 200-member CAM5 ensemble, which is
indeed a rare event at the tail of the simulated distribution, suggesting that the model
framework has some skill in reproducing the extreme rainfall rates observed for Hurri-
AMERICAN METEOROLOGICAL SOCIETY JANUARY 2021 | S11
Unauthenticated | Downloaded 02/27/21 09:22 PM UTCFig. 1. Total accumulated ensemble mean storm-related rainfall (m) over the entire forecast period (excluding the first 12 h)
for each initialization time (as labeled) of the counterfactual and actual realizations of Hurricane Dorian. Each initialization
time contains 20 ensemble members. The Bahamas region is denoted (black outline) for the initialization times used for the
region-specific analysis.
S12 | JANUARY 2021
Unauthenticated | Downloaded 02/27/21 09:22 PM UTCcane Dorian. Given that the IMERG maximum is an estimate, we performed a sensitivi-
ty analysis by repeating the calculation for a maximum 3-hourly rainfall amount of 0.1
and 0.17 m (representing a ±25% change from the estimated maximum), and the per-
centage increase ranges from 8% to 13% in the likelihood of such events. Analysis of
the maximum 3-hourly rainfall amounts (Fig. 2c) in each ensemble reveals an increase
in the maximum precipitation of 2% (95% confidence interval: −1% to 4%). Figure 2b
shows the same probability distribution but for the Bahamas region (outlined in Fig.
1) associated with the initialization times that produce large rainfall amounts in the
region. The results again suggest that there is a shift toward higher 3-hourly rainfall
amounts in the actual ensemble with climate change, particularly at the highest rain
rates. The maximum 3-hourly rainfall in the Bahamas region (Fig. 2d) is simulated to
have increased by 2% (95% confidence interval: 1%–3%) due to climate change, while
the likelihood of 0.136 m amounts increases marginally (Conclusions.
The work explores the potential impact of climate change on the rainfall associated
with Hurricane Dorian using the CAM5 hindcast attribution framework. The analysis
indicates the likelihood of 3-hourly rainfall accumulations above 0.136 m (observed)
increases by 16%, while the maximum 3-hourly rainfall amount increases by 2% due
to climate change. When focusing on the extreme accumulations of rainfall that oc-
curred over multiple days, the analysis reveals the total accumulated rainfall over the
area of the simulated storm increased by 7%. This work provides additional evidence
that climate change has increased the magnitude and probability of extreme rainfall
associated with recent devastating hurricanes (Risser and Wehner 2017; van Olden-
borgh et al. 2017; Emanuel 2017; Wang et al. 2018; Trenberth et al. 2018; Keellings and
Hernández Ayala 2019; Reed et al. 2020) and is consistent with projected changes in
tropical cyclone–related precipitation under future climate change scenarios (e.g., Vil-
larini et al. 2014; Knutson et al. 2020; Stansfield et al. 2020a). Depending on the rain-
fall metric used the simulated change presented here for Hurricane Dorian is closer to,
or below, the theoretical Clausius–Clapeyron scaling of ~4% to 6% (given the 0.75°C
SST change). However, differences in metrics and methodologies, including sensitiv-
ities to model resolution which will be the focus of future work, among the various
hurricane precipitation attribution studies are critical to the interpretation of these
numbers. As global SSTs continue to warm, rainfall accumulations associated with
storms like Hurricane Dorian will undoubtedly continue to increase.
Acknowledgments. This work was partially supported by the Stony Brook Founda-
tion’s Minghua Zhang Early Career Faculty Innovation Fund, NASA under Grant 80NS-
SC19K0717, the NSF Research Traineeship (NRT) program (1633299), and the Regional
and Global Model Analysis (RGMA) program area of the DOE’s Office of Science under
Contract DE-AC02-05CH11231.
References
Avila, L. A., 2019: The 2018 Atlantic hurricane season: Another cat- Davis, C. A., 2018: Resolving tropical cyclone intensity in models.
astrophic year for the United States. Weatherwise, 72, 14–21, Geophys. Res. Lett., 45, 2082–2087. https://doi.org/10.1002
https://doi.org/10.1080/00431672.2019.1612201. /2017GL076966.
—, S. R. Stewart, R. Berg, and A. B. Hagen, 2020: National Hur- Emanuel, K., 2017: Assessing the present and future probability
ricane Center Tropical Cyclone Report, Tropical Cyclone Report of Hurricane Harvey’s rainfall. Proc. Natl. Acad. Sci. USA, 114,
Hurricane Dorian AL052019, National Hurricane Center, 74 pp., 12 681–12 684, https://doi.org/10.1073/pnas.1716222114.
https://www.nhc.noaa.gov/data/tcr/AL052019_Dorian.pdf. He, F., and D. J. Posselt, 2015: Impact of parameterized physical pro-
Bacmeister, J. T., K. A. Reed, C. Hannay, P. J. Lawrence, S. C. Bates, cesses on simulated tropical cyclone characteristics in the Com-
J. E. Truesdale, N. A. Rosenbloom, and M. N. Levy, 2018: Projected munity Atmosphere Model. J. Climate, 28, 9857–9872, https://doi.
changes in tropical cyclone activity under future warming scenar- org/10.1175/JCLI-D-15-0255.1.
ios using a high-resolution climate model. Climatic Change, 146, Keellings, D., and J. J. Hernández Ayala, 2019: Extreme rainfall associ-
547–560, https://doi.org/10.1007/s10584-016-1750-x. ated with Hurricane Maria over Puerto Rico and its connections to
Chen, Y., E. E. Ebert, K. J. E. Walsh, and N. E. Davidson, 2013: Eval- climate variability and change. Geophys. Res. Lett., 46, 2964–2973,
uation of TRMM 3B42 precipitation estimates of tropical cyclone https://doi.org/10.1029/2019GL082077.
rainfall using PACRAIN data. J. Geophys. Res. Atmos., 118, 2184– Klotzbach, P. J., C. J. Schreck III, J. M. Collins, M. M. Bell, E. S. Blake,
2196, https://doi.org/10.1002/jgrd.50250. and D. Roache, 2018a: The extremely active 2017 North Atlantic
Christensen, J. H., and Coauthors, 2013: Climate phenomena and hurricane season. Mon. Wea. Rev., 146, 3425–3443, https://doi.
their relevance for future regional climate change. Climate Change org/10.1175/MWR-D-18-0078.1.
2013: The Physical Science Basis, T. F. Stocker et al., Eds., Cam- —, S. G. Bowen, R. Pielke, and M. Bell, 2018b: Continental U.S. hurri-
bridge University Press, 1217–1308. cane landfall frequency and associated damage: Observations and
S14 | JANUARY 2021
Unauthenticated | Downloaded 02/27/21 09:22 PM UTCfuture risks. Bull. Amer. Meteor. Soc., 99, 1359–1376, https://doi. Ullrich, P. A., and C. M. Zarzycki, 2017: TempestExtremes: A framework
org/10.1175/BAMS-D-17-0184.1. for scale-insensitive pointwise feature tracking on unstructured
Knutson, T. R., and Coauthors, 2010: Tropical cyclones and climate grids. Geosci. Model Dev., 10, 1069–1090, https://doi.org/10.5194/
change. Nat. Geosci., 3, 157–163, https://doi.org/10.1038/ngeo779. gmd-10-1069-2017.
—, and Coauthors, 2019: Tropical cyclones and climate change as- van Oldenborgh, G. J., and Coauthors, 2017: Attribution of extreme
sessment: Part I. Detection and attribution. Bull. Amer. Meteor. Soc., rainfall from Hurricane Harvey, August 2017. Environ. Res. Lett., 12,
100, 1987–2007, https://doi.org/10.1175/BAMS-D-18-0189.1. 124009, https://doi.org/10.1088/1748-9326/aa9ef2.
—, and Coauthors, 2020: Tropical cyclones and climate change as- Villarini, G., D. A. Lavers, E. Scoccimarro, M. Zhao, M. F. Wehner, G. A.
sessment: Part II. Projected response to anthropogenic warming. Vecchi, T. R. Knutson, and K. A. Reed, 2014: Sensitivity of tropical
Bull. Amer. Meteor. Soc., 101, E303–E322, https://doi.org/10.1175/ cyclone rainfall to idealized global scale forcings. J. Climate, 27,
BAMS-D-18-0194.1. 4622–4641, https://doi.org/10.1175/JCLI-D-13-00780.1.
Neale, R. B., C. C. Chen, A. Gettelman, P. H. Lauritzen, S. Park, D. L. Walsh, K. J., and Coauthors, 2016: Tropical cyclones and climate change.
Williamson, and M. A. Taylor, 2012: Description of the NCAR Com- Wiley Interdiscip. Rev.: Climate Change, 7, 65–89, https://doi.
munity Atmosphere Model (CAM 5.0). NCAR Tech. Note NCAR/TN- org/10.1002/WCC.371.
486+STR, 274 pp., www.cesm.ucar.edu/models/cesm1.0/cam/docs/ Wang, S.-Y. S., L. Zhao, J.-H. Yoon, P. Klotzbach, and R. R. Gillies, 2018:
description/cam5_desc.pdf. Quantitative attribution of climate effects on Hurricane Harvey’s ex-
Patricola, C. M., and M. F. Wehner, 2018: Anthropogenic influences on treme rainfall in Texas. Environ. Res. Lett., 13, 054014, https://doi.
major tropical cyclone events. Nature, 563, 339–346, https://doi. org/10.1088/1748-9326/aabb85.
org/10.1038/s41586-018-0673-2. Wehner, M., and Coauthors, 2014: The effect of horizontal resolu-
Reed, K. A., A. M. Stansfield, M. F. Wehner, and C. M. Zarzycki, 2020: Fore- tion on simulation quality in the Community Atmospheric Mod-
casted attribution of the human influence on Hurricane Florence. el, CAM5.1. J. Adv. Model. Earth Syst., 6, 980–997, https://doi.
Sci. Adv., 6, eaaw9253, https://doi.org/10.1126/sciadv.aaw9253. org/10.1002/2013MS000276.
Risser, M. D., and M. F. Wehner, 2017: Attributable human-induced —, K. A. Reed, D. Stone, W. D. Collins, and J. Bacmeister, 2015:
changes in the likelihood and magnitude of the observed extreme Resolution dependence of future tropical cyclone projections of
precipitation during Hurricane Harvey. Geophys. Res. Lett., 44, CAM5.1 in the U.S. CLIVAR hurricane working group idealized con-
12 457–12 464, https://doi.org/10.1002/2017GL075888. figurations. J. Climate, 28, 3905–3925, https://doi.org/10.1175/JC-
Stansfield, A. M., K. A. Reed, and C. M. Zarzycki, 2020a: Changes in LI-D-14-00311.1.
precipitation from North Atlantic tropical cyclones under RCP —, C. Zarzycki, and C. Patricola, 2019: Estimating the human influ-
scenarios in the variable-resolution Community Atmosphere ence on tropical cyclone intensity as the climate changes. Hurricane
Model. Geophys. Res. Lett., 47, e2019GL086930, https://doi. Risk, Vol. I, J. Collins and K. Walsh, Eds., Springer, 235–260.
org/10.1029/2019GL086930. Zarzycki, C. M., and C. Jablonowski, 2014: A multidecadal simulation
—, —, —, P. A. Ullrich, and D. R. Chavas, 2020b: Assessing of Atlantic tropical cyclones using a variable-resolution global at-
tropical cyclones’ contribution to precipitation over the eastern mospheric general circulation model. J. Adv. Model. Earth Syst., 6,
United States and sensitivity to the variable-resolution domain 805–828, https://doi.org/10.1002/2014MS000352.
extent. J. Hydrometeor., 21, 1425–1445, https://doi.org/10.1175/ —, and —, 2015: Experimental tropical cyclone forecasts using a
JHM-D-19-0240.1. variable-resolution global model. Mon. Wea. Rev., 143, 4012–4037,
Stone, D. A., and Coauthors, 2019: Experiment design of the Internation- https://doi.org/10.1175/MWR-D-15-0159.1.
al CLIVAR C20C+ detection and attribution project. Wea. Climate Zhang, G. J., and N. A. McFarlane, 1995: Sensitivity of climate simula-
Extrem., 24, 100206, https://doi.org/10.1016/j.wace.2019.100206. tions to the parameterization of cumulus convection in the Cana-
Trenberth, K. E., L. Cheng, P. Jacobs, Y. Zhang, and J. Fasullo, 2018: dian Climate Centre general circulation model. Atmos.–Ocean, 33,
Hurricane Harvey links to ocean heat content and climate 407–446, https://doi.org/10.1080/07055900.1995.9649539.
change adaptation. Earth’s Future, 6, 730–744, https://doi. Zhao, M., I. M. Held, and S. Lin, 2012: Some counterintuitive dependen-
org/10.1029/2018EF000825. cies of tropical cyclone frequency on parameters in a GCM. J. Atmos.
Sci., 69, 2272–2283, https://doi.org/10.1175/JAS-D-11-0238.1.
AMERICAN METEOROLOGICAL SOCIETY JANUARY 2021 | S15
Unauthenticated | Downloaded 02/27/21 09:22 PM UTCYou can also read