Evaluation of Climate Variability Performances using Statistical Climate Models - UKM?
←
→
Page content transcription
If your browser does not render page correctly, please read the page content below
Sains Malaysiana 47(1)(2018): 77–84
http://dx.doi.org/10.17576/jsm-2018-4701-09

  Evaluation of Climate Variability Performances using Statistical Climate Models
                    (Penilaian Prestasi Kebolehubahan Iklim menggunakan Model Statistik Iklim)

                          NURUL NADRAH AQILAH TUKIMAT*, AHMAD SAIFUDDIN OTHMAN,
                               SAFFUAN WAN AHMAD & KHAIRUNISA MUTHUSAMY

                                                       ABSTRACT
Uncertainty of the climates nowadays bring the crucial calamities problems especially at unexpected areas and in anytime.
Thus, the projection of climate variability becomes significant information especially in the designing, planning and
managing of water resources and hydrological systems. Numerous climate models with varies methods and purposes have
been developed to generate the local weather scenarios with considered the greenhouse gasses (GHGs) effect provided
by General Circulation Models (GCMs). However, the accuracy and suitability of each climate models are depending
on the atmospheric characters’ selection and the variables consideration to form the statistical equation of local-global
weather relationship. In this study, there are two well-known statistical climate models were considered; Lars-WG and
SDSM models represent for the regression and weather typing methods, respectively. The main aim was to evaluate the
performances among these climate models suit for the Pahang climate variability for the upcoming year ∆2050. The
findings proved the Lars-WG as a reliable climate modelling with undemanding data sources and use simpler analysis
method compared to the SDSM. It is able to produce better rainfall simulated results with lesser %MAE and higher R value
close to 1.0. However, the SDSM lead in the temperature simulation with considered the most influenced meteorological
parameters in the analysis. In year ∆2050, the temperature is expected to rise achieving 35°C. The rainfall projection
results provided by these models are not consistent whereby it is expecting to increase 2.6% by SDSM and reduce 1.0%
by Lars-WG from the historical trend and concentrated on Nov.

Keywords: Climate performance; climate prediction; lars-wg; Pahang climate; SDSM

                                                       ABSTRAK
Ketidaktentuan cuaca kini membawa kepada bencana alam yang dahsyat terutama kepada kawasan yang tidak dijangka
dan dalam masa yang tidak menentu. Oleh itu, unjuran perubahan iklim menjadi maklumat penting terutama dalam
reka bentuk, perancangan dan pengurusan sumber air dan sistem hidro. Pelbagai model iklim dengan metod dan tujuan
yang berbeza telah dibangunkan untuk menjana senario iklim setempat dengan mengambil kira kesan gas rumah hijau
yang dibekalkan oleh Model Sikulasi Umum (GCMs). Namun, ketepatan dan keseimbangan setiap model iklim adalah
bergantung kepada pemilihan ciri atmosfera dan variasi yang digunakan untuk membentuk persamaan statistik bagi
hubungan cuaca setempat-global. Dalam kajian ini, 2 model iklim statistik telah digunakan; Model Lars-WG dan Model
SDSM mewakili kaedah regresi dan kaedah cuaca penaipan. Tujuan utama adalah untuk menilai prestasi antara model
yang bersesuaian dengan kebolehubahan iklim di Pahang pada tahun 2050. Keputusan telah menunjukkan bahawa
Lars-WG sebagai model iklim yang boleh dipercayai tanpa memerlukan sumber data yang banyak dan menggunakan
kaedah yang lebih mudah berbanding SDSM. Ia juga dapat menghasilkan keputusan simulasi yang lebih baik dengan
%MAE yang lebih sedikit dan nilai R menghampiri 1.0. Walau bagaimanapun, SDSM mengungguli bagi simulasi suhu
dengan mengambil kira parameter meteorologi yang paling berpengaruh dalam analisis. Keputusan unjuran iklim
menunjukkan bahawa suhu dianggarkan akan meningkat sehingga mencecah 35°C. Walau bagaimanapun, model tersebut
menghasilkan laporan unjuran hujan yang tidak tekal dengan hujan tahunan dianggarkan meningkat sebanyak 2.6%
oleh SDSM dan berkurangan sebanyak 1.0% oleh Lars-WG daripada sejarah aliran dengan anggaran bahawa hujan
lebat tertumpu pada bulan Nov.

Kata kunci: Iklim Pahang; jangkaan iklim; lars-wg; prestasi iklim; SDSM

                     INTRODUCTION
                                                              of anthropogenic sources contributed to the greenhouse
Extreme changes of climate nowadays become chaos and          gasses (GHGs) contaminant in the atmospheric circulation
can be horrifying at anywhere in anytime. Ismail et al.       system. Kwan et al. (2013) proved the elevated of GHGs
(2014) proved the ozone concentration in the atmospheric      year by year may bring the warm temperature extreme at
system is increasing year by year due to the increment        night as compared to the warm day especially in the East-
78
coast Malaysia. Thus, the changes pattern in the spatial and in this study due to the inconsistent connection between
temporal variability is significantly to be forecasted using changes frequency of weather pattern with the host GCM
hydrological modeling (Mohsen et al. 2014). output (Wilby & Dawson 2007).
In recent years, Malaysia had been experienced with The selection of the influenced atmospheric characters,
serious calamities events whereby the strength of the grid locations and scenarios consistency can be as basis
calamities influenced by the monsoons trend and GHGs level. to control the accuracy and reliability of the projected
Normally, Northeast-monsoon produces huge impact to the results. For the predictors selection, some behavior should
country and society due to the heavy rainfall and followed be considered there are should be reliable to simulate by
by flood. During this monsoon, the cyclone vortices are GCM, readily available from archives of GCM output and
formed when convergence interaction is existed between strongly correlated with the surface variable of interest
strong cold air with low pressure atmospheric system. It is (Wilby et al. 1999). Even both models use statistical
resulting to the strong wind, sea level rises, heavy rainfall concept, however, each model tend to produce different
in very short spell and overflow of the rivers. This situation performances and reliability depending on the variables
becomes worst when the excessive water receded very selection and the location of local site study. Hassan et
slow and inundated at the nearest residential areas which al. (2014) in their study reported that the SDSM model
were resulted to the properties destructed, food scarcity, had better performances during calibration and validation
and economy losses in million ringgits. According to the processes compared to the Lars-WG but produced similar
Meteorological Department Malaysia report in year 2014 trend in the future year. Supported by Hashmi et al.
(MDM 2014), the total monthly rainfall at that critical time (2011) stated the SDSM performed well in simulation with
achieved 1200 mm/month, 60% greater than the normal very close GEV distribution to the historical record. It is
monthly rainfall. Even the calamities were affected by the contrast to the findings from Lee and Lam (2004) that
natural of cyclical monsoons, but it could be extremely showed the Lars-WG model produced better performances
affected by the climate change impact. in generating daily precipitation than SDSM model but
Thus, the long term climatic information becomes unreliable in daily temperature extreme. However, in 2015,
significant data input to plan and manage the water Lee and Lam agreed the SDSM model is more capable to
resources and hydrological system efficiently. The main describe the climatic changes in an extreme condition
purpose was to look forward the changes pattern of compared to the Lars-WG model. The performances of
climate trend affected by the greenhouse emissions and each models are varies depending on the local influence
the implication to the hydrological system. The statistical factors in constructing the climate projection trend suit
downscaling ( SD ) employs a statistical relationship to the site conditions. The best climate model to present
between the large scale climatic characteristics with the Pahang climate variability is still chaos and unknown
local climatic variations that representing in the statistical because impropriate selection of climate models will
equations. It is considered by many researchers because the produce unreliable projected results. The main aim of this
model applied simpler statistical equation that is easier to paper were to evaluate the performances of Lars-WG and
understand the relationship pattern between local weather SDSM model as reliable climatic model for Pahang state and
and global climate. Besides, the model does not require to predict the future changes of temperature and rainfall
high computational demand to view the simulation result trends for year ∆2050 using SDSM and Lars-WG models.
because the output is presented in the finer resolutions.
Thus, it could reduce the total cost of the project but at SITE OF STUDY
the same time has higher ability to produce better climate The study was conducted at Pahang state based on the
simulation (Chen et al. 2012; Chu et al. 2009; Hamidon historical extreme flood events in the recent years back. It
et al. 2015; Hashmi et al. 2011; Tukimat & Harun 2013). is located at east coast of peninsular Malaysia near to the
The SD classifies into 3 groups based on the parameters South China Sea. The rainfall distributions at this region is
consideration and statistical methods in presenting the influenced by the wind direction and 2 monsoons pattern
global atmospheric and local climate relationships. There known as Northeast (Oct - Mar) and Southwest (Jun - Aug)
are regression methods (Statistical Downscaling Model, monsoons. The land area is 35,965 km2 and has 2 main
SDSM), weather typing scheme and weather generator river basins; Kuantan river and Pahang river basins. The
(Long Ashton Research Station Weather Generator - Lars- annual rainfall is 2400 mm/year with average temperature
WG). The SDSM interprets the predictand (local weather of 28°C. The highest and lowest rainfall intensity is focused
trend) and predictor (GCMs-scale) relationship using on Dec and Jan, respectively. The average wind speed is 5
multiple regression techniques. Meanwhile, Lars- WG mph with the relative humidity of 85%. Twelve (12) rainfall
model uses probability distribution functions based on the stations at surrounding Pahang state were selected based on
wet and dry length records to generate the climatic changes the availability of 30 years length data records as shown in
and variability (Semenov 2002). Both models are the most Figure 1 meanwhile Figure 2 shows the monthly weather
popular and recently applied among researchers due to its trend at the region. The lists of rainfall stations are Kuala
reliability and consistency (Hassan & Harun 2012; Sharma Reman (KR), Keretapi Kerambit (KK), Kechau (Kec), Kuala
et al. 2010). The weather typing method was not considered Bera (KB), Kg. Serambi (KgSe), Kg. Salong (KgSa), Kg.79
Temai Hilir (KgTH), Kg Jami (KgJ), Janda Baik (JB), Kg multiple regression techniques (Wilby & Dawson 2007).
Manchis (KgM), Palas (Pal), Bhg. Selatan (Sel). These regressions emerged from the empirical statistical
relationship between atmospheric circulation pattern
(predictors) and local scale parameters (predictand).
METHODS
Besides, the simplicity and computationally undemanding
of SDSM tools made it acceptable and recognizable in terms
STATISTICAL DOWNSCALING MODEL (SDSM) of climate model projection. Daily rainfall data and daily
The SDSM model was chosen to simulate future rainfall atmospheric predictors from NCEP reanalysis data calibrates
at the pointed grid box. This model is widely used in the and validates in the period year 1984 - 2013 to develop
context of hydrological issue due to climate scenarios the downscaling relationship. Then, the GCMs data are
because it provides station scale climate information utilized to generate future trend for interval year periods
from grid resolution GCM -scale as input based on of ∆2050. The A2 scenario chosen for this study provides
an upper bound on future emissions and it is selected from
an impacts-and-adaptation point of view; if it is adaptable
to large climate change, it will have no problem with
smaller climate change and lower end scenario, although
low emissions scenario gives less information from this
point of view. As stated by Tukimat and Alias (2016), the
A2 scenario has more potential to develop bigger impacts
of global warming compared to other emission groups.
LARS-WG MODEL
Lars-WG is one of the weather generator type to simulate
weather stochastic based on the statistical characteristics of
the local weather. The model uses daily weather time series
to determine a set of probability distribution parameters
and next will be used as a predictor agent to generate the
synthetic weather time-series in the long term. The weather
is classified into 2 categories there are wet and dry days
depending on the daily rainfall amount. Wet and dry length
records are used to determine the rainfall occurrence and
FIGURE 1. Topography of Pahang state, Malaysia solar radiation using semi-empirical distributions (EMP) for
each month. EMP is a histogram with 10 different intervals
(ai-1, ai) where ai-1 < ai and h is the number of the events
from observed data in the i-th interval. Meanwhile for the
temperature simulation, the normal distribution is used
for the temperature variables with the mean and standard
deviation varying daily according to finite Fourier series
of order three (Semenov 2002).
In this study, mean absolute error ( MAE ) and
correlation value (R) have been applied in measuring and
comparing the performances of each model. Table 1 shows
the equation involved in this study where Xobs refers to the
FIGURE 2. Historical monthly weather distribution ith month observed data, Xest is the ith month estimated data,
pattern at Pahang state n is the number of data.
TABLE 1. Equation for statistical analysis
Name Formula Description
MAE (%) Total percentage error between two variables
R Correlation value80
RESULTS AND DISCUSSION
Variables are very important data input in developing the
climate relationship. The consideration of variables is
depending on the local weather behavior. In this case study,
Lars-WG and SDSM models have been applied to generate
the local climate trend in the upcoming year.
The analysis showed that both models require similar
variables as data input there are daily local weather (as FIGURE 3. Summary of data input and output of models
predictand) and GCMs parameters (as predictor). The
contrast between these models is in term of the predictor
selection. In the Lars-WG, the selection of predictors is PERFORMANCES COMPARISON FOR CLIMATE
SIMULATED RESULT
controlled by the model however in the SDSM, the user is
able to choose at least 5 predictors based on the multiple The calibration and validation processes are necessity
correlation values. The predictand-predictor relationship to ensure the accuracy and reliability of the projected
that produce greater correlation values will be selected results. The goal is to identify the fundamental rules
as predictor for this region. It is significant to show how and the predictand-predictors relationships are able to
strong the predictor’s behavior is affected to the formation adequate as original data. During calibration (1984-1995)
of local weather. Thus, the accuracy and reliability of the and validation (1996-2008) processes, each model used
projection results is controlled by the strong bond among different approaches in controlling the accuracy of the
the predictors and predictand. model output.
Based on the output, the Lars-WG is able to produce For Lars-WG, the accuracy is based on the Kolmogorov-
more meteorological output than the SDSM even use the Smirnov (K-S) test and p-value for the calibrated and
same data input as shown in Figure 3. With limited data validated results. The good analysis is considered when the
input, the model is able to generate the temperature and K-S value is less than 1 and p-value is closed to 1. In this
potential of evapotranspiration (PET) for each local station. study, the performances of calibration and validation results
It is not possible in the Lars-WG because the temperature produced by Lars-WG as shown in Table 2. Contrast to the
estimation is based on the daily means and daily standard SDSM, the reliability and robustness of the simulated results
deviations on the dry and wet length records. Meanwhile, is referred to the performances of selected atmospheric
the PET was determined using Priestly-Taylor method variables to the local weather trend. The selection of
under radiation-based methods whereby the PET value is predictors for each weather station was different as
depending on the long-wave radiation and temperature shown in Table 3. Based on the correlation results, three
in the calculation. The result was suspicious because the predictors there are surface meridional velocity (p_v),
local radiation was not provided in this study. Besides, the relative humidity at 850 hpa (p850) and near surface
Priestly-Taylor method has potential to produce bigger relative humidity (rhum) are well correlated with all the
biases rather than others radiation-based method (Tukimat local weather stations with >0.5 of the correlation value.
et al. 2012). These atmospheric parameters are reliable and suitable
TABLE 2. K-S test and p-value results for 12 stations
Calibration Validation
Station Name Assessment
KS statistic p-value KS statistic p-value
KR 0.07 1.00 0.07 1.00 Satisfactory
KK 0.10 0.99 0.08 1.00 Satisfactory
Kec 0.10 0.99 0.10 1.00 Satisfactory
KB 0.10 0.99 0.09 0.99 Satisfactory
KgSe 0.09 1.00 0.10 0.99 Satisfactory
KgSa 0.08 1.00 0.09 0.99 Satisfactory
KgTH 0.08 1.00 0.08 1.00 Satisfactory
KgJ 0.08 0.98 0.09 1.00 Satisfactory
JB 0.09 0.99 0.10 0.99 Satisfactory
KgM 0.07 1.00 0.09 1.00 Satisfactory
Pal 0.10 0.98 0.10 0.98 Satisfactory
Sel 0.09 1.00 0.10 0.95 Satisfactory81
TABLE 3. Predictor selection for temperature and rainfall
KgJ KgM JB KB KgSa KgSe KgTH KR KK Kec Sel Pal Temp
p_u / / /
p_v / / / / / / / / /
p_z / / / /
p5_u / / / / /
p500 / / /
p8_u / / / /
p850 /
r500 / / / /
r850 / / / / / / / / / / / / /
rhum / / / / / / / / / / /
shum / / / / /
tmean / /
for the local weather trend because of the study location WG and SDSM models with the historical data. Generally,
nearest to the equator and expose to the high humidity and all models are performed well and produced quite similar
wind. to the historical monthly pattern. For the temperature
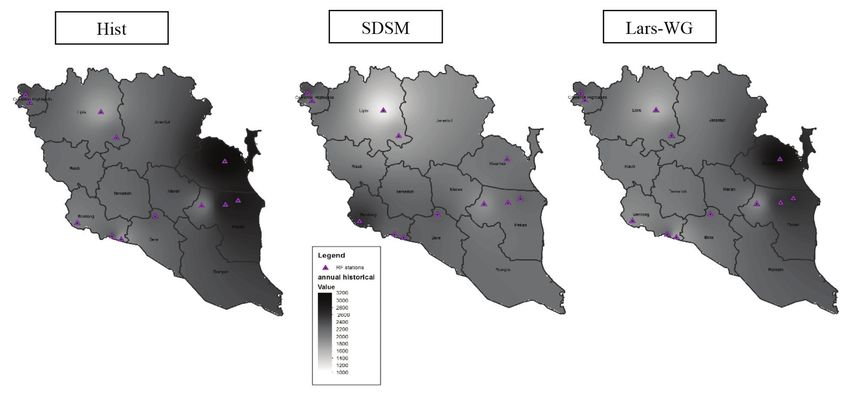
Figure 4 and Table 4 present the performances simulation, SDSM was successfully to generate the
comparison of the simulated results produced from Lars- temperature results in terms of maximum (Tmax), mean
FIGURE 4. Calibrated and validated performances of SDSM and
Lars-WG compared with historical data82
TABLE 4. Statistical analysis comparison for rainfall and temperature simulated by SDSM and Lars-WG model
Station rainfall KgJ KgM JB KB KgSa KgSe TH KR KK Kec Sel Pal
R 0.99 0.99 0.99 0.80 0.99 0.99 0.99 0.99 0.99 0.84 0.99 0.99
SDSM
MAE (%) 20.0 13.0 29.2 19.1 28.7 27.1 29.6 21.6 28.8 24.1 25.2 21.8
R 0.93 0.98 0.97 0.96 0.92 0.99 0.97 0.99 0.95 0.97 0.99 0.97
Lars-WG
MAE (%) 8.2 9.5 13.8 10.4 15.7 10.9 9.9 10.2 14.0 10.0 9.6 9.2
Tmax Tmean Tmin
R 0.99 0.99 1.0
SDSM
MAE (%) 0.39 1.24 0.28
R 0.99 Nil 0.99
Lars-WG
MAE (%) 0.44 Nil 0.77
(Tmean) and minimum (Tmin). However, the Lars-WG prediction of rainfall is very sensitive to the atmospheric
model only able to produce the Tmax and Tmin with characteristics and might have different influence factors
assume Tmean is average from both results. The Lars-WG for each location. However, the simulated results from
is also able to generate the temperature trend for each 12 SDSM model are considered acceptable for this study
locations of study area with only based on the Kuantan because the error is less than 30% with the R value is closed
meteorological station. to 1.0.
However, the results are unacceptable and unreliable
with the reasons of different land use, contour and COMPARISON OF RAINFALL AND TEMPERATURE
meteorological effect for each station. Based on the TREND IN YEAR ∆2050
statistical analysis, both models are successful to produce
Figure 5 is the projected results of rainfall pattern for the
very strong correlation value closed to 1 with MAE is less
interval year of ∆2050 using SDSM and Lars-WG models.
than 1.3%. Comparing SDSM and Lars-WG performances
Based on the results, the rainfall pattern is distributing
for the temperature simulation, it is clearly show that the
non-uniformly at the whole area of Pahang state whereby
SDSM performed well with lower %MAE than the Lars-WG.
several locations might receive higher rainfall intensity
Meanwhile, the Lars-WG has better performances
than SDSM model in the rainfall simulated results with compared to other areas. In year ∆2050, most of the areas
lesser MAE and higher of R values. The error from SDSM are expected to receive lesser rainfall amount compared to
model is might affected by the combination of predictor the historical record except at Bera and Bentung districts.
selections that gives huge influence to the rainfall pattern. However, the projection of rainfall amount using 2 climate
As mentioned by Tukimat and Harun, 2013 where the models is slightly different and inconsistent.
FIGURE 5. Comparison of rainfall projected result in year ∆205083
FIGURE 6. Comparison of temperature projected result in year ∆205
SDSM projection results show that 5 locations model is able to provide more climatic and meteorological
potentially to receive higher annual rainfall than the information such as rainfall simulation, temperature
historical there are KB, KgJ, JB, Pal and KgTH with simulation, wet and dry length, solar radiations and PET
increment of 2% to 35%. The heaviest rainfall is predicted value. In the calibration and validation processes, the
focused on these 2 potential districts; Cameron Highland SDSM performed well for the temperature simulations with
and Bentong with the annual rainfall is expected to reach lesser %MAE and R value close to 1 but not in the rainfall
>3000 mm. In average, the annual rainfall of Pahang state simulation. The bigger error in the simulated results might
is predicted to raise 2.6% from the historical record. affected by the predictor selection that gives huge influence
Meanwhile Lars-WG model shows only 2 locations to the rainfall pattern.
are predicted to receive higher rainfall intensity than the In the climate projection of year ∆2050, both models
historical there are KB and JB with +18% to +35%. The provide consistent projected result in the temperature but
heaviest rainfall is expected to disperse around Kuantan different climatic variability in the rainfall trend. It is
district similar to the historical record. The annual rainfall expected to rise up to 35°C on May in the future year. The
of Pahang state using this model is estimated to reduce average annual rainfall is predicted to increase 2.6% using
about 1.0% from the historical. However, both models SDSM model, however, it is expected to reduce 1.0% by
agree that November and February are the critical months using Lars-WG model. Five areas that expected to receive
who receive the highest and lowest rainfall through a year, higher rainfall amount than the historical record there
respectively. Contrast to the projected temperature as are KB, KgJ, JB, Pal, and. However, both models agree
shown in Figure 6, both models predicted similar results. that November and February are the critical months who
The increment is expected to reach 4% during interval receive the highest and lowest rainfall through a year,
year of ∆2050. The highest temperature is focused on May respectively.
with the temperature reading is achieving 35°C. February
is the lowest temperature reading and estimated to drop to ACKNOWLEDGEMENTS
21°C, whereby 4% lower than the historical record. Even This research is supported by the Meteorological
the Lars-WG model only able to produce the max and Department Malaysia (MDM), Drainage and Irrigation
min temperature, however it is sufficient as data input for Department (DID) and the Ministry of Higher Education
rainfall-runoff modeling. (MHE) for grant vote RDU150113.
CONCLUSION REFERENCES
Chen, H., Guo, J., Zhang, Z. & Xu, C. 2012. Prediction of
The performances of Lars- WG and SDSM model are
temperature and precipitation in Sudan and South Sudan
evaluated in this study based on the variables demanding, by using LARS-WG in future. Theoretical and Applied
calibrated and validated performances and climate Climatology 113(3-4): 363-375. doi:10.1007/s00704-012-
prediction for the interval year of ∆2050. The study was 0793-9.
focused on Pahang state, Malaysia where the climate Chu, J.T., Xia, J., Xu, C.Y. & Singh, V.P. 2009. Statistical
pattern is influenced by 2 monsoons. Thirty years length downscaling of daily mean temperature, pan evaporation,
historical records were used to calibrate, validate and and precipitation for climate change scenarios in Haihe
generate the future changes trend with consider the River, China. Theoretical and Applied Climatology 99(1-2):
atmospheric changes due to greenhouse gases level. 149-161. doi:10.1007/s00704-009-0129-6.
Hashmi, M.Z., Shamseldin, A.Y. & Melville, B.W. 2011.
In term of the parameters requirement, the Lars-WG is
Statistical downscaling of watershed precipitation using
undemanding climatic model in term of data input and gene expression programming (GEP). Environmental
simple analysis compared to the SDSM model which Modeling Software 26(12): 1639-1646. doi:10.1016/j.
requires complex procedure. Furthermore, the Lars-WG envsoft.2011.07.007.84 Hashmi, M.Z., Shamseldin, A.Y. & Melville, B.W. 2009. Tukimat, N.N.A. & Alias, N.A. 2016. Assessment the potential Statistical downscaling of precipitation: State-of-the-art and of SRES scenario for Kuala Sala, Malaysia. IOSR-JMCE application of Bayesian multi-model approach for uncertainty 13(3): 06-12. assessment. Hydrol. Earth Syst. Sci. 6: 6535-6579. Wilby, R.L. & Dawson, C.W. 2007. SDSM 4.2 - A Decision Hassan, Z. & Harun, S. 2012. Application of statistical Support Tool for the Assessment of Regional Climate downscaling model for long lead rainfall prediction in Kurau Change Impacts. Lancaster University, Science Department, River catchment of Malaysia. Malaysia Journal of Civil Environment Agency of England and Wales Department of Engineering 24(1): 1-12. Computer Science, Loughborough University, UK. Hamidon, N., Harun, S., Malek, M.A., Ismail, T. & Alias, N. Yano, T., Aydin, M. & Haraguchi, T. 2007. Impact of climate 2015. Prediction f paddy irrigation requirements using change on irrigation demand and crop growth in a statistical downscaling and cropwat models: A case study Mediterranean environment of turkey. Sensors 7(10): 2297- from Kerian Irrigation Scheme in Malaysia. Jurnal Teknologi 2315. 76(1): 281-288. Ismail, M., Suroto, A., Ismail, N.A. & Latif, M.T. 2014. Surface ozone trend in major rice growing areas in Malaysia. Sains Nurul Nadrah Aqilah Tukimat*, Ahmad Saifuddin Othman, Malaysiana 43(3): 321-329. Saffuan Wan Ahmad & Khairunisa Muthusamy Kwan, M.S., Fredolin, T.T. & Juneng, L. 2013. Projected Faculty of Civil Engineering & Earth Resources changes of future climate extremes in Malaysia. Sains Universiti Malaysia Pahang, Malaysiana 42(8): 1051-1058. 26300 Kuantan, Pahang Darul Makmur Lee, J.H.W. & Lam, K.M. 2004. Environmental hydraulics and Malaysia sustainable water management two volume set. Proceedings of the 4th International Symposium on Environmental Nurul Nadrah Aqilah Tukimat*, Saffuan Wan Ahmad & Hydraulics & 14th Congress of Asia and Pacific Division. Khairunisa Muthusamy International Association of Hydraulic Engineering and Centre for Earth Resources Research & Management (CERRM) Research, 15-18 December, Hong Kong. Universiti Malaysia Pahang Mohsen, S., Zulkifli, Y., Milad, J. & Fadhilah, Y. 2014. 26300 Kuantan, Pahang Darul Makmur Development of generalized feed forward network for Malaysia predicting annual flood (depth) of a tropical river. Sains Malaysiana 43(12): 1865-1871. *Corresponding author; email: nadrah@ump.edu.my Semenov, M.A. & Barrow, E.M. 2002. LARS-WG - A Stochastic Weather Generator for use in Climate Impact Studies. Received: 16 February 2017 Hertfordshire: Rothamsted Research Harpenden. Accepted: 30 June 2017 Tukimat, N.N.A. & Harun, S. 2013. The projection of future rainfall change over Kedah, Malaysia with the statistical downscaling model. MJCE 23: 67-79.
You can also read


