Webinar 2. Practical integration of climate resilience into WASH strategies and plans - Welcome to the SWA Climate Action Webinar Series
←
→
Page content transcription
If your browser does not render page correctly, please read the page content below
Welcome to the SWA Climate
                    Action Webinar Series

Webinar 2. Practical integration of climate
resilience into WASH strategies and plans

April 20th 2021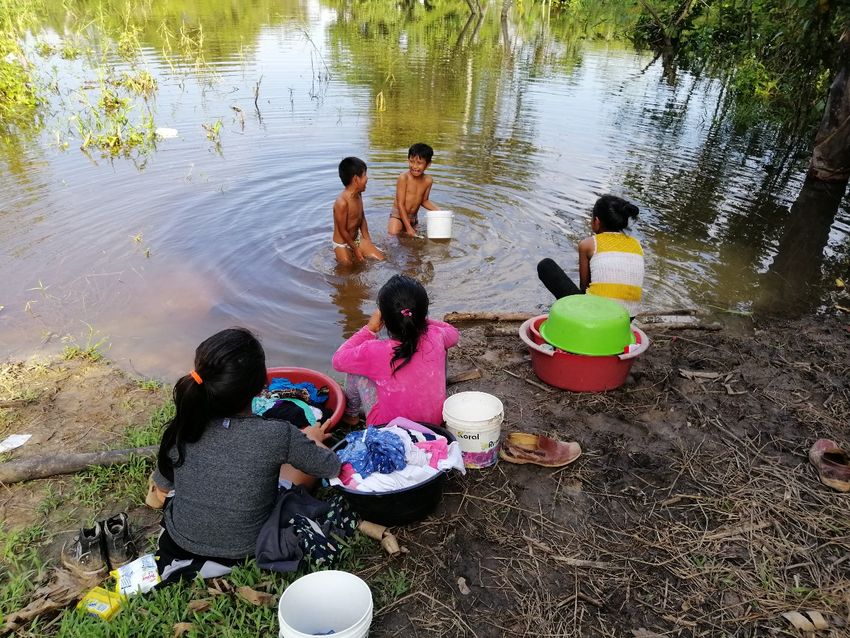
Situating the Webinar Series

                                   WEBINAR 3

                                  FINANCE OF THE WASH
                                       RESPONSE

              WEBINAR 1     YES

                                                                                      SWA Mutual Accountability Mechanism
                                                                     IDENTIFICATION
                                                                     AND APPRAISAL
                                                                        OF WASH
                                  Multi stakeholder space                                  INTEGRATION INTO
                  POLICY
                                                                       SOLUTIONS
STAKEHOLDER
                                                                                              CLIMATE AND
                 ANALYSIS
  MAPPING                                                                                    WASH POLICY

                                       WEBINAR 2

                                      WASH RISK ASSESSMENT

                                            Hazard Assessment
                            NO
                                          Exposure Assessment

                                          Vulnerability Assessment
                                           Capacity Assessment

                                                                                                                 2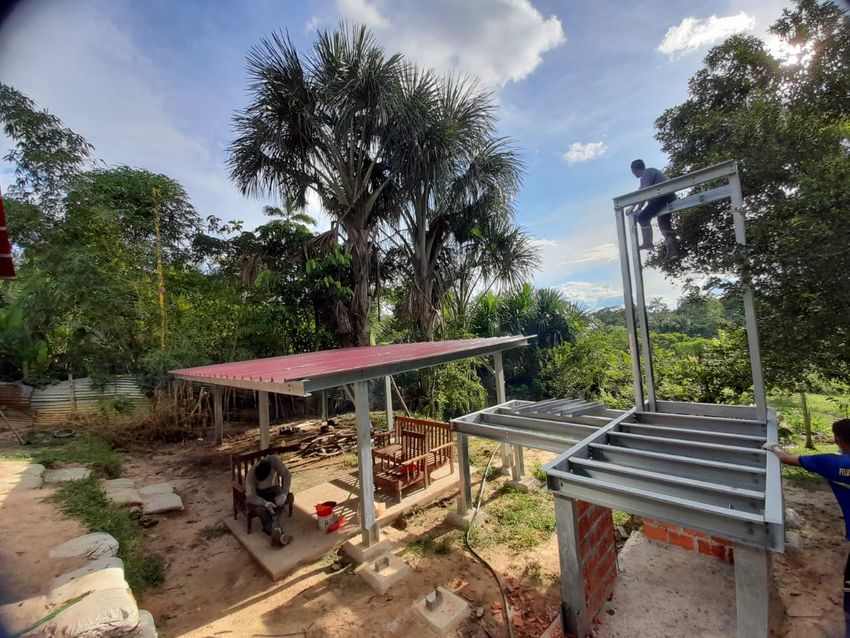
Overview of this presentation

•   Opening and introduction. Jose Gesti, SWA

•   Presentation 1: Risk Assessments for WASH.
    Kidanemariam Jembere, GWP
•   Presentation 2: WASH climate resilient options: A
    Generic result frameworks. Silvia Gaya, UNICEF
•   Bolivia Case Study: Development of a National
    WASH Risk Assessment. Fernando Salazar,
    Universidad Mayor de San Simón

•   Perú Case study: Climate Resilient Sanitation in flood
    areas. Juan Francisco Miranda. Programa Nacional de
    Saneamiento Rural.

•   Discussant 1. Remarks on Climate Resilient Water
    and Sanitation Safety Planning. Rory Moses
    McKeown, WHO.

•   Discussant 2. Remarks on the WaterAid Water
    Security Framework and its implementation. Jonathan
    Far, WaterAid.
•   Q&A
                                                             3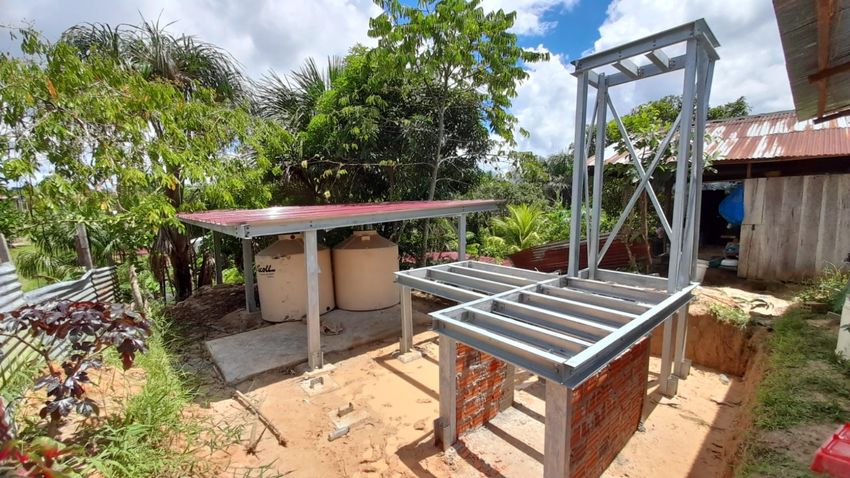
SWA Climate Webinar Series
                    Webinar 2: Practical integration of climate
                    resilience into WASH strategies and plans

                    Climate Risk Analyses for WASH

                                        Kidanemariam Jembere-Technical Advisor
                                      GWP Africa Coordination Unit/Southern Africa
                                                              Tuesday 20 April 2021

23 March   202   ADC World Water Day 2021                        www.gwp.org/en/GWP-
                                                                  www.gwp.org/en/GWP-SouthernAfrica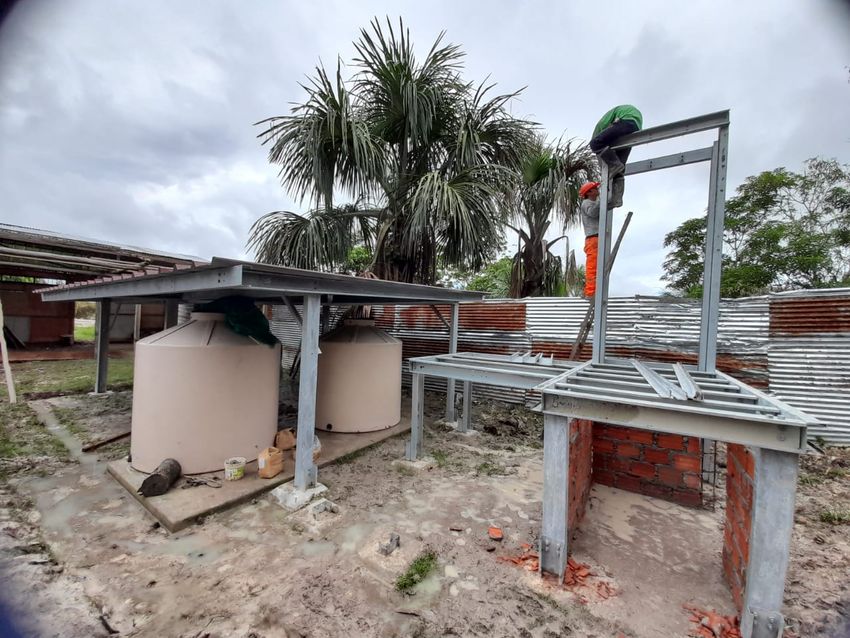
WASH Climate Resilient Development

A risk assessment: “a                              Identifying,
methodology to             Risk Assessment         Appraising &
determine the nature          for WASH              Prioritizing
and extent of risk by                                Options
analysing potential
hazards and evaluating
existing conditions of
vulnerability that
together could
potentially harm
exposed people,
                                                    Integrating CR
property, services,
                              M&E for CR              into WASH
                               WASH                strategies/Plans
livelihoods and the
environment on which
they depend”.
Adapted from UNISDR
terminology on Disaster
Risk Reduction,
UNISDR (2009)

                           https://www.gwp.org/en/WashClimateResilience/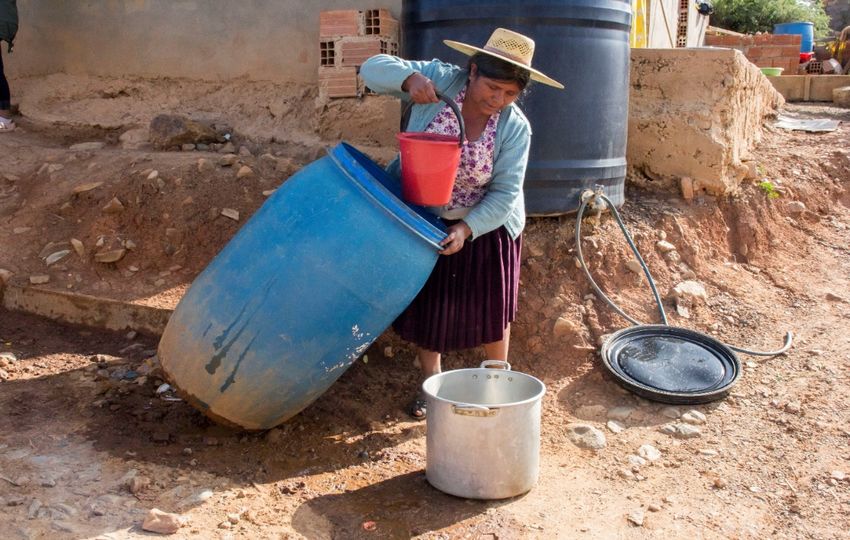
Understanding Climate Risk

                                              Risk results from the interaction of hazard, exposure
                  Communities
                   , instituions
                                              and vulnerability. Capacity also influences risk: high
                                              capacity reduces risk
                                   Capacity
Flood

                    Flood
                    prone
                    areas

            Adapted from IPCC

                                                             ü Who,
                                              ü What is
                                                               What is       ü How            ü What
                                                the
                                                               exposed         vulnerabl        capacit
                                                hazard?
                                                               to              e are            ies
 Risk Analysis:                               ü What is
                                                               hazard,         those            exist to
                                                its
                                                             ü what is         exposed          influen
                                                nature &
                                                               the             to hazard        ce risk
                                                extent
                                                               extent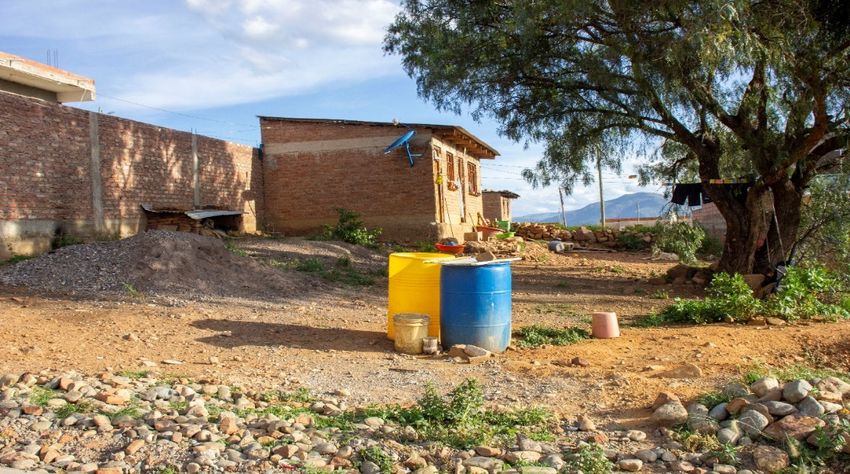
Components of exposure, vulnerability and capacity

Hazard

                   Exposure         Vulnerability          Capacity

                                    FLOOD
                                  Communities that       those that are
                 Communities    are residing in flood-       poor &
                 exposed to         prone areas          no road access
                 flood hazard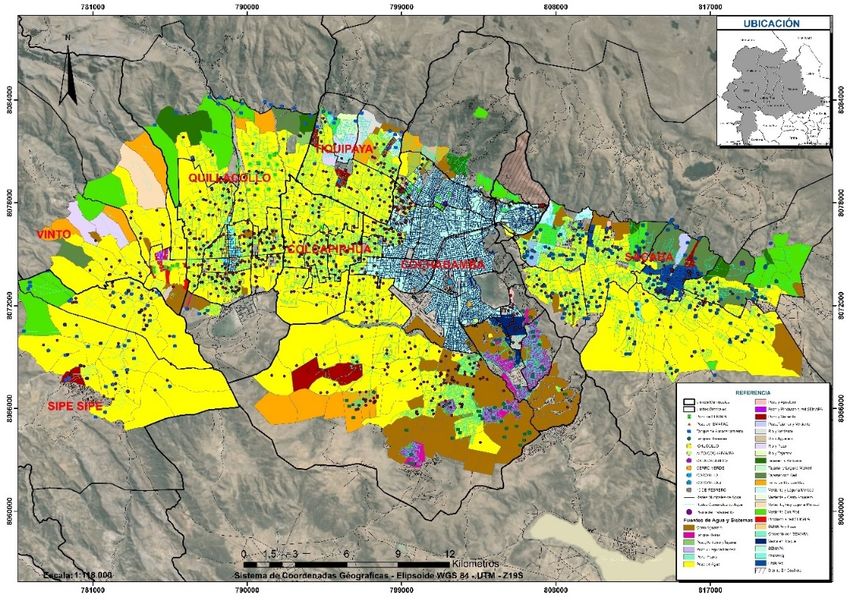
Assessment Approach

       Climate Risk Analysis
               Tool

https://www.gwp.org/en/WashClimateResilience/
Assessing Hazards

                         Hazard           Frequency          Duration     Intensity       Geographic extent       Time of year
   Step 1: Identify
      Hazards

                         High-level assessment                     Detailed climate assessment
Step 2: Score Hazards
                         Score each hazard (1 to 3) based on the   Score each hazard (1 to 3) based on a range of characteristics of
                         main characteristic(s) of the hazard      the hazard which may result in more than one risk

              One characteristic scoring system:                                               Two characteristics:
Assessing Hazards

                                    High-level assessment                               Detailed climate assessment
    Step 3: Assign a
                                    One confidence score is assigned for each Two confidence scores are assigned, one for the hazard in the
   confidence score                 hazard                                    present day and one for hazard in future

                                    Hazard                Hazard score      Present day        Confidence    Future                  Confidence

                                                                                                             Not expected to occur
                                    Landslide                    L          Rarely occurs           M                                     H
                                                                                                             more frequently
                                                                            Low frequency,                   Low frequency, high
                                    Tropical Cyclone            M                                   H                                    M
                                                                            high intensity                   intensity

 Classification of confidence

    § High Confidence: Based on reliable information or analysis with a strong theoretical basis and widely accepted within the
      sector.
    § Medium Confidence: grounded in theory, using accepted methods and with some agreement across the sector.
    § Low Confidence: view based on limited information or very basic estimation methods.

Based on the classification of confidence from Defra (2012) Climate Change Risk Assessment
Methodology Report, UK 2012 Climate Change Risk Assessment, Defra, London.
Assessing Exposure
High-level assessment Detailed climate assessment
Step 1: Identify Use stakeholder engagement to Supported by more evidence and expert knowledge
exposure identify and score exposure
In identifying exposure, check whether the hazard will affect:
Hazard Exposure • Any people (if so, any specific groups such as children)
Flooding People, infrastructure (latrines), • Critical infrastructure
• Water sources (if so, are these primary water sources?)
• Any other types of assets in the area
Step 2: Score Hazard Exposure High Medium Low
exposure
Flooding People 1
Flooding infrastructure (latrines), 3
Some suggested
indicators of exposure
to help scoringAssessing Vulnerability
High-level assessment Detailed climate assessment
Step 1: Select
vulnerability Get a single score for each component Score factors for each component
elements/questions
High-Level assessment
Component Element/Question Assessment High Medium Low
Step 2: Score Environmental degradation is high
Rate of environmental degradation
components of Environmental
Are water sources adequately protected?
Water sources are not adequately 3
protected
vulnerability
Detailed assessment
Component Element/Question Assessment High Medium Low
Rate of environmental degradation Environmental degradation is high 3
Environmental
Water sources are not adequately
Are water sources adequately protected? 3
protectedAssessing Capacity
Step 1: Select High-level assessment Detailed climate assessment
capacity
elements/questions Scores to prioritize risks to identify CR WASH options. Scores
Identify elements/questions
not used to determine the overall risk score
High-Level assessment
Step 2: Score Component Element/Question Assessment
components
Are there any community preparedness plans? There are plans but not detailed enough
Social Are social networks in place? There are social networks useful for capcity to
respond
Detailed assessment
Component Element/Question Assessment High Medium Low
Are there any community preparedness There are plans but not detailed
2
plans? enough
Social
There are social networks useful for
Are social networks in place? 3
capacity to respondRisk Prioritization
Hazard Exposure Vulnerability Risk
Description Score Description Score Description Score Score Rank
Physical-infrastructure- Human-
Flooding 3 3 2 18 1
latrines communities
Land sliding 2 Environmental 2 Environmental 3 12 2
Tropical cyclone 2 Physical 3 Social 3 18 1
Check the following:
§ Are you satisfied with the total number of risks to take forward for further analysis?
§ Are there any risks in the prioritised list that you think should not be included?
§ Are there any risks not in the prioritised list that you think should be included?Sensitivity Analysis § Conduct sensitivity analysis for any hazards, exposures and vulnerabilities when there is uncertainty or disagreement. Take another look at the way they have been scored especially where there is a low or medium confidence score. This helps to know whether the outcome would change if scored differently § Sensitivity analysis is useful as it enables further investigation of the scores and can be used to ensure that there is agreement across the group involved in the assessment. For example you might score flooding based on its frequency and intensity, but not sure whether it would be best to score it based on the geographical extent § Sensitivity analysis can be done when a specific step has been completed, or it can be done at the end of the process when you are compiling and prioritizing the list of risks.
Thank You
A Strategic
Framework
for Climate
Resilient
WASH
options

 April 2021
Outline of the presentation

• The Sector Wide GWP-
  UNICEF Strategic Framework
  for Climate Resilient WASH
  development

• Climate Resilient WASH
  options
A Sector wide Strategic framework for Climate
Resilient WASH Development

Also in French/Spanish/Portuguese
Climate resilient WASH options to ensure 3
key objectives

           1                             2                             3

     Ensure that WASH           Ensure that resilient WASH
infrastructure and services    systems contribute to reduce Advance towards a low carbon
                                                                    WASH sector
 are sustainable, safe and        vulnerability and build
resilient to climate related     community resilience to
            risks                 adapt to the impacts of
                                      climate change
Climate resilient WASH options at 3 strategic levels 1. National level 2. Subnational/Watershed level 3. Local & Project level
Results Framework for WASH Climate Resilience
OUTCOME

                        WASH infrastructure and services are sustainable and resilient to climate related
                        risks; and WASH contributes to build community resilience to climate change

                        NATIONAL LEVEL          SUBNATIONAL /             PROJECT & LOCAL LEVEL
INTERMEDIATE OUTCOME

                                                 WATER BASIN
                        1. An ENABLING
                                                    LEVEL                                4. Climate
                        ENVIRONMENT                                  3. ACCESS to
                        conducive to          2. Water resources     climate resilient   resilient
                        climate resilient     are MONITORED          WASH                BEHAVIORAL
                        WASH services         and MANAGED            infrastructure      CHANGE and
                        and communities       considering climate    and services        GOVERNANCE at
                                              risks to WASH                              community and
                                              services                                   local level
Thank You
© UNICEF/SUDA2014-XX228/NooraniEstudio de caso de Bolivia: Desarrollo de una evaluación nacional de riesgos WASH Expositor: Fernando Salazar Ortuño, Docente – Investigador IESE, Universidad Mayor de San Simón (UMSS) Abril 2021
EXPERIENCIA DE APLICACIÓN DE
       Taskforce Cambio Climático WASH BAT Nacional
                        EN BOLIVIA
• 2021 Población de 11.842.000.

•   Compromisos internacionales.

•   2001 – 2015. Objetivos del milenio: El 79% de cobertura de agua y 50% de saneamiento.

•   Agenda 2030: Objetivo es agua asequible y limpia para todos.

•   2030 Poner fin a la defecación al aire libre.

• SITUACIÓN DEL AGUA EN BOLIVIA.

• 2020. Proyección

• Área urbana es llegar a 95 % de agua potable y 80 % de saneamiento

• Sector rural alcanzar el 70 % de agua y 60% de saneamiento.

•   2025

•   100% cobertura de agua.
SITUACIÓN DE ABASTECIMIENTO DE AGUA EN CAPITALES DE BOLIVIA
• Multisistemas de agua en área metropolitana de CochabambaSITUACIÓN DE ABASTECIMIENTO DE AGUA EN CAPITALES DE BOLIVIA
SITUACIÓN REGULAR DE ABASTECIMIENTO DE AGUA
SITUACIÓN DE ABASTECIMIENTO DE AGUA EN MOMENTOS DE CRISIS
PROCESO DE APLICACIÓN
                          Taskforce Cambio Climático WASH BAT
1.   Creación de plataforma nacional de expertos en temática de agua para consumo humano y
     alcantarillado.

Participan más de 18 representantes de instituciones académicas universitarias, Centros de Investigación,
ONG´s y Consultores del país.
Socialización de la propuesta metodológica por equipo SIWI-UNICEF.
Se define una agenda de trabajo.

2. Se ajusta las prioridades de los componentes de la metodología WASH BAT al contexto nacional
                                              •   Floodings
         Amenazas                             •   Droughts
                                              •   Glacier retreat
                                              •   Minig pollution
         Exposición                           •   Waste water pollution
                                              • Forest fires
         Vulnerabilidad                       • Agroindustry pollution
- FLOODINGS -
Low extension, high intensity High extension, high intensity
Very high (approx. 84% of the country's Medium – 2 points High – 3 points
A. Score system –
Intensity
municipalities), mainly covering the
Low extension, low intensity High extension, low intensity
departments of Pando, Beni (Amazon area present days Low – 1 points Medium – 2 points
and floodplains), northern La Paz (Amazon
Geographical extent area), northern Cochabamba (Chapare area)
and part of Santa Cruz (integrated northern
Geographical extent
area, Chiquitanía, Llanos). It also affects urban
areas in the form of landslides (e.g. La Paz,
Tiquipaya, etc.).
Frecuency High recurrence. Low extension, high intensity High extension, high intensity
Duration High, 6 months.
B. Score system – Medium – 2 points High – 3 points
Intensity
High. The intensity of the hazard is higher expected future Low extension, low intensity High extension, low intensity
Intensity
with the phenomena of El Niño or La Niña.
Low – 1 points Medium – 2 points
Time of year Rainy season, from October to March
For the scenarios RCP2.6 and RCP8.5 an
increase in water supply is expected in the Geographical extension
Expected future basins of the extreme north and east of the
country that would result in a high risk of Geographical extension, Intensity
flooding. Class Score
Present days Expected future
Other High extension, high
Increases the succession of slides. High High extension, high intensity 3
characteristic? intensity
C. Clasification Medium
High extension, low High extension, low intensity; or High extension
2
intensity and expected to increase in intensity
system
Low extension, High Low extension, high intensity; or expected to
Medium 2
intensity increase in extension, High intensity
Low extension, low Low extension, low intensity; or not
Low 1
intensity expected to occur in the future- DROUGHTS -
High (approx. 67.06% of the country's
municipalities). Mainly areas of the Altiplano Low extension, high frecuency High extension, high frecuency
in the departments of Cochabamba, Oruro, Medium – 2 points High – 3 points
Frecuency
Geographical extent Potosi and La Paz; inter-Andean valleys of A. Score system – Low extension, low frecuency High extension, low frecuency
Cochabamba, Chuquisaca and Tarija; and the
Chaco in the departments of Tarija, Santa Cruz
present days Low – 1 points Medium – 2 points
and Chuquisaca.
Frecuency Medium recurrence. Geographical extension
Duration High, all the year.
High and incremental for cumulative effects
year after year. The intensity of the threat is Low extension, high frecuency High extension, high frecuency
Intensity
high and when the phenomena of the girl or Medium – 2 points High – 3 points
Frecuency
boy is much greater. B. Score system –
Low extension, low frecuency High extension, low frecuency
Time of year
Dry season, from April to September, and wet expected future Low – 1 points Medium – 2 points
season, from October to March
In the RCP2.6 and RCP8.5 scenarios, the
Pilcomayo basin and the Altiplano macro- Geographical extension
Expected future basin will have high and very high scarcity
rates, reducing water supply by more than
50% with respect to 2015 values.
Geographical extension, frecuency
Triggering factor for other adverse and Class Score
catastrophic events such as glacier retreat and Present days Expected future
Other High extension, high
forest fires. They are closely linked to the High High extension, high frecuency 3
characteristic? frecuency
phenomena of land use change and
deforestation. C. Clasification Medium
High extension, low High extension, low frecuency; or High extension
2
frecuency and expected to increase in frecuency
system
Low extension, High Low extension, high frecuency; or expected to
Medium 2
frecuency increase in extension, High frecuency
Low extension, low Low extension, low frecuency; or not
Low 1
frecuency expected to occur in the future- GLACIER RETREAT-
Muy alta. Las consecuencias de esta amenaza
Geographical extent
se extienden a escala nacional.
Alta, incrementándose en la fase ENSO – El
Frecuency
Niño.
Duration Continua, todo el año.
Muy alta, las pérdidas de espesor se
Intensity
encuentran entre 600 a 1000 mm.
Todo el año, mayor en la época húmeda (de Intensity
Time of year Class Score
octubre a marzo). Present days Expected future
El aumento de las temperaturas esperadas en High or expected to increase in
High High intensity 3
los Andes generará un incremento del A. Clasification the future
derretimiento de los glaciares, que se verá Not expected to increase in the
Expected future
acelerado también por el hecho de que la system Medium High intensity
future
2
mayoría de los glaciares han alcanzado su
Medium Low intensity Expected to increase in the future 2
pico hídrico o están a punto de hacerlo.
Factor desencadenante de otros eventos Not expected to increase or occur
adversos y catastróficos como inundaciones Low Low intensity 1
in the future
Other súbitas. Están estrechamente vinculados a los
characteristic? fenómenos de cambio de uso de suelo,
deforestación, incendios forestales y
chaqueos.- MINING POLLUTION-
Low extension, high intensity High extension, high intensity
Medium-high. Katari Basin, Poopó Lake, Medium – 2 points High – 3 points
A. Score system –
Intensity
Choqueyapu, Pampa Huari River, Suches, Low extension, low intensity High extension, low intensity
Geographical extent
Cotagaita, Tupiza and Madre de Dios; Salar de present days Low – 1 points Medium – 2 points
Uyuni and Eduardo Avaroa Reserve.
Frecuency It continues throughout the year.
Duration It continues throughout the year. Geographical extension
Very high, it increases in the rainy season
Intensity because of surface washing due to runoff
water. Low extension, high intensity High extension, high intensity
Medium – 2 points High – 3 points
B. Score system –
Intensity
Time of year It continues throughout the year.
Low extension, low intensity High extension, low intensity
It is predicted to increase in the future due to expected future Low – 1 points Medium – 2 points
its strategic role in the national economy.
Recent government statements place, for
Expected future Geographical extension
example, the exploitation of Lithium as a
central element for post-COVID economic
recovery19 .
Extensión, intensidad
Clase Puntuación
Tiempo presente Tiempo futuro
It promotes deforestation processes, soil and
Alta extensión, alta
Other water removal and contamination, alteration Alto Alta extensión, alta intensidad 3
intensidad
characteristic? of hydrological systems, expropriation of
Alta extensión, baja Alta extensión, baja intensidad; o Alta extensión y
natural resources and favors social conflicts. C. Clasification Medio
intensidad se espera que incremente la intensidad
2
system Baja extensión, alta Baja extensión, alta intensidad; o se espera que
Medio 2
intensidad incremente la extensión, Alta intensidad
Baja extensión, baja Baja extensión, baja intensidad; o se espera que
Bajo 1
intensidad no ocurra en el futuro- WASTE WATER POLLUTION-
By 2016, 30.5% of the population had wastewater
Geographic treatment coverage. Greater threat to the basins of the
al extent most populated cities: La Paz, Choqueyapu, Rocha, Piraí
and Katari rivers.
Frecuency Continuous. Low extension, high intensity High extension, high intensity
Duration Permanent all year round. Medium – 2 points High – 3 points
A. Score system –
Intensity
Greater in areas with more population and economic and
Low extension, low intensity High extension, low intensity
industrial development. In the rainy season, the amount of
water collected by sanitary sewers increases, discharging
present days Low – 1 points Medium – 2 points
untreated wastewater directly to water bodies and
Intensity increasing the risk of WWTP collapse due to the Geographical extension
capacity/volume ratio. It involves the mixing of rainwater
and wastewater but not necessarily greater pollution.
Low extension, high intensity High extension, high intensity
Time of Medium – 2 points High – 3 points
Continuous. B. Score system –
Intensity
year
Low extension, low intensity High extension, low intensity
The State's planning foresees: expected future Low – 1 points Medium – 2 points
• Investment to increase PTAR coverage to 65%, with a
reduction in the level of contamination of basins and
water bodies and, in the long term, a recovery of water Geographical extension
quality.
• Greater control and supervision of domestic, industrial
and other discharges.
Georephical extention, inetnsity
• Reuse of treated water for irrigation and use of Class Score
Expected Present days Expected future
stabilized sludge as soil improvers.
future High extension, high
• Technological development in accordance with the High High extension, high intensity 3
intensity
climatological, economic and social reality (different
sanitation solutions). C. Clasification Medium
High extension, low High extension, low intensity; or High extension
2
intensity and expected to increase in intensity
• Social development with the participation of the users. system Low extension, High Low extension, high intensity; or expected to
• Development of cities with equitable access to Medium 2
sanitation and wastewater treatment services, with intensity increase in extension, High intensity
quality and climate resilience. Low extension, low Low extension, low intensity; or not
Low 1
intensity expected to occur in the future- FOREST FIRES-
Principalmente en los departamentos de Santa Low extension, high intensity High extension, high intensity
Geographical
Cruz, Beni, Tarija, Pando y parte de Cochabamba Medium – 2 points High – 3 points
extent
A. Score system –
Intensity
y La Paz.
Low extension, low intensity High extension, low intensity
Greater in the dry season, coinciding with soil present days Low – 1 points Medium – 2 points
Frecuency preparation activities (chaqueos, June/July-
September).
Duration June/july – october/november Geogrephical extension
High, serious affectations to forest areas,
agricultural lands, pastures, natural protected
Intensity
areas. Associated with droughts, which increase Low extension, high intensity High extension, high intensity
the intensity. Medium – 2 points High – 3 points
B. Score system –
Intensity
Time of year Dry season.
Low extension, low intensity High extension, low intensity
In a context of global warming and increased rate expected future Low – 1 points Medium – 2 points
of deforestation, conditions will be generated to
Expected future
increase the frequency and intensity of forest
fires. Geogrephical extension
Link to processes of change in land use due to the
advance of the agricultural frontier and the Georephical extention, inetnsity
Class Score
expansion of human settlements, loss of Present days Expected future
biodiversity, increase in GHG emissions and High extension, high
High High extension, high intensity 3
Other environmental contaminants, effect on the intensity
characteristic? melting of glaciers, contamination of water High extension, low intensity; or High
High extension, low
sources, impact on water storage in the soil, Medium extension and expected to increase in 2
impact on livelihoods, health and infrastructure.
C. Clasification intensity
intensity
Advancement of agribusiness, decree on system
Low extension, High Low extension, high intensity; or expected
transgenics. Climate and socio-cultural issues. Medium 2
intensity to increase in extension, High intensity
Low extension, low Low extension, low intensity; or not
Low 1
intensity expected to occur in the future- FOREST FIRESAGROINDUSTRY POLLUTION-
Gracias
Estudio de caso de Perú: Módulos de Sistema de
Saneamiento en Zonas Rurales: Caso Loreto

Expositor: Juan Francisco Miranda Leyva , Coordinador General del Programa de Agua Potable y
Saneamiento para la Amazonía Rural – PNSR- MVCS
Abril 2021
ÁMBITO DE INTERVENCIÓN DEL PROGRAMA AMAZONIA RURAL

                                                            LORETO
                                               PROVINCIAS DE MAYNAS, LORETO Y
           AMAZONAS                                    ALTO AMAZONAS
      PROVINCIA DE BAGUA                       DISTRITOS DE SAN JUAN BAUTISTA,
       DISTRITO DE IMAZA                            NAUTA Y BALSAPUERTO
          33 PROYECTOS                                   66 PROYECTOS
      13,810 BENEFICIARIOS                           25,173 BENEFICIARIOS
       S/ 148.5 MILLONES                               S/ 320 MILLONES
N° DE CONEXIONES DE AGUA: 3,517                N° DE CONEXIONES DE AGUA: 5,897

                                                           SAN MARTÍN
    METAS DEL PROGRAMA                            PROVINCIAS DE MOYOBAMBA Y
                                                              RIOJA
    146 Proyectos, 162 localidades,                DISTRITOS DE MOYOBAMBA,
     07 distritos, 6 Provincias                  JEPELACIO Y NUEVA CAJAMARCA
                                                          47 PROYECTOS
     63,583 Personas beneficiadas
                                                      24,600 BENEFICIARIOS
     16,368 Conexiones de Agua                         S/ 208.8 MILLONES
                                                N° DE CONEXIONES DE AGUA: 6,954
     16,650 Conexiones de Saneamiento

     US $ 275.58 millones
Antecedentes de la iniciativa
• La selva baja (Loreto, Amazonas y Ucayali) presenta
dificultades para contar con un buen sistema de agua
y saneamiento por ser zonas inundables (y que vayan
acorde al contexto cultural de la zona).
• Brecha de cobertura nacional (22.9%) en acceso a
agua. Selva baja con indicadores alarmantes. Loreto,
por ejemplo, tiene 74.9%.
• Brecha de cobertura de disposición sanitaria de
excretas alcanza un 70.4% que representa una
población estimada de 4,844,088 habitantes del
ámbito rural.Antecedentes de la iniciativa • Prioridad para el país. Plan Bicentenario, Plan Nacional de Saneamiento y ODS 6 y 8. • Todo Proyecto del Programa se articula a nivel institucional y comunal: Gobierno Regional, Gobierno Local, Federaciones nativas y comunidad en general. • Presupuesto estimado: El módulo de saneamiento para zonas rurales contempla captación de agua de lluvia y Unidad Básica de Saneamiento. Promedio de 60,000 soles (US $ 20 Mil aprox).
Teoría de cambio
                  Enfermedades
                     diarreicas
                                      Instalación de
Temporada de          agudas,
                                        módulos de
    lluvia en         anemia,
                                       saneamiento
   Amazonía        desnutrición
                                        para zonas
(inundaciones)    crónica infantil,
                                          rurales
                      dengue,
                      muerte
                                         Reducción de
  Consumo de
                                        enfermedades.
 agua no segura
                                        Ahorro en salud
Río contaminado
                                         para el Estado
 Disposición de
                                       (Aprox. 150 soles
     excretas
                                              por
  inadecuada
                                         persona/año)
Módulos de sistema de saneamiento para zonas rurales
Sistema de captación de agua de lluvia
            Componentes del Sistema:
            1. Techo de Aluzinc (40 a 50 m2)
            2. Tanque de 250 litros, para las primeras aguas (polvo, maleza, etc.)
            3. Dos tanques de almacenamiento de 2,500 litros.
        3
            4. Bomba manual.
            5. Clorador en Línea.
            6. Tanque elevado de 250 litros.                             6
2

                4         5

1
Unidad Básica de Saneamiento con compostera
2
1 UBS ecoinodo Ducha 5 ventan
r
a
4
6 lavadero
Lava manos
3Desafíos y Lecciones aprendidas
Desafíos Lecciones aprendidas
• Acercamiento a la población de • Diálogo con las autoridades
comunidades nativas. comunales y Federaciones.
• El factor climatológico limita la • Ingreso y planificación de
ejecución de los Proyectos de proyectos en meses sin lluvia e
manera mas dinámica. inundación y aplicar plazos cortos
• Empresas contratistas dispuestas para la ejecución oportuna.
a ejecutar en zonas agrestes • Enfoque intercultural e
• Llegar al lugar más recóndito de involucramiento a todo nivel.
la Amazonía Rural. • La implementación de la
• Cerrar brecha en temas de agua y infraestructura es un medio para
saneamiento. lograr el objetivo. Se requiere un
• Contribuir a la erradicación de fuerte acompañamiento social.
EDAS, anemia y desnutrición
crónica infantil.Proceso constructivo del Proyecto del Centro Poblado 13 de
febrero, Nauta, Iquitos
• N° de beneficiarios: 667 habitantes
• N° de conexiones domiciliares: 182
• Monto de inversión: US $2.66 millones¡GRACIAS!
Discussant 1: Remarks on Climate Resilient Water and
Sanitation Safety Planning.

Rory Moses McKeown. Senior Technical Consultant at
WHO
Discussant 2: Remarks on the WaterAid Water Security
Framework and its implementation.

Jonathan Far. Senior Climate Advisor, WaterAid.
Thank You!
We see you soon: Webinar 3 on WASH and Climate
Financing (April 29th)
The video recordings and presentations of webinars 1 and 2
are available on SWA website
For questions or comments, please email at:
lucinda.ohanlon@sanitationandwaterforall.org
Jose.gesti@sanitationandwaterforall.org
You can also read


