Impact of Climate Change on Cereal farming in Morocco Case study: Rommani (Rabat-region), Bouregreg watershed centre
←
→
Page content transcription
If your browser does not render page correctly, please read the page content below
Impact of Climate Change on Cereal farming in Morocco Case study: Rommani (Rabat-region),
                                 Bouregreg watershed centre

                        Turkish Online Journal of Qualitative Inquiry (TOJQI)
                             Volume 12, Issue 7, July 2021: 6026 - 6052

                                           Research Article

         Impact of Climate Change on Cereal farming in Morocco
      Case study: Rommani (Rabat-region), Bouregreg watershed centre

            El Houssaine OUHARBAa*, Zine el abidine TRIQUIa , Rachid MOUSSADEKb
      a
        University Mohammed V-FSR, Rabat .Avenue Ibn Battouta, Rabat-Agdal, Boite Postale 1014
                                               RP – Morocco.
                    *Corresponding author          E-mail : Ouharbaelhoussine@yahoo.fr
      a
        University Mohammed V-FSR, Rabat .Avenue Ibn Battouta, Rabat-Agdal, Boite Postale 1014
                                 RP – Morocco. E-mail : triqui@fsr.ac.ma
      b
        Division Scientifique, Département Environnement et Ressources Naturelles (INRA), Avenue
                                  Hassan II, B.P. 415 - Rabat R.P – Maroc.
                                    E-mail: rachidmoussadek@yahoo.fr

Abstract

The objective of this work to describe meteorological conditions of the areas to cereal development,
for answer the effect treating problematic of climatic fluctuations on increasing, development and
cereal production in Rommani (Rabat area), Bouregreg watershed centre.
This study our permit to interpret relation between cereal comportment and meteorological
conditions, using agro-climatic contribution and cereal development to increasing model.
A realized work contribuing the research on cereal harvest prediction and water - agricultural
management. The adoption « Crop-Syst » model would help to alert agricultural drought and cereals
yields predictions In advance to quantifier.
Key-words: Agro-meteorology, Modeling, Climate, Watershed, Cereals, Agricultural
             production Rabat-Morocco.

1. Introduction
The Intergovernmental Panel on Climate Change (IPCC) estimated in 2001 that most of the warming
observed over the last 50 years is due to human-induced greenhouse gases. According to the same
source, the continuation of these emissions without a serious reduction policy would increase the
global temperature from 1.4 to 5.8 ° C between 1990 and 2100, and the average sea level from 9 cm to
88 cm during the same period , and would continue to increase for centuries. The hydrological cycle

                                                                                                 6026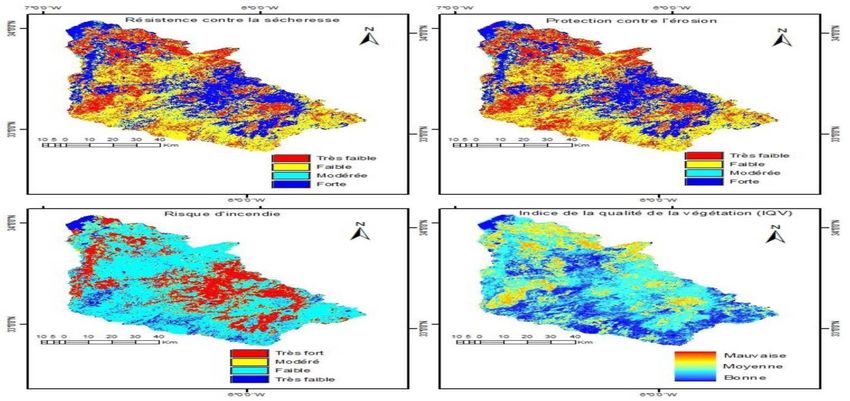
El Houssaine OUHARBAa*, Zine el abidine TRIQUIa , Rachid MOUSSADEKb

will be intensified, leading to more droughts in some areas and floods in others (Houghton 2004, Le
Treut et al 2004).
The IPCC (2007) assessed available scientific information on the impacts of climate change on
ecosystems, socio-economic sectors, including the food chain, water resources and human health. The
agricultural sector is one of the sectors most vulnerable to climate risks

2. Material and Methods

The Agro-Climatological methodology applied in this work as tools of management and decision
support is the first established on the study area "Experimental Domain of Marchouch in Rommani
(CRRA, INRA - Rabat), by the work of research of my Master thesis (OUHARBA, 2011). And that I
extend in the studies of perspectives in my Ph.D thesis by an assessment of water and agricultural
vulnerability in the watershed of Bouregreg, in the face of climate change.
2.1. Study Site

         Figure 1: geographical position of the watershed Oued Bouregreg (Google Earth)

Geographical location:
Coordinates: Latitude: 33 ° 60'41 N
             Longitude: 6 ° 71'60 W
             Altitude: 339 M

The rural commune of Marchouch is delimited at:
- North by the rural municipality of Sidi Bettach
- South by the rural municipality of Ezzhiliga
- East by the rural municipality of Brachoua
- West by the rural municipality of Had Ghoualem.

                                                                                              6027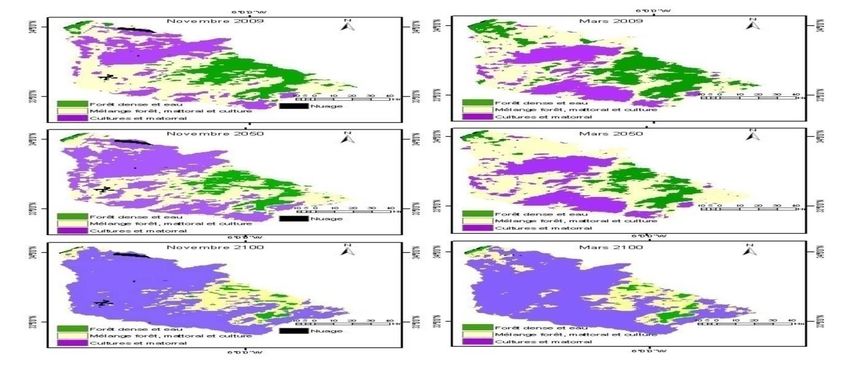
Impact of Climate Change on Cereal farming in Morocco Case study: Rommani (Rabat-region),
                                Bouregreg watershed centre

Figure 2: Location of the Bouregreg Basin (El Agbani et al., 1992)

2.1.1. Topography

     Figure 3: Hypsometric map of the Bouregreg watershed.

 Figure 4: Overview of the topography and landscape of the Middle Bouregreg.

   Table 1: Relief of the Region of Rommani

                                                                                        6028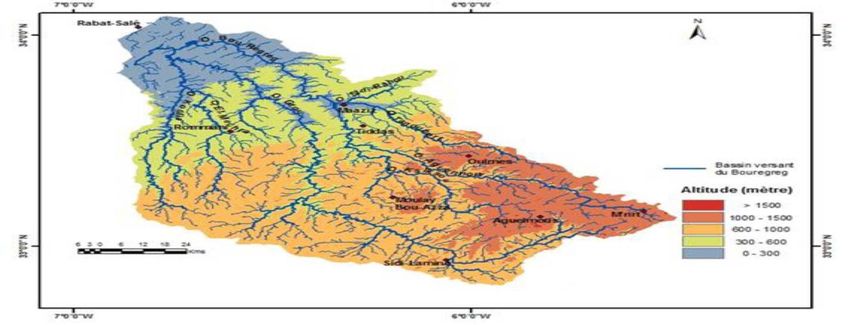
El Houssaine OUHARBAa*, Zine el abidine TRIQUIa , Rachid MOUSSADEKb

      Plain                       13%      24%             25%                18%

      Tray                        81%      27%             27%                54%

      Mountains and hills         0%       21%             2%                 8%

      Valleys and bowls           6%       29%             46%                20%

      Area in ha                  44 381   31 631          11 727             87 739

      Area in %                   51%      36%             13%                100%
     Source: Rommani Works Center, DPA Khemisset, Rabat-Sale DRA.

2.1.2. Pedology

     Figure 5: Soil map of the Bouregreg catchment area.
 Table 2 : Rommani Soils Texture.
 Floor Type              Brachoua               Marchouch        J.                  Total
                                                                 Moullabled
 Shots                   15 533                 21 207           3 987              46%
 Hamri                   8 876                  5 381            3 870              21%
 Rmel                    0                      0                0                  0%
 Hrach                   19 972                 5 133            3 870              33%
 Area in ha              44 381                 31 721           11 727             87 829
 Area in %               51%                    36%              13%                100%

  Source : CRRA, INRA-Rabat.
Table 3 : Soil texture of the Marchouch Experimental Estate.

Depth (cm)        Clay      Silt (%)       Sand (%)             pH
                  (%)

                                                                                             6029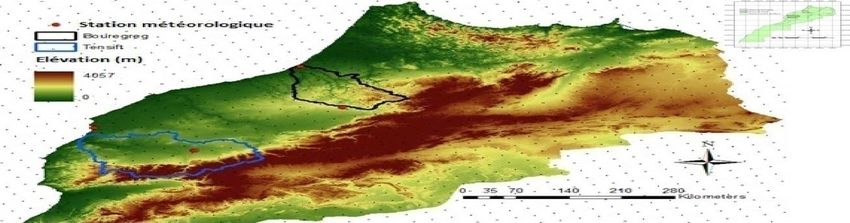
Impact of Climate Change on Cereal farming in Morocco Case study: Rommani (Rabat-region),
                                 Bouregreg watershed centre

   0-20           50,0         37,3             12,7                   7,8

   20-40          51,3         38,2             10,5                   8,2

   40-90          52,5         35,1             12,4                   8,6

Source : CRRA, INRA-Rabat
2.1.3. Agricultural production

Table 4: Area of Exploitations of Rommani Region in (ha)
    Area in (ha)          Brachoua         Marchouch                   Jemaa Moullabled   Total

           0-5                 39%                 58%                       64%          53%

           5-10                23%                 16%                       19%          20%

          10-20                18%                 15%                       9%           14%

          20-50                 9%                     6%                    5%            7%

           >50                 11%                     4%                    3%            6%

      Number                   1114                    857                   1075         3046

                               37%                 28%                       35%          100%
           %
  Source : Rommani Works Center, DPA Khemisset, DRA Rabat-Sale.

            Table 5: Area of Major Agricultural Productions in the Region

           (Average of 1995 to 2003) in (ha).                  Ha                   %

           Cereals                                           244.550                66

           Legumes                                           28.240                 7.5

           Fruit plantations                                 21.101                 5.6

           Vegetable growing                                  7.151                 1.9

           Forage crops                                      18.500                 5

           Industrial crops                                   2.420                 0.6

                                                                                                 6030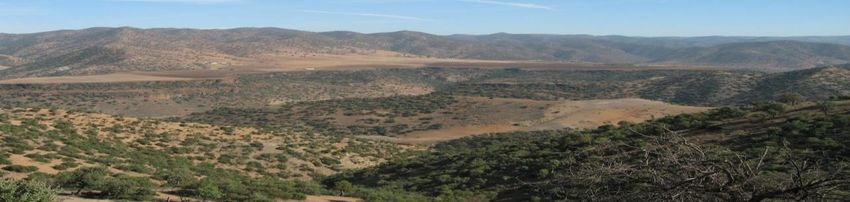
El Houssaine OUHARBAa*, Zine el abidine TRIQUIa , Rachid MOUSSADEKb

  Tropical crops                               2190                 0.6

  Source : DPA Khemisset 2004

Table 6: Yields Achieved for the Main Cultures of the Region in (Qx/ha)

  Species                              Averages yield in (Qx/ha)
  Cereals
  Soft Wheat                                           11.11
  Hard Wheat                                            9.8
  Barley                                                9.6
  Corn                                                  6.5
  Triticale                                             19.0

  Legumes
  Bean                                                   7.3
  Pea                                                    7.3
  Lens                                                   7.5
  Chickpea                                               7.7
  Haricot                                                7.1

  Forage crops
  Oat                                                    30
  Fodder barley                                         14.7
  Rye                                                   28.7
  Oats vetch                                            34.4
  Lupine                                                33.6
    Source : DPA Khemisset 2004

                                                                           6031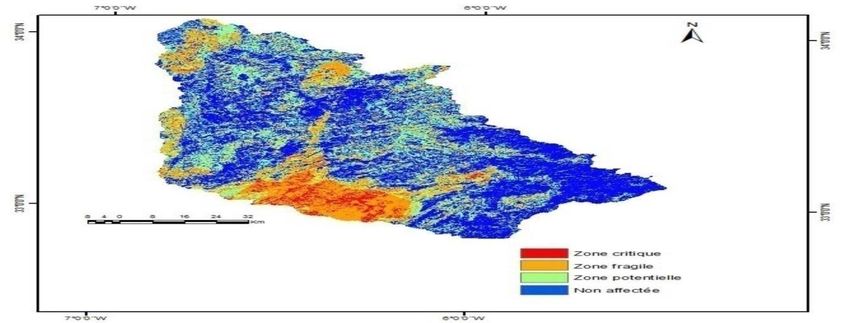
Impact of Climate Change on Cereal farming in Morocco Case study: Rommani (Rabat-region),
                               Bouregreg watershed centre

    Figure 6: Cultural Calendar of the Bouregreg Watershed

Figure 7: Main vegetation of the Bouregreg Basin (Source: CERGEO)

                                                                                       6032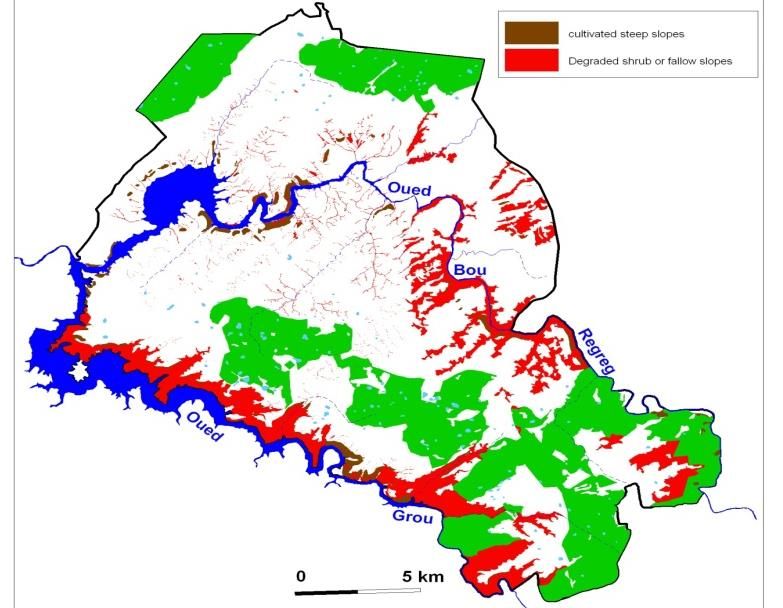
El Houssaine OUHARBAa*, Zine el abidine TRIQUIa , Rachid MOUSSADEKb
Figure 8: Agriculture on Balanced Land (Favorable Land) - Diversification and Irrigation -
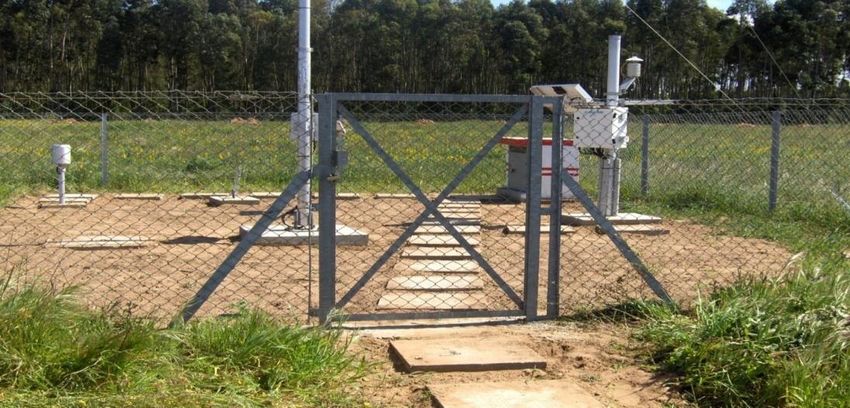
2.1.4. Climatology
Figure 9: Classical Climatological Station Type (Source: SEE)
Figure 10 : Automated Weather Observing Station Type (Source: DMN)
6033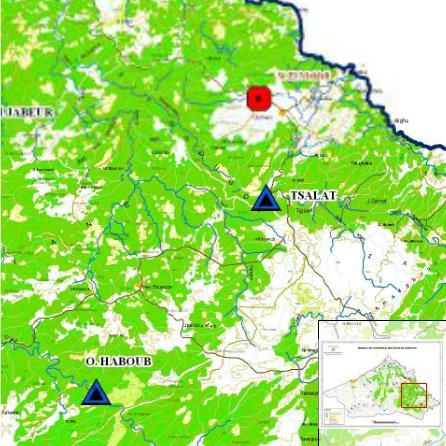
Impact of Climate Change on Cereal farming in Morocco Case study: Rommani (Rabat-region),
                                 Bouregreg watershed centre

Figure 11: Main hydrometric stations in the Bouregreg basin (Based on the map of
           the ABHBC)

      Figure 12 : Map of Isohyets.

                                                                                         6034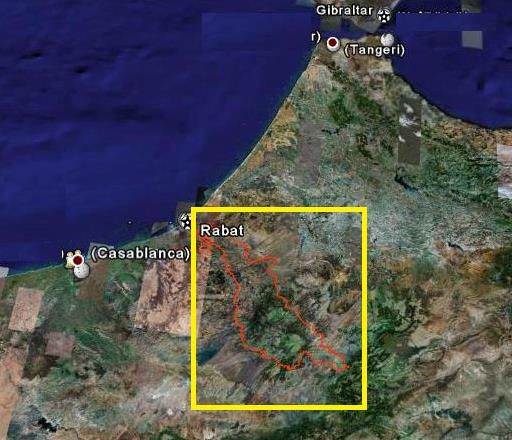
El Houssaine OUHARBAa*, Zine el abidine TRIQUIa , Rachid MOUSSADEKb

         Figure 13: Evolution of the rainfall Series in the Bouregreg Basin (in mm)

Ombro-thermic diagram

According to the Bagnouls and Gaussen ombro-thermic diagrams of the stations for which data are
available, it turns out that the dry period corresponds to the months of June to September for all
stations as shown in( Figures 14 and 15).

                                             Station de Tiddas

  100
   80
   60                                                                                            P
   40                                                                                            2T
   20
    0
          nv      v      r       r       i      in        il  t   t             t      v  c
        Ja      Fe     Ma      Av      Ma     Ju        Ju Aou Sep            Oc     No De
                                                        Mois

Figure 14: Ombro-thermic curve of the Tiddas station.

                             Station Moulay Bouazza

   120
   100
    80                                                                                           P
    60
    40                                                                                           2T
    20
     0
               Janv

                                                                                     Nov
                                                 Juin
                                                         Juil
                                                                Aout
                                     Avr
                      Fev

                                                                               Oct
                                                                       Sept
                             Mar

                                                                                           Dec
                                           Mai

                                                        Mois

Figure 15: Ombro-thermic curve of the Moulay Bouazza station.

                                                                                                      6035
Impact of Climate Change on Cereal farming in Morocco Case study: Rommani (Rabat-region),
Bouregreg watershed centre
2.1.5. Phenology
Table 7: Calendar of Cereal Growth Cycle Stages in Marchouch (INRA)
Observation dates Seedling Lifting Tillering Montaison Heading Flowering Maturity
12 November x
22 November x
10 January x
15 Febrary x
25 March x
30 March x
25 May x
Figure 16: State of the Marchouch Soft Wheat in March (Source: CRRA, INRA-Rabat)
Figure 17: State of the Marchouch Soft Wheat in April (Source: CRRA, INRA-Rabat)
6036El Houssaine OUHARBAa*, Zine el abidine TRIQUIa , Rachid MOUSSADEKb
Finally, for projections of future returns according to climate change models, I used the future monthly
climate parameters (Tmax, Tmin, Rain) for the year 2030 with scenario B2 and model HadCM3
(Hadley Center Model 3, British Meteorological Service) of www.worldclim.org/futurdown.htm and
retrieve them by ArcGis software for visualization and display, then compare them with the current
monthly climate data of the year (2007-2008) for the Marchouch experimental site, INRA.
The modeling adopted in this study is the "Crop-Syst" model that approaches the problem of
agricultural production in a progressive manner. Three hierarchical levels are identified: potential
growth, growth under water stress or nutritional stress (lack of fertilizers) and reduced growth (attack
by parasites).
If the intake of water or nutrients below optimal during a phase or the entire growth period, this will
lead to limited production due to lack of water or fertilizers.
Climatic factor related to rainfall / water requirements of cereals
Figure 18: Average monthly rainfall at the Bouregreg watershed scale in 1985, 2000, 2007
-Vulnerability related to the variability of plant productivity in relation to climate
variability.
6037Impact of Climate Change on Cereal farming in Morocco Case study: Rommani (Rabat-region),
Bouregreg watershed centre
Figure 19: Variability of early and late seasons with low vegetation cover (NDVIEl Houssaine OUHARBAa*, Zine el abidine TRIQUIa , Rachid MOUSSADEKb
40
Rain in (mm)
35
30
25
20 1
15 2
10
5 3
0
Figure 21: Decadal Variability of Rains during the Wheat Growth Cycle for the period (2003 to
2009)
corresponding to the date of sowing (2nd Decade of November) on the Maturation
date (3rd
Decade of May) during the Cycle of Growth of wheat in Marchouch (INRA).
This figure illustrates the distribution of the irregularity of the ten-day rains during the wheat growth
cycle for the period (2003 to 2009) in Marchouch. Between the months of September and December
there is a cumulative increase in the 10-day rainfall, which is important for the early stages of the
growth cycle, between December and January a fall in cumulative rainfall that corresponds to the cold
phase of the cycle, while in February the rains increase again which is important for the supply of the
water reserve because it is the critical stage of the plant growth where the plant needs a lot of water.
From the month of March the decadal rains decrease until the end of the cycle. It is the phase of the
flowering until the maturity or the degree-days of the temperatures are more important.
40 Tmoy Tmax Tmin
Temperatures in (°C)
30
20
10
0
Figure 22: Evolution of Average Monthly Temperatures (Tmoy, Tmax and Tmin)
the Agricultural Campaign for the period (2003 to 2008), in Marchouch (INRA)
For the temperature regime, there is a change in the irregularity of the monthly average temperatures
(Taverage Tmax and Tmin) between the months of the crop year for the period 2003 to 2008.
With a high of 32.93 (°C) recorded in July, a low of 04.63 (°C) recorded in the month of January.
6039Impact of Climate Change on Cereal farming in Morocco Case study: Rommani (Rabat-region),
Bouregreg watershed centre
80 40
70 Pluies moy. 35
Temperature ( °C)
Tmoy
60 30
50 25
Rain (mm)
40 20
30 15
20 10
10 5
0 0
Figure 23: Ombro-thermic diagram of the Marchouch Experimental Domain (INRA)
An ombro-thermic diagram that tells us about the wet and dry periods during the growing season
(September -August) and the period of plant growth for the series from 2002/2003 to 2007/2008.
80
R 1
70 2
a
60 3
i
n 50
i 40
n 30
(
20
m
m 10
)
0
2003 2004 2005 2006 2007 2008
.
Figure 24: Evolution of the three decades of the month of November at the Experimental
Domain Marchouch, INRA
The analysis of the growth and production of wheat by an agro-climatic characterization using the
dates of sowing and water deficit, shows the temporal evolution of the accumulations of rains of the 3
decads of November for the period 2003 to 2008. It allows us to choose the optimal date of early
sowing, which allows us to use the accumulated first rains fallen, in order to satisfy the useful reserve
of the water needs for the plant during the emergence phase.
6040El Houssaine OUHARBAa*, Zine el abidine TRIQUIa , Rachid MOUSSADEKb
60
50
Yield in qx/ha 40
30 Mesuré
20 Simulé
10
0
2001 2002 2003 2004 2005 2006 2007 2008
Figure 25: Comparison between measured and simulated yield at the Experimental Domain
Marchouch, INRA.
The analysis of yields shows the irregularity of average yields of soft wheat from the 2000/01 to
2008/09 crop years. Yields are marked by a peak of 55.24 qx / ha measured in the 2004/05 season and
a minimum of 3.42 qx / ha measured during the 2006/07 season.
60
Yields Simulated (Qx/ha)
y = 0,6371x + 14,355
50 R² = 0,6376
40
30
20
10
0
0 10 20 30 40 50 60
Yields Measured (Qx/ha)
Figure 26: Relationship between measured and simulated yields in Marchouch
The simulation of yields by the Crop-Syst model (Stöckle, Nelson, 2005) and comparison between
measured and simulated yields at Marchouch (Rommani), gives a significant correlation between the
measured and simulated yields of (R² = 0.6376).
Taking into account the calibration of the model on the study site which remains estimated in relation
to the real characteristics of the environment and crops.
Simulation of Returns by the CropSyst Model (Stöckle, Nelson, 2005)
3.1. Simulation outputs
Fastgraph document
6041Impact of Climate Change on Cereal farming in Morocco Case study: Rommani (Rabat-region),
Bouregreg watershed centre
Table 8 : Simulated Harvest Report.
seedl Eme Flowe Matur Matu Harv Emer Actu Yield Yield Rain
ing rgenc risg ation rity est gence al (Qx/ha) (Qx/ha) (mm
e ETP )
(mm
)
Simulated Measured
12/11 30/11/ 28/04/ 13/05/ 26/05/ 11/06/ 333,20 171, 40.00 35.82 161,
/2000 2000 2001 2001 2001 2001 00 16 60
13/11 27/11/ 28/04/ 11/05/ 23/05/ 08/06/ 331,20 309, 43.89 24.46 362,
/2001 2001 2002 2002 2002 2002 01 03 20
13/11 27/11/ 02/05/ 14/05/ 25/05/ 10/06/ 331,20 308, 51.51 47.32 457,
/2002 2002 2003 2003 2003 2003 02 62 20
13/11 27/11/ 05/05/ 18/05/ 31/05/ 16/06/ 331,20 276, 43.65 45.78 437,
/2003 2003 2004 2004 2004 2004 03 23 50
12/11 27/11/ 03/05/ 13/05/ 25/05/ 10/06/ 332,20 167, 49.00 55.24 168,
/2004 2004 2005 2005 2005 2005 04 74 70
13/11 27/11/ 03/05/ 14/05/ 25/05/ 10/06/ 331,20 211, 33.00 48.86 268,
/2005 2005 2006 2006 2006 2006 05 18 40
13/11 25/11/ 05/05/ 16/05/ 29/05/ 14/06/ 329,20 237, 10.00 3.42 188,
/2006 2006 2007 2007 2007 2007 06 31 20
13/11 25/11/ 26/04/ 07/05/ 22/05/ 07/06/ 329,20 156, 27.21 27.00 158,
/2007 2007 2008 2008 2008 2008 07 66 40
6042El Houssaine OUHARBAa*, Zine el abidine TRIQUIa , Rachid MOUSSADEKb
Projection of future returns according to climate change models using in this work scenario B2 to
compare between the current maximum temperatures of the campaign (2008-09) and future of the year
(2030), the current minimum temperatures of the campaign (2008-09) and future of the year (2030)
and the current rains of the campaign (2007-08) and future of the year (2030) of the Experimental
Domain Marchouch, INRA.
Figure 27: Grid of regional climate models (Black dots).
Figure 28: Temperature projection in the study area
6043Impact of Climate Change on Cereal farming in Morocco Case study: Rommani (Rabat-region),
Bouregreg watershed centre
Figure 29: Rainfall projection in the study area
Figure 30: Projection of maximum temperatures in study sites in summer (left) and in winter
(right)
6044El Houssaine OUHARBAa*, Zine el abidine TRIQUIa , Rachid MOUSSADEKb
Figure 31: Projection of minimum temperatures in study sites in summer (left) and in winter
(right)
Tableau 9: Comparison between the current maximum temperatures of the season
(2008 - 09) and future of the year (2030) of Exp. Marchouch, INRA
Present Future
2008-2009 2030
Months T max T max
September 28,22 28,40
October 22,44 22,80
November 17,67 16,30
December 15,25 13,10
January 14,33 15,30
Febrary 17,54 17,10
March 20,59 19,40
April 20,26 20,50
May 26,26 26,90
June 30,86 30,70
July 29,22 34,60
August 31,44 33,50
Average/year 22,84 23,22
6045Impact of Climate Change on Cereal farming in Morocco Case study: Rommani (Rabat-region),
Bouregreg watershed centre
Tableau 10: Comparison between the current minimum temperatures of the campaign
(2008 - 09) and future of the year (2030) of Exp. Marchouch, INRA
Present Future
2008-2009 2030
Months T min T min
September 15,70 16,60
October 12,10 13,30
November 7,60 9,50
December 6,40 6,80
January 5,90 5,20
Febrary 7,40 6,20
March 9,80 7,40
April 7,00 9,30
May 11,70 12,30
June 16,10 15,90
July 15,40 17,60
August 16,20 17,90
Average/year 10,94 11,50
Tableau 11: Comparison between the current rains of the season (2007-08) and the future of
the year (2030) of the Marchouch Experimental Domain, INRA.
Present Future
Months Rain Rain
2007-2008 2030
September 1,40 7
October 15,94 10
November 67,52 17
December 14,85 8
January 52,87 2
Febrary 45,44 2
March 13,07 3
April 44,74 2
May 45,25 2
6046El Houssaine OUHARBAa*, Zine el abidine TRIQUIa , Rachid MOUSSADEKb
June 0,00 0
July 0,00 1
August 0,00 3
Cumulative/year 301 57
For the rains, according to the B2 model proposed for the study area, it turns out that in the future
there will be less rainfall (about less than 80%). It is a strong aridity that will settle in the region of the
Marchouch Experimental Domain, INRA, according to the climate scenario.
For temperatures (T max and T min), according to the climate scenario model B2, there will be a
temperature increase of approximately (+1 to 2°C). The study area will become hotter in the future.
For future yields under scenario B2, the study area will become more arid in the future which will
have direct and negative effects on cereal yields. This is in line with the results obtained in the WB/
FAO / INRA / DMN report prepared by the World Bank Morocco study (Gommes et al., 2009).
Figure 32: Characterization of the quality of the vegetation.
Critical areas in terms of degradation are 2% of the basin. Thus, more than a quarter of the basin is a
fragile space in terms of agricultural and pastoral exploitation. The 1975 study by the FAO on the state
of the environment (REEM, 1999) already indicated that 54% of the Bouregreg basin should not be
cultivated because of their fragility. At the spatial level (Figure 32), the spaces where the degradation
represents a critical risk are located in the southern part of the basin (upstream).
6047Impact of Climate Change on Cereal farming in Morocco Case study: Rommani (Rabat-region),
Bouregreg watershed centre
Figure 33: Map of the risk of soil degradation in the Bouregreg watershed.
Figure 34: Dynamics of the courses (The 3 types of course: - Forests, -Matorral degraded,
-Degraded and abandoned cultivated land.
6048El Houssaine OUHARBAa*, Zine el abidine TRIQUIa , Rachid MOUSSADEKb
Rainfed agriculture will disappear
Figure 35: Evolution of the vegetation determined from the surface temperatures of the
MODIS images and MCR-CNRM.
4. Conclusion
This work examines climatic hazards that cause significant fluctuations in agricultural production in
the Rommani region, which results in a comparison and correlation between yields and meteorological
parameters thus giving significant dependence between the two.
A modeling approach by Crop-Syst was used to obtain estimated returns and compare them to
measured returns.
In order to better understand this problem throughout the Bouregreg basin, it would be wise to follow
very closely in space and time. And this, by a study of comparison of the studied region with the
different regions of the Basin, with an application of the models of simulation of agriculture. Adopting
modeling will undoubtedly help decision-makers alert farmers to the risks of agricultural drought and
to forecast wheat import requirements in advance, thus helping the country's food security and also; to
estimate the impact of climate change on wheat productivity in the Rommani-region.
References
1. Ameziane T., Ouattar S., (1983). L’étude du climat en agriculture, Nouvelle approche d’un vieux
Problème. HTE N° 52-53.
2. Alibou J. (2002) impact des changements climatiques sur les ressources en eau et
6049Impact of Climate Change on Cereal farming in Morocco Case study: Rommani (Rabat-region),
Bouregreg watershed centre
les zones humides du Maroc, CRESHE, EHTP, IUCN, P.41
3. Balaghi R., (2000a). Suivi de l’évolution des réserves en eau sous cultures de blé en région semi-
aride Marocaine : Calibration et utilisation du modèle SOIL. Mémoire de DEA,
Arlon, FUL-Bélgique, 95 p.
4. Balaghi R., (2006). Wheat grain yield forecasting models for food security in Morocco. Thèse de
Doctorat en sciences de l’environnement. Ulg-Arlon, Bélgique, 103 p.
5. Brun, (2007). Atelier sur les changements climatiques organisé par SEEE, DMN en
collaboration avec l’OMM, GIEC. Le 4 avril 2007, Rabat-Maroc.
6. CID, (2004). Etude d'actualisation des ressources en eau de surface de la zone
d'action de l'agence du bassin hydraulique du Bouregreg- Rabat.
7. Carmona G., (2005). Modèles de simulation de l’agriculture d’un bassin versant, application au
bassin Aveyron-Lère. Monpellier: CIHEAM-IAMM, 2005, 107 p.
8. DMN, 1996. Climat de la Région de Rabat-Salé. Infomet -N°11–Septembre 1996
Page 7.
9. Driouech F., (2010). Distribution des précipitations hivernales sur le Maroc dans le cadre d’un
changement Climatique : descente d’échelle et incertitudes. Thèse Doctorat,
Université de Toulouse.
10. Fezzaz M., (1986). Modélisation Agro-climatique : Etude des Risques et des Contraintes
imposés par la sécheresse aux Céréales d’Automne : Cas de Trois Régions
au Maroc. Mémoire de 3ème cycle en Agronomie, IAV, Hassan II-Rabat.
11. GIEC., (2001). Changement Climatique, Rapport de Synthèse. XVIII Session du GIEC
(Wembley, Royaume – Uni, 24-29 Septembre 200).
12. GIEC., (2001). Houghton J., le Treut H., et al. (2004). L’injustice fondamentale des
Changements Climatiques, CETRI.
13. GIEC., (2007). Synthesis Report, Contribution of Working Groups I, II, and III to the Fourth
Assessment Report and the Intergovernmental Panel on Climate Change. Core
writting Team, Pachauri, R.K. and Reisinger (Eds.) IPCC, Geneva, Switzerland,
pp 104.
14. GIEC, (2019) : Rapport Spécial du GIEC: Réchauffement à 1,5°C Résumé à
destination des enseignants. (Avril-2019)
15. Gommes R., El Hairech T., Rosillon D., Balaghi R. (2009). Impact of climate change on
agricultural Yields in Morocco. World Bank –Morocco Study on the impact of
climate change on the Agricultural Sector. Food and Agriculture Organization of
the United Nations (FAO). Roma, Italy, 105 p.
6050El Houssaine OUHARBAa*, Zine el abidine TRIQUIa , Rachid MOUSSADEKb
ftp://extftp.fao.org/SD/Reserved/Agromet/WB_FAO_morocco_CC_yield_impact/WB_Moroc
co_20090603.pdf
16. Khomsi K., Mahe G., Sinan M., et al. ( 2011). Evolution des événements chauds Rares et très
Rares dans les Bassins Versants de Tensift et Bouregreg (Maroc) et
identification des types des temps synoptiques associés. From prediction to
prevention of hydrological risk in Mediterranean countries. Proceedings of the
MED-FRIEND International WorkShop on Hydrological Extremes, held
At University of Calabria, Cosenza (Italy), September 15– 7, 2011.
17. Khomsi, K., Mahe, G., Sinan, M. & Snoussi, M. (2013) Hydro-climatic variability
in two Moroccan basins: A comparative analysis of temperature, rainfall and
runoff regimes. In: Climate and Land Surface Changes in Hydrology Proceedings of
IAHS-IAPSO-IASPEI Assembly, Gothenburg, Sweden, July -2013). IAHS Publ. 362.
IAHS Press, Wallingford, UK.
18. Laouina A. et al., (2004). Dynamique de l’eau et gestion des terres dans le
contexte du changement global dans le bassin du Bouregreg (Maroc).
In Sécheresse n°1, vol. 15, 65-77
19. Mahe, G., Emran, A., Brou, Y.T. & Tra Bi, A. Z. (2012b) Impact de la
variabilité climatique sur l’état de surface du bassin versant du Bouregreg
(Maroc). European J. Sci. Res. 84(3), 417–425
20. Marghich, A., (2004) Le bassin versant de Bouregreg (Maroc Central) : Etudes
hydrologique, hydrogéologique et hydrochimie des eaux. PhD -Thesis, Université
Sidi Mohammed Ben Abdellah- Faculté des Sciences Dhar Lmahraz, Fes.
21. Morgeo, (2020). Geospatial Intelligence : Solutions and New Challenges
Casablanca, 15 and 16 April 2020.
22. Ouharba, E.H., (2011). Effet des Fluctuations Climatiques sur la phénologie, la croissance et la
production agricole à Rommani, Region de Rabat. Memoire de Master, Université
Mohammed V- Rabat, FSR, 83 p.
23. Stöckle C., Nelson R., (2005). Cropping Systems Simulation Model User’s Manual Dept.
Washington State University, Pullman WA 99164-6120.
23. Tra bi Z., Kolibi Z., Yaobrou T., et al. (2013). Télédétection et analyse statistique de la
dynamique de la Végétation dans un contexte de variabilité climatique sur le basin
6051Impact of Climate Change on Cereal farming in Morocco Case study: Rommani (Rabat-region),
Bouregreg watershed centre
versant du Bouregreg (Maroc). Climate and Surface, changes in Hydrology proceeding of
H01, IAH-IAPSO-IASPEI Assembly, Gothenburg, Sweden, July 2013 (IAHS Publ. 359,
2013).
24. IPCC, (2014). Climate Change : Synthesis report. Contribution of Working
Groups I, II and III to the Fifth Assessment Report of the Intergovernmental
Panel on Climate Change [Core Writing Team, R.K. Pachauri and L.A. Meyer
(eds.)]. IPCC, Geneva, Switzerland, 151 pp.
25. IPCC, ( 2018) . Special report on the impacts of global warming of 1.5 °C above pre-industrial
levels and related global greenhouse gas emission pathways, in the context of
strengthening the global response to the threat of climate change, sustainable
development, and efforts to eradicate poverty.
26. Voldoire A., Sanchez-Gomez E., et al. (2012). The CNRM-CM5.1 global climate
model: Description and basic evaluation.
27. WMO, (2018). GREENHOUSE GAS BULLETIN: The State of Greenhouse Gases in the
Atmosphere Based on Global Observations through 2017 - No.14 | 22 November
2018.
6052You can also read