6 PECULIARITIES OF RURAL CREDIT IN THE AMAZON
←
→
Page content transcription
If your browser does not render page correctly, please read the page content below
6 PECULIARITIES OF RURAL
CREDIT IN THE AMAZON
NEW RESEARCH SHOWS CREDIT                                                                                                           INSIGHT
RESTRICTIONS AND EXTENSIVE LAND                                                                                                      MAY 2021

USE IN AGRICULTURE

              The Amazon is unique. Not only is it one of the most important carbon sinks on the planet, but
              it is also home to the largest stocks of biodiversity worldwide. The institutional environment and
              public policies for the Amazon are just as distinctive.

              Brazil has considerable experience in using public policy to fight tropical deforestation without
              a negative impact on agricultural production. In fact, between 2004 and 2012, deforestation
              rates in the Brazilian Amazon dropped 80% while the contribution of the region’s agricultural
              sector to the GDP increased.1 However, a significant increase in deforestation in recent years
              has undone some of the positive effects of these policies. This issue has become increasingly
              central at the international level, affecting the country’s image and trade agreements. Preserving
              the forest is essential for the protection of water resources, which, in turn, are essential for
              agricultural production.

              Much of rural credit in the Amazon is related to livestock, particularly cattle production, which is
              often linked to deforestation. Near 99% of deforestation is illegal,2 and from 1985 to 2017 around
              80% of the deforested area in this biome was converted to pastures.3

              Therefore, deepening the analysis of rural credit in the region is key to understand how this
              important agricultural policy works and to better align government incentives with the country’s
              sustainability objectives. Access to credit must be directed to producers in accordance with
              the Forest Code, which requires the preservation or restoration of native vegetation in private
              areas. Forest protection is a public good. Therefore, aligning credit with compliance requirements
              for the Forest Code can justify, from an economic point of view, directing public resources to
              the agricultural sector. Another important step in this direction, of aligning agricultural policy
              with sustainability, is the Central Bank of Brazil’s recent initiative to create the Green Credit
              Bureau (Bureau Verde), a register of information on rural credit operations that will contain
              sustainability indicators.

1 Gandour, Clarissa. Why Is Protecting the Amazon Important?. Rio de Janeiro: Climate Policy Initiative, 2019. bit.ly/38ImgZE.
2 MapBiomas. Sistema de Validação e Refinamento de Alertas de Desmatamento com Imagens de Alta Resolução. V. 5.0. 2019. bit.ly/2Os44wr.
3 Silva, Daniel et al. Fluxos financeiros para a pecuária na Amazônia Legal. Brasília: IPAM, 2019. bit.ly/3tB7LyP.

                                                                                                                                            1
In this brief, researchers from the Climate Policy Initiative/Pontifical Catholic University of Rio de
Janeiro (CPI/PUC-Rio) deepen the understanding of rural credit in the Amazon biome,4 building
on previous foundational research on rural credit in Brazil, which outlined its impacts and
provided policy recommendations.5 By focusing on the characteristics of the Amazon region and
its agricultural sector, the analysis reveals six specific standards and conditions of rural credit,
providing evidence for public actions and policies for local development, the sustainability of
agricultural production, and environmental conservation.
This analysis of the credit market in the Amazon biome points to low competition and
insignificant participation by private funds and institutions; limited access, and a focus on
cattle production. A financial structure tailored to the Amazon biome is essential to achieving
productivity gains and reducing deforestation.6
BOX 1. MAIN CHARACTERISTICS OF RURAL CREDIT IN THE AMAZON
1. Most rural credit in the Amazon region is channeled to cattle farming: 57% of the
amount of credit operations in the Amazon biome were related to cattle production
in the 2019/20 agricultural year. This is in stark contrast with the rest of the country,
where only 32% of rural credit is used to finance this activity. Deforestation in the
Amazon has strong ties to cattle production.
2. Producers in the Amazon have less access to credit than producers elsewhere
in the country. The 2017 Agricultural Census7 found that 13% of all Brazilian rural
producers were located in the Amazon.8 The Amazon was home to 30% of the
nation’s cattle herd and its agricultural production corresponded to 11%of the total
value of national agricultural production according to IBGE data. However, in the
2016/17 agricultural year, the value of rural credit operations in the municipalities
of this biome corresponded to only 7.2% of total rural credit in Brazil, indicating
an underrepresentation of the Amazon in credit statistics. Limited access to credit
represents an obstacle to intensifying and increasing cattle productivity, as suggested
by a previous study by CPI/PUC-Rio.9 Thus, the low availability of credit contributes
to more extensive agricultural production because there are fewer resources
available for investing in intensification, thus generating greater deforestation.
4 The authors used as definition of the Amazon biome the minimum geographical unit of the Brazilian territory, municipalities. When municipalities
had more than one biome, the classification was made based on the identification of the predominant one. That is, a municipality is classified as
belonging to the Amazon if most of its territory is composed by this biome.
5 Souza, Priscila, Stela Herschmann, and Juliano Assunção. Rural Credit Policy in Brazil: Agriculture, Environmental Protection, and Economic
Development. Rio de Janeiro: Climate Policy Initiative, 2020. bit.ly/2QIbaxB.
6 Bragança, Arthur and Juliano Assunção. Pathways for Sustainable Agricultural Production in Brazil: Necessary Investments and Potential Gains of
Increasing Efficiency. Rio de Janeiro: Climate Policy Initiative, 2019. bit.ly/2ROtTI9.
7 The reference period for the 2017 Agricultural Census is from 10/01/2016 to 9/30/2017.
8 IBGE. Agricultural Census. 2017. bit.ly/38FjG6j.
9 Souza, Priscila, João Mourão, and Juliano Assunção. The Impact of Rural Credit on Agriculture and Land Use: An Analysis of Brazilian Biomes. Rio de
Janeiro: Climate Policy Initiative, 2021. bit.ly/3t8QfRG.
23. Agricultural activities in the Amazon are less business-oriented than the rest of the
country. The amount of rural credit borrowed by companies in the biome accounted
for a mere 4.8% of the region’s total in the 2019/20 agricultural year, while the
volume of credit directed to companies elsewhere in Brazil accounted for 26% of the
rest of Brazil in the same period. Regarding the use of credit, the categories “trade”
and “industry”, which are typical for agriculture enterprises, corresponded to only
3.6% and 0.3% of the credit volume in the Amazon biome, which is much lower than
in other parts of Brazil. The low prevalence of a more business-oriented agriculture
is tied to lower investments and intensified production.
4. Regarding credit distribution channels, producers have limited credit options. There
is a predominance of two public banks in the operation of rural credit in this biome:
Banco da Amazônia and Banco do Brasil. In the 2019/20 agricultural year, either
Banco do Brasil or Banco da Amazônia was the main source of rural credit in 78% of
municipalities in the region.10 The lack of other financial institutions offering rural
credit in many municipalities indicates that there is little competition among banks
offering credit, limiting options for producers.
5. For many years, the main source of financing for rural credit in the biome was the
Northern Constitutional Fund (Fundo Constitucional do Norte - FNO), even though
its total contribution to rural credit funding at the national level was insignificant.
Since the 2011/12 agricultural year, other sources of funding (Compulsory Resources
and Rural Savings) have become dominant, much like in the rest of the country.
Agriculture Credit Notes (Letras de Crédito Agrícola - LCA) also gained considerable
space in the composition of credit available for the biome, but more modestly so
than they did in the rest of the country. LCA are private investments backed by
loans granted to rural producers or cooperatives. The lower prevalence of these
investments in the biome implies a lower availability of credit.
6. There is a greater relevance in the Amazon of credit volumes offered by National
Program for Family Farming (PRONAF) and National Program to Support Medium-
Sized Rural Producers (PRONAMP). In the 2019/20 agricultural year, PRONAF’s
operations in the Amazon accounted for 17% of total credit, while PRONAMP’s
operations accounted for only 10%. In the other biomes, both PRONAMP and
PRONAF accounted for 15% of the total value of operations in 2019/20. This may be
explained by the fact that a criterion for PRONAF eligibility is that the property does
not exceed four fiscal modules. Since fiscal modules’ sizes varies by municipality
and the largest fiscal modules were defined for the Amazon region, producers with
relatively larger properties in the region are able to access PRONAF.
10 Considering all 356 municipalities with more than 50% of their territory classified as part of the Amazon biome.
31. AMAZON, AGRICULTURE, AND THE ROLE
OF RURAL CREDIT
The Brazilian Amazon is an environmental asset of critical importance to the country and
the entire world. Between 2002 and 2019, the share of forest areas in the biome as a whole
declined from 84% to 79%,11 while the area devoted to livestock production rose from 10%
to 13% in the same period. Planted areas, on the other hand, grew much less over this 17-year
period, from 1% to 2%.
Agricultural production also increased in the Amazon biome. While the value of agricultural
production in the Amazon grew 272% between 2002 and 2019 (to a total of R$ 39.54 billion),
the growth rate for the rest of Brazil was 84% (with a total production value of R$ 321.47 billion).12
As such, agriculture in the Amazon region accounted for 11% of the country’s production in 2019,
compared to only 6% in 2002 (Figure 1). Soy was the primary driver of this increase. In 2002, the
soy produced in the biome was valued at R$ 1.8 billion, equivalent to 17% of the total agricultural
production in the region. By 2019 this amount had reached R$ 17.7 billion, corresponding to 45%
of the total value of agriculture in the biome. Elsewhere in Brazil, the value of soy produced was
R$ 107.9 billion in 2019, equivalent to 34.6% of the value of agricultural production in the rest
of the country. Livestock also experienced a relevant expansion in the biome. The region’s cattle
herd grew 107% between 2002 and 2019, while for the rest of the country the growth rate was
8%.13 This means that 31% of the country’s herd were raised in the Amazon region in 2019, which
is a 9% increase from 2002.
Figure 1. Evolution of Amazon’s Share in Brazil’s Agricultural Production (2002-2019)
Figure 1. Evolution of Amazon’s Share in Brazil’s Agricultural Production (2002-2019)
35
31%
Share in Agricultural Production (%)
28
22%
21
14
11%
7 6%
0
02 03 004 005 006 007 008 009 2010 11 2 3 4 5 6 7 8 9
20 20 2 2 2 2 2 2 20 201 201 201 201 201 201 201 201
Year
Head of Cattle Crop Production (R$)
Source: CPI/PUC-Rio with data from IBGE’s Produção Agrícola Municipal (PAM) and Pesquisa da Pecuária
Source: CPI/PUC-Rio with data from IBGE’s Produção Agrícola Municipal (PAM) and Pesquisa da Pecuária
Municipal (PPM), 2021
Municipal (PPM), 2021
11 MapBiomas. Sistema de Validação e Refinamento de Alertas de Desmatamento com Imagens de Alta Resolução. V. 5.0. 2019. bit.ly/2Os44wr.
12 IBGE. Produção Agrícola Municipal. 2019. bit.ly/3cE0Ygy.
13 IBGE. Pesquisa da Pecuária Municipal. 2019. bit.ly/3s3EY5e.
4This increase in production with an emphasis on certain products is reflected in the composition
of rural credit in the biome. As seen in Figure 2, 81% of the number of contracts and 57% of the
amount of credit operations in the Amazon biome in the 2019/20 agricultural year were related
to cattle farming. These numbers are considerably higher than in the rest of the country, where
56% of the number of contracts and 32% of the value of credit operations are used for livestock
activities. Regarding crop production, the highlight in the Amazon biome is soy, which accounts
for approximately 18% of the total value of contracts, a proportion similar to the rest of the
country (where 21% of the total value of credit contracts is related to soy).
Figure 2. Rural Credit Composition by Credit Volume and Activity in the Amazon, 2019/20
Figure 2. Rural Credit Composition by Credit Volume and Activity in the Amazon, 2019/20
BY ACTIVITY
NUMBER OF CONTRACTS RURAL CREDIT VOLUME (R$)
57.3%
81.1%
18.9%
42.6%
Livestock Crop
BY PRODUCT
NUMBER OF CONTRACTS RURAL CREDIT VOLUME (R$)
46.4%
58.4%
1.2%
2.5% 5.2%
3.0% 17.9%
5.5%
6.8%
6.7%
16.7%
11.4% 10.5%
7.8%
Cattle Vehicles Others
Soy Corn
Infrastructure and Property Inputs, Equipments and Goods
Note: The category “Others” entails cotton, rice, eucalyptus, sugarcane, açaí, and other 88 products.
Note: The
Source: category "Others"
CPI/PUC-Rio entails
with data fromcotton,
SICORrice,
fromeucalyptus, sugarcane,
Central Bank of Brazil,açaí,
2021 and other 88 products.
Source: CPI/PUC-Rio with data from SICOR from Central Bank of Brazil, 2021
52. CREDIT RESTRICTIONS ARE MORE STRINGENT
IN THE AMAZON
Producers in the Amazon region have less access to credit than the in rest of the country. As
Figure 3 shows, the share of rural credit in the Amazon biome has historically been very low.
Over the last 20 years, on average only 7.5% of the total number of contracts and 6.3% of
the total amount of rural credit went to producers in the Amazon. Agriculture Census data
show 679,000 agricultural producers in the Amazon biome in 2017,14 equivalent to 13% of all
agricultural producers in Brazil. This is an 11% increase from the number of producers in the
Amazon in the 2006 Census.15 As such, producers in the region face greater restrictions when
seeking rural credit.
The average value of rural credit contracts in the Amazon region has been increasing. Today, it
exceeds the average amount for the rest of the country by 54% (Figure 4). The average amount
of credit agreements in the biome region in the 2019/20 agricultural year was R$ 155,000, a
529% increase from the average amount in the 2000/01 agricultural year.16
Figure 3. Evolution of the Number and Volume of Rural Credit Contracts in the Amazon and Other Biomes,
Figure 3. Evolution of the Number and Volume of Rural Credit Contracts in the Amazon and Other Biomes,
2000/01 - 2019/20
2000/01 - 2019/20
3a. Evolution of the Number of Contracts
2,500,000
2,250,000
2,000,000
Number of Contracts
1,750,000
1,500,000
1,250,000
1,000,000
750,000
500,000
250,000
0
01 02 03 04 /05 /06 /07 /08 /09 /10 /1
1 12 13 14 15 16 17 18 19 20
0 0/ 01/ 02/ 03/ 4 05 06 07 8 0 9 010 011/ 12/ 13/ 14/ 15/ 16/ 17/ 18/ 19/
0 0 0 20 20 20 20 0 20 20
20 20 20 20 20 20 20 20 20 20 2 2 2 2
Agricultural Year
Other Biomes Amazon
3b. Evolution of Volume of Contracts Figure 3 continues on the next page.
220
200
180
14 Number of160 agricultural properties is used as a proxy for agricultural producers. It refers to all categories of producers based on their relationship to
the land (i.e., owners,
140 settlers, tenants, partners, occupiers, or producers without areas). In the rest of the country, the number of producers dropped
Billions (R$)
from 4.56 million in 2006 to 4.39 million in 2017. In other words, there was a 4% decrease between the two censuses.
15 The Amazon 120biome accounted for only 5% of all rural credit available in 2006, and for 7.6% in 2017.
16 All figures 100
in this report have been deflated according to the Broad Consumer Price Index (Índice de Preços ao Consumidor Amplo - IPCA) and are
shown in constant December 2020 prices.
80 6
60
40Agricultural Year
Other Biomes Amazon
3b. Evolution of Volume of Contracts
220
200
180
160
140
Billions (R$)
120
100
80
60
40
20
0
01 02 03 04 /05 /06 /07 /08 /09 /10 1 12 13 14 15 16 17 18 19 20
/1
0 0/ 01/ 02/ 03/ 4 5 6 07 8 0 9 010 011/ 12/ 13/ 14/ 15/ 16/ 17/ 18/ 19/
0 0 0 0 20 20 20 20 20 20 20 20
20 20 20 20 20 20 20 20 20 20 2 2
Agricultural Year
Other Biomes Amazon
Note: Data refers to rural credit contracts and considers working capital, investment, trade, and industrialization.
Note: Data refers to rural credit contracts and considers working capital, investment, trade, and industrialization.
December 2020 constant values (inflation adjusted by IPCA).
December 2020 constant values (inflation adjusted by IPCA).
Source: CPI/PUC-Rio with data from RECOR and SICOR from Central Bank of Brazil, 2021
Source: CPI/PUC-Rio with data from RECOR and SICOR from Central Bank of Brazil, 2021
Figure 4. Evolution
Figure of of
4. Evolution thethe
Average Value
Average ValueofofRural
RuralCredit
CreditContracts
Contractsininthe
theAmazon
Amazon and
and Other
Other Biomes,
2000/01 – 2019/20
2000/01 – 2019/20
160,000
Average Value of Contracts (R$)
140,000
120,000
100,000
80,000
60,000
40,000
20,000
0
01 1
02 03 04 /05 /06 /07 /08 /09 /10 0/1 1/12 /13 /14 /15 /16 /17 7/18 /19 /20
0 0/ 01/ 02/ 03/ 4 05 06 07 8 09 01 1 12 013 014 015 016 01 018 19
20 20 20 20 20
0
20 20
0
20 20 20 2 20 20 2 2 2 2 2 2 20
Agricultural Year
Other Biomes Amazon
Note: Data
Note: refers
Data to rural
refers credit
to rural contracts
credit and
contracts andconsiders
considersworking
workingcapital,
capital,trade,
trade,and
andindustrialization.
industrialization.December
December
2020 constant values (inflation adjusted by IPCA).
2020 constant values (inflation adjusted by IPCA).
Source: CPI/PUC-Rio
Source: CPI/PUC-Rio with data
with from
data RECOR
from RECOR and
andSICOR
SICORfrom
fromCentral
CentralBank
BankofofBrazil,
Brazil,2021
2021
7Historically, agriculture and livestock farms17 in the Amazon biome were larger than in the rest
of the country (Figure 5). In the Amazon, the ratio between the total area of agriculture and
livestock establishments (in hectares) and the number of producers in 2017 was 125.98, 4.62%
higher than in 2006. In the biome, the average area of establishments devoted to agriculture
in 2017 was 61.90 hectares (14.56% greater than the average area in the 2006 census), while
those devoted to livestock featured an average of 203.75 hectares (a 1.03% drop from 2006).
In the rest of the country, on the other hand, the ratio between the total area of agricultural
farms (in hectares) and the number of producers in 2017 was 60.47, a 6.18% increase from
2006. For the other biomes, the average area of establishments devoted to agriculture in
2017 was 42.14 hectares (22.07% greater than the average area in 2006), while the average
area devoted to livestock was 74.41 hectares (8.7% lower than in 2006). These reductions
in the average area of farms for livestock in the rest of the country are related to the greater
intensification of production.
Figure 5. Average Area of Agricultural Farms from 2006 to 2017, in the Amazon and Other Biomes
Figure 5. Average Area of Agricultural Farms from 2006 to 2017, in the Amazon and Other Biomes
Amazon Other Biomes
250
200
Agricultural Farms (ha)
Average Area of
150
100
50
0
2006 2017 2006 2017
Year Year
Agriculture Crop Livestock
Source: CPI/PUC-Rio with data from IBGE’s 2006 and 2017 Agricultural Census, 2021
Source: CPI/PUC-Rio with data from IBGE’s 2006 and 2017 Agricultural Census, 2021
17 According to the Census, agricultural farms are any production or exploration units devoted, partially or in full, to agricultural, livestock, forestry
and aquaculture activities, regardless of size, ownership (whether they belong to a single producer, to several producers, to a company or to a group
of companies), or location (urban or rural area) for production purposes, either for sale (trade) or subsistence (livelihood of producers and their
families). The area of any given agricultural establishment is, therefore, the total area devoted to these activities as identified in the census. This area
is subdivided into nine groups: i) production of temporary crops; ii) production of vegetables and flowers; iii) production of permanent crops;
iv) production of certified seeds and seedlings (these four groups were grouped together as Agriculture, as shown in Figure 3);
v) livestock farming; vi) forest production - planted forests; vii) forest production - native forests; viii) fishing; ix) aquaculture. This analysis depicts
only the most relevant groups: agriculture and livestock farming.
83. BORROWERS AND PURPOSES OF RURAL CREDIT
In the Amazon, individuals account for 99.7% of all contracts and 95.2% of the total amount
of rural credit in the 2019/20 agricultural year. In the rest of the country, the average number
of contracts with individuals is similar to the Amazon at 99.4% in 2019/20. However, the
difference in the percentage of total credit allocated to each region is quite stark. Although only
0.6% of credit agreements are signed with firms, they accounted for 26% of the amount of
credit borrowed that year in the rest of Brazil (Figure 6). The data suggest that companies in the
Amazon not only account for a small percentage of the number of rural credit contracts, but also
that the contracts are for considerably lower amounts than in the rest of the country. Therefore,
agriculture in the Amazon biome seems not to be very business-oriented, which is tied to lower
investments and less intense production.
Figure 6. Number of Contracts and Rural Credit Volume by Producer Type in the Amazon and
Figure 6. Number of Contracts and Rural Credit Volume by Producer Type in the Amazon
Other Biomes, 2019/20
and Other Biomes, 2019/20
AMAZON
NUMBER OF CONTRACTS RURAL CREDIT VOLUME (R$)
4.8%
0.3% 99.7% 95.2%
Firms Individuals
OTHER BIOMES
NUMBER OF CONTRACTS RURAL CREDIT VOLUME (R$)
26.1%
0.6% 99.4% 73.9%
Firms Individuals
Source: CPI/PUC-Rio with data from RECOR and SICOR from Central Bank of Brazil, 2021
Source: CPI/PUC-Rio with data from RECOR and SICOR from Central Bank of Brazil, 2021
9Figure7.
Figure 7. Evolution
Evolution of
of Number
Number of
of Contracts
Contracts and
and Rural
Rural Credit
Credit Volume
Volumeby
byCredit
CreditType
Typeininthe
theAmazon,
Amazon,
2000/01 - 2019/20
2000/01 - 2019/20
7a. Number of Contracts
180,000
135,000
Number of Contracts
90,000
45,000
0
1 2 3 4 5 6 7 8 9 0 1 2 3 4 5 6 7 8 9 0
0/0 1/0 2/0 3/0 4/0 5/0 6/0 7/0 /0 9/1 10/1 11/1 2/1 3/1 4/1 5/1 6/1 17/1 8/1 9/2
0 0 0 0 0 0 0 0 0 8 0 0 0 01 01 01 01 01 0 01 01
20 2 0 20 20 20 20 20 20 20 2 0 2 2 2 2 2 2 2 2 2 2
Agricultural Year
Working Capital Investment Trade Industrialization
7b. Rural Credit Volume
20
15
Billions (R$)
10
5
0
01 02 03 04 /05 /06 /07 /08 /09 /10 0/11 1/12 /13 /14 /15 /16 /17 7/18 /19 /20
0/ 01/ 02/ 03/ 9 01 12 13 14 015 016 01 018 19
0 04 05 06 007 008 00 1
20 20 20 20
20 20 20 20 20 20 20 2 2 2 2 2 2 2 2 20
Agricultural Year
Working Capital Investment Trade Industrialization
Note:
Note:December
December2020
2020constant
constant values
values (inflation
(inflation adjusted
adjusted by
by IPCA).
IPCA).
Source:
Source:CPI/PUC-Rio
CPI/PUC-Riowith
withdata
data from
from RECOR
RECOR andand SICOR
SICOR from Central Bank
from Central Bank of
of Brazil,
Brazil, 2021
2021
10As for the purpose of credit, the situation is similar to the rest of Brazil: most rural credit in the
Amazon is directed toward working capital and investment contracts, both for the number of
contracts and in contracted amounts (Figure 7). In the 2019/20 agricultural year, 36% of all
contracts in the Amazon (compared to 43% for the rest of the country) and 53% of the total
amount of credit in the biome (compared to 57% for the rest of the country) was used for
working capital.
This does not hold true for credit used for investment. Besides the proportion of investment
contracts being higher in the Amazon than in the rest of the country for the 2019/20 agricultural
year (64% for the Amazon biome and 56% for the rest of the country), the amounts allocated
for investment differ greatly. In the Amazon biome, investment contracts received 43% of the
amount of available credit; in the rest of the country, only 24% were used for that purpose. The
19-point difference was almost entirely offset by the fact that very little credit was used for trade
and industry18 in the Amazon biome, which are typical categories for more business-oriented
agriculture. In 2019/20 only 0.7% of the contracts and 3.6% of the credit amount were used for
trade, while in the rest of the country it was 1.3% of all contracts and 13% of the total amount.
Credit for industrialization accounted for only 0.01% of all contracts and 0.3% of the total
amount available for the biome, compared to 0.1% of contracts and 6.4% of the credit amount for
the rest of Brazil.
4. CREDIT DISTRIBUTION CHANNELS: THE PREVALENCE
OF PUBLIC BANKS
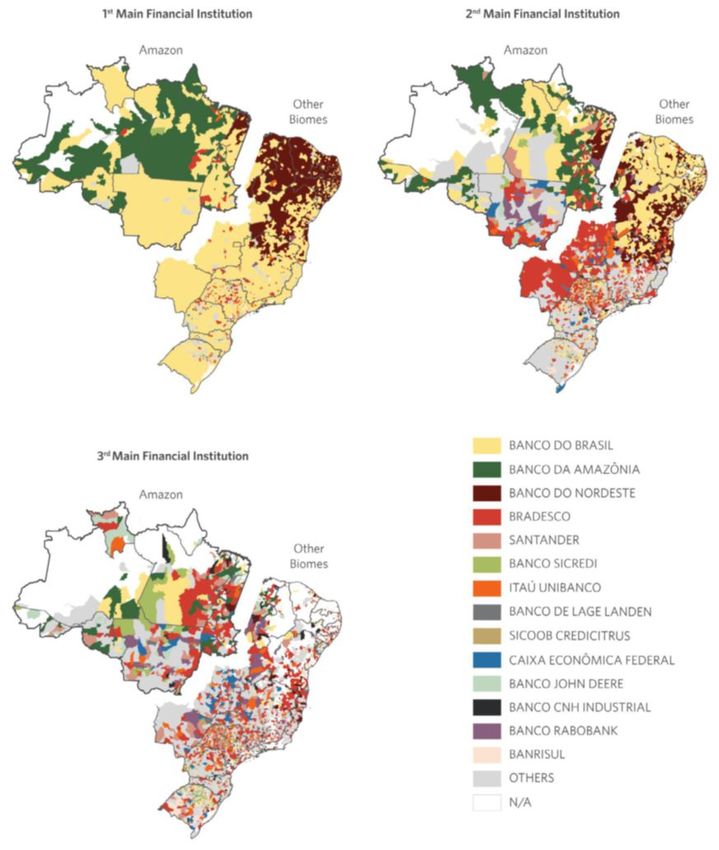
Competition in rural credit markets in the Amazon is low, which means there are few alternatives
available in the region for farmers to get loans. Figure 8 shows the three main financial
institutions for each municipality in the Amazon. In most municipalities, Banco do Brasil or Banco
da Amazônia are the primary supplier and, where this is not the case, one of these two banks are
the second or third largest suppliers.
18 According to the Rural Credit Manual (Manual de Crédito Rural), the purpose of trade credit is to provide rural producers or their agricultural
cooperatives with the resources necessary to commercialize their products on the market. Credit for industrialization is intended for rural producers
or cooperatives seeking to industrialize agricultural products, provided that, at least, 50% of the production to be processed is produced by the
company itself (or by associates).
11Figure 8. Main Rural Credit Provider by Municipality in the Amazon and Other Biomes, 2019/20
Note: The main financial institutions are defined as those that lend the highest volume of credit
in each municipality.
Source: CPI/PUC-Rio with data from RECOR and SICOR from Central Bank of Brazil, 2021
Figure 9 shows that the competitive landscape of the sector has had little change between
the 2002 and today. In 2019/20, Banco do Brasil was the main supplier of rural credit in 208
municipalities, while Banco da Amazônia was in 148 ones, meaning that these two credit
providers are the main suppliers for over 70% of the region. The same banks accounted for 44%
and 17% of the volume lent in the same agricultural year. Although other banks account for the
remaining 39%, they do not have the same spatial penetration, thus preventing many producers
from accessing these competitors in the credit market. Promoting greater competition among
financial institutions, by creating instruments to ensure greater participation by private banks and
cooperatives, can make the credit distribution system more efficient in the region.
12Figure 9. Number of Municipalities and Share of Credit Volume by Financial Institution,
Figure 2002/03
9. Number- of
2019/20
Municipalities and Share of Credit Volume by Financial Institution, 2002/03 - 2019/20
9a. Number of Municipalities by Main Financial Institution
250
200
Number of Municipalities
150
100
50
0
1
03 04 05 06 07 08 09 10 /1 12 13 14 15 16 17 18 19 20
02/ 03/ 04/ 05/ 06/ 07/ 08/ 09/ 010 011/ 012/ 13/ 14/ 15/ 16/ 017/ 18/ 19/
20 20 20 20 20 20 20 20 2 2 2 20 20 20 20 2 20 20
Agricultural Year
Banco do Brasil Banco da Amazônia
9b. Share of Credit Volume by Financial Institution
60
Credit Volume (%)
40
20
0
1
03 04 05 06 07 08 09 10 /1 12 13 14 15 16 17 18 19 20
02/ 03/ 04/ 05/ 06/ 07/ 08/ 09/ 010 011/ 012/ 13/ 14/ 15/ 16/ 017/ 18/ 19/
0 0 2 2 0 0 0 0 2 0 20
20 20 20 20 20 2 20 2 2 2 2 2 2 2
Agricultural Year
Banco do Brasil Banco da Amazônia
Source: CPI/PUC-Rio with data from RECOR and SICOR from Central Bank of Brazil, 2021
Source: CPI/PUC-Rio with data from RECOR and SICOR from Central Bank of Brazil, 2021
135. PRIMARY SOURCES OF FUNDING FOR RURAL CREDIT
In the 2019/20 agricultural year, the three main sources of funding in the Amazon were
Compulsory Resources, the FNO and Rural Savings - Restricted (Figure 10). Compared to the rest
of the country, Compulsory Resources and Rural Savings - Restricted also featured among the
main sources of funding for rural credit, but elsewhere in the country, LCA come in second place.
The FNO has, historically, been an important source of funds for northern Brazil, accounting for
almost half of the rural credit in the region (49% in the 2000/01 agricultural year). However,
the FNO has lost ground more recently, falling to a mere 17% of credit in the Amazon in
2019/20. This source of funding is operated exclusively by Banco da Amazônia; accounts for
96% of the number of rural credit contracts signed by the bank and 91% of the volume of loan
funds. In 2019/20, only 2.3% of FNO funds were allocated to the National Program for Low-
Carbon Emissions in Agriculture (Programa para Redução da Emissão de Gases de Efeito Estufa na
Agricultura - ABC) and 8.3% to PRONAF. This means that 89.3% of its funds were loaned per
FNO’s own distribution rules. In 2019/20, only 1% of FNO rural credit contracts and 7.5% of
the total amount were directed to firms. Of the remainder (borrowed by individuals), 64% of
the contracts - but only 6% of the total amount - were linked to PRONAF. With regard to the
activities financed by the FNO, 31% of the contracts and 32% of the amount went to agriculture,
while 69% of the contracts and 68% of the value went to livestock in 2019/20.
LCA, currently the second largest source of funding for rural credit in the rest of the country,
also make up a considerable source of funds for the Amazon region. In the 2014/15 agricultural
year, LCA accounted for only 0.1% of funding sources in the biome; by the following year,
this number jumped to 5% and by 2019/20 it was 12%. Elsewhere in the country, LCA accounted
for 0.5% in 2014/15 and 9% the following year; in 2019/20, LCA were responsible for 16% of all
rural credit available.
14Figure 10. Evolution of Rural Credit Volume by Funding Source in the Amazon, 2000/01 - 2019/20
Figure 10. Evolution of Rural Credit Volume by Funding Source in the Amazon, 2000/01 - 2019/20
20
15
Billions (R$)
10
5
0
01 02 03 04 /05 /06 /07 /08 /09 /10 0/11 1/12 /13 /14 /15 /16 /17 7/18 /19 /20
0/ 01/ 02/ 03/ 9 01 12 13 14 015 016 01 018 19
0 04 05 06 007 008 00 1
20 20 20 20
20 20 20 20 20 20 20 2 2 2 2 2 2 2 2 20
Agricultural Year
Compulsory Resources Unrestricted Resources
FNO FCO
Rural Savings – Restricted FNE
Rural Savings – Unrestricted External Financing
LCA Hybrid Instrument (IHCD)
BNDES – FINAME Other Funding Sources
Note: December 2020 constant values (inflation adjusted by IPCA). The category “Other Funding Sources”
Note: December 2020 constant values (inflation adjusted by IPCA). The category “Other Funding Sources” includes:
includes: BNDES – Unrestricted, States and Municipalities, FAT, FTRA, FUNCAFÉ, National Treasury, and
BNDES – Unrestricted, States and Municipalities, FAT, FTRA, Funcafé, National Treasury, and Unrestricted
Unrestricted Resources – Subsidized.
Resources – Subsidized.
Source: CPI/PUC-Rio with data
Source: CPI/PUC-Rio with data from
fromRECOR
RECORandandSICOR
SICORfrom
fromCentral
Central Bank
Bank of of Brazil,
Brazil, 2021
2021
156. RURAL CREDIT PROGRAMS
In an assessment of rural credit programs in the Amazon biome, PRONAF, a credit program
aimed at small producers and family farming, is relevant and shows little variation in the
historical series under analysis, both in the Amazon and in other Brazilian biomes. In the 2019/20
agricultural year, PRONAF credit operations in the Amazon accounted for 17% of all credit
volume and 73% of the number of rural credit contracts. In the rest of the country PRONAF’s
credit operations corresponded to 15% of the total amount of available credit and 73% of credit
contracts in the 2019/20 agricultural year. PRONAF rules limit credit access to producers
that own areas up to 4 fiscal modules in size.19 Because the size of fiscal modules varies by
municipality and the largest fiscal modules are in the Northern region, Amazon producers with
larger properties can still access PRONAF, whereas in other parts of the country farms of these
sizes would not be eligible.
PRONAMP, a credit program aimed at medium-sized producers, has had a different trajectory
(Figure 11). PRONAMP, grew less in the Amazon biome than in the rest of the country. PRONAMP
credit operations in the Amazon accounted for 0.3% of the total amount of credit in 2000/01,
rising to 10% in 2019/20. Though relevant, this figure remains significantly lower than the
percentage for PRONAF operations, which was 17% in that same year. In the other biomes,
PRONAMP has grown sharply since 2000/01, becoming as relevant as PRONAF in credit volume.
Both programs accounted for 15% each of the total amount of operations in 2019/20.
19 The fiscal module unit originated in the 1980s. It is defined by INCRA as “the minimum area where agricultural activity can provide, in each
municipality, subsistence and social and economic progress to the families who invest their workforce”.
16Figure 11. Evolution of Rural Credit Volume by Program in the Amazon, 2000/01 - 2019/20
Figure 11. Evolution of Rural Credit Volume by Program in the Amazon, 2000/01 - 2019/20
20
15
Billions (R$)
10
5
0
01 02 03 04 /05 /06 /07 /08 /09 /10 0/11 1/12 /13 /14 /15 /16 /17 7/18 /19 /20
0/ 01/ 02/ 03/ 9 01 12 13 14 015 016 01 018 19
0 04 05 06 007 008 00 1
20 20 20 20
20 20 20 20 20 20 20 2 2 2 2 2 2 2 2 20
Agricultural Year
PRONAF Other Funding Sources
Rural Savings - Unrestricted FCO
FNO Rural Savings - Restricted
LCA ABC
PRONAMP Other Programs
Compulsory Resources FNE
MODERFROTA PCA
Note: December 2020 constant values (inflation adjusted by IPCA). The category ”Other Programs” includes:
Note:
BNDESDecember 2020
– FINAME, constant
BNDES values (inflation
– Unrestricted, adjusted
National by IPCA).
Treasury, FAT, The category
FTRA, ”Other
FUNCAFÉ, Programs”
Hybrid includes:
Instrument (IHCD),
BNDES – FINAME, BNDES – Unrestricted, National Treasury, FAT, FTRA, FUNCAFÉ, Hybrid
MODERAGRO, INOVAGRO, MODERINFRA, PNCF, PROCAP AGRO, PRODECOOP. The category “Other Funding Instrument (IHCD),
MODERAGRO, INOVAGRO,
Sources” includes: MODERINFRA,
Unrestricted Resources, PNCF, PROCAP
Unrestricted AGRO, PRODECOOP.
Resources The category
- Subsidized, States “Other Funding
and Municipalities,
Sources” includes: Unrestricted
and External Funding. Resources, Unrestricted Resources - Subsidized, States and Municipalities,
and External
Source: Funding. with data from RECOR and SICOR from Central Bank of Brazil, 2021
CPI/PUC-Rio
Source: CPI/PUC-Rio with data from RECOR and SICOR from Central Bank of Brazil, 2021
17CONCLUSION
This brief delves deeper into previous analyses of rural credit, focusing on the Amazon biome.
Rural credit in the region has increased in recent years, but producers in the biome continue to
have less access to credit than those in the rest of the country. The main credit providers are
public banks, Banco do Brasil and Banco da Amazônia, and face little competition. Furthermore,
agricultural activities in the Amazon are less business-oriented than in the rest of the country,
as evidenced by the low amount of credit going to enterprises and also by few credit contracts
directed to trade and industrialization in this biome. Sources of credit in the region have
diversified in recent years, as the FNO loses prominence and private funds - such as the LCA -
gain more ground. Nevertheless, this increase in private funding has not significantly changed the
financial institutions operating rural credit in the region.
Deforestation in the Amazon has increased in recent years, and 99% of it is illegal. Much of the
rural credit in the region finances cattle production, an activity often linked to deforestation. With
international markets increasing focus on environmental sustainability, a more transparent and
efficient credit system may contribute to the preservation of the biome. Credit must be made
accessible to environmentally responsible producers who abide by the Forest Code and employ
good land use practices. Greater alignment of credit instruments with the Forest Code - with new
ways to verify compliance - presents an opportunity for public policy to generate incentives for
economic and social well-being. The Central Bank of Brazil’s recent initiative to create the Bureau
Verde is an important step in that direction.
18AUTHORS
PRISCILA SOUZA
Head of Policy Evaluation, Financial Instruments, CPI/PUC-Rio
priscila.souza@cpiglobal.org
GABRIEL CAMPOS
Assistant Analyst, Financial Instruments, CPI/PUC-Rio
STELA HERSCHMANN
Analyst, Financial Instruments, CPI/PUC-Rio
PEDRO VOGT
Assistant Analyst, Financial Instruments, CPI/PUC-Rio
JULIANO ASSUNÇÃO
Executive Director, CPI/PUC-Rio
The authors would like to thank the excelent research suport given by Solange L. Gonçalves, Eloiza R. F. de Almeida, and Nathalia Lima de
Oliveira. We also would like to thank Natalie Hoover El Rashidy, Giovanna de Miranda, and Jennifer Roche for revision and editing, and
Matheus Cannone and Nina Oswald Vieira for the graphic design work.
Suggested Citation
Souza, Priscila, Gabriel Campos, Stela Herschmann, Pedro Vogt, and Juliano Assunção. 6 Peculiarities of Rural Credit in
the Amazon: New Research Shows Credit Restrictions and Extensive Land Use in Agriculture. Rio de Janeiro: Climate Policy
Initiative, 2021.
MAY 2021
Climate Policy Initiative (CPI) is an analysis and advisory organization with deep expertise in finance and policy. Our mission is to help
governments, businesses, and financial institutions drive economic growth while addressing climate change. In Brazil, CPI partners with
the Pontifical Catholic University of Rio de Janeiro (PUC-Rio). This work is funded by Colaboração para Florestas e Agricultura (CFA),
WWF-Brasil, and Norway’s International Climate and Forest Initiative (NICFI). This publication does not necessarily represent the
view of our funders and partners.
Contact CPI/PUC-Rio: contato.brasil@cpiglobal.org
www.climatepolicyinitiative.org
Content licensed under Creative Commons Attribution 4.0 International. The texts in this publication may be reproduced in whole
or in part provided that the source and the respective authors are cited.
19You can also read