Estimate of carbon footprint of the FIFA World Cup TV productions - Sustainability
←
→
Page content transcription
If your browser does not render page correctly, please read the page content below

Sustainability
Estimate of carbon footprint of the
 FIFA World Cup TV productions

                             VersionOctober
                                     2 – May 2012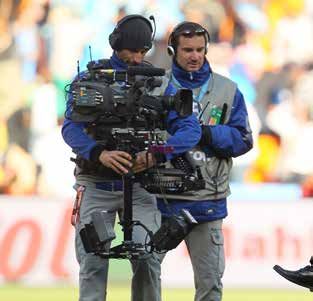
Contents

1. Introduction                                                     3
2. Methodology                                                      4
    2.1 Organizational Boundaries                                   4
    2.2 Operational Boundaries                                      4
    2.3 Emission factors                                            5
    2.4 Methods for extrapolation                                   5
3. Infrastructure                                                   6
    3.1 Power consumption (IBC and BCs)                             6
    3.2 Floodlight                                                  8
4. Equipment                                                        9
    4.1 Tapes                                                       9
    4.2 Cables                                                      9
    4.3 Furniture                                                  10
    4.4 Uniforms                                                    11
    4.5 Helicopter flights                                          12
    4.6 International transportation of equipment                   13
5. Satellite transmission                                          14
    6.1 International transport                                    15
6. Staff		                                                         15
    6.2 Accommodation                                              16
    6.3 National transport                                         16
7. Summary of Results                                              18
8. Conclusions and Recommendations                                 19
9. Glossary & Abbreviations                                         21
10. Literature                                                     22
Annex                                                              23

Fédération Internationale de Football Association (FIFA)
FIFA-Strasse 20, CH-8044 Zurich, Switzerland
Christian Stamm, CSR Advocacy Manager

myclimate – The Climate Protection Partnership
Sternenstrasse 12, CH-8002 Zurich, Switzerland
Project Lead: Dr. Daniel Kammerer, Dep. Head, Carbon Management Services
Internal Review: Silvia Marton, Project Manager, Carbon Management Services
2
2014 FIFA World Cup™
                                                                  Estimate of carbon footprint of the FIFA World Cup TV productions

1. Introduction

In this study the carbon footprint of the 2014 FIFA World Cup TV productions, which
corresponds to the responsibility of FIFA, is calculated as a forward-looking estimate of
potential carbon emissions. There are no international standards for the calculation of
carbon footprints of major sports events or the TV productions of such events. This study
draws on the framework set up in the study for the estimate of FIFA’s share of the carbon
footprint of the 2010 FIFA World Cup (FIFA, 2010A).The methodology is based on the
Greenhouse Gas Protocol (WRI and WBCSD, 2004).

Assigning a carbon footprint to an event or the TV productions associated with an event
bears uncertainties in boundary-setting, i.e. the question of which activities should be
included. Further, questions concerning quality should be kept in mind, i.e. concerning the
robustness of the methodology and the emission factors chosen. With a boundary-setting
process and methodology which aim at a high degree of completeness regarding the
carbon footprint, and a selection of emission factors which follow a life cycle analysis view
(comprising upstream and downstream emissions), these issues are addressed.

                                                                                                                                3
2. Methodology
2.1 Organizational Boundaries
The organizational boundaries have been set in accordance with the 2010 FIFA World Cup
study. They enclose FIFA TV productions, but not the Local Organization Committee (LOC)
and not the Media Right Licensees (MRL).
The temporal boundaries are enclosed by the outward and return journeys of TV
production staff as well as the inbound and outbound transport of vehicles and equipment
for the 2014 FIFA World Cup Brazil. The planning and contracting phases are not included.
2.2 Operational Boundaries
The operational boundaries are described in the following table.
Table 1: System boundaries of FIFA TV production
Staging of
Manufacturing Inbound transport Outbound transport
FIFA World Cup
Infrastructure
BCs (LOC) (LOC) power consumption (LOC)
IBC (LOC) (LOC) power consumption (LOC)
Stadia (LOC) (LOC) floodlight (LOC)
Equipment
Furniture; uniforms included regional transport - remains in Brazil
Cables included intn’l transport power consumption remains in Brazil
Tapes included intn’l transport power consumption intn’l transport
power consumption,
Further equipment - intn’l transport intn’l transport
helicopter flights
Satellites - - transmissions -
natn’l transport,
Staff - intn’l transport intn’l transport
accommodation
BCs – Broadcasting Compounds; IBC – International Broadcast Centre; LOC – Local
Organizing Committee
Manufacturing is included for products manufactured specifically for TV production of 2014
FIFA World Cup Brazil or used only at 2014 FIFA World Cup Brazil and recycled or disposed
of afterwards.
Not included in the operational boundaries is any merchandising of FIFA TV products, as
well as any activities of TV stations and audience.
Emissions from fugitive refrigerants could not be considered, since FIFA TV was not able
to provide any details of the air-conditioning system for Brazil at the time of the study
completion.
42014 FIFA World Cup™
Estimate of carbon footprint of the FIFA World Cup TV productions
2.3 Emission factors
Greenhouse gas (GHG) emissions are generally expressed as a weight of carbon dioxide
equivalent (CO2e). This is because other GHGs may have a different global warming
potential (GWP) from carbon dioxide and it is usual to combine the effect of all greenhouse
gases into one number for CO2e. The GWP for CO2 is set at 1. Global warming potentials for
time horizon of 100 years of the other GHGs were taken from IPCC AR4 (2007).
The deduction of the activity data is illustrated in the respective chapters below. The
emission factors are selected to represent life cycle emissions, to best fit the “polluter pays”
principle. The main source for the emission factors was the database ecoinvent (2010) from
the Swiss Centre for Life Cycle Inventories.
2.4 Methods for extrapolation
The main source for activity data was the 2010 FIFA World Cup. Since the number of
stadia and Host Cities increased from South Africa (10) to Brazil (12), some data has to be
extrapolated with a factor of 12/10. This applies mainly for venue-related activities and staff-
related activities.
53. Infrastructure
3.1 Power consumption (IBC and BCs)
The IBC and BCs have an independent power supply for the so-called Broadcasting Power.
While Broadcasting Technical Power (utility power and cooling) is fully provided by diesel
generator utilities, Broadcasting Domestic Power (lighting) had been provided from grid
for a limited number of days. For this GHG inventory, power consumption at IBC and BCs is
modelled as 100% diesel generator power, since data on grid consumption is not available.
Since broadcasting power is consumed by FIFA TV as well as by MRLs, the associated
emissions have to be allocated to these two consumers as well.
3.1.1 IBC
System boundaries
••manufacturing: not included, under responsibility of LOC
inbound and outbound transport: not included, under responsibility of LOC
•staging: power consumption included
Activity data
Activity data is based on 2010 FIFA World Cup South Africa data.
••operations (2 June – 12 July; 41 days) 16’000 litre diesel were used per 24h on average
pre-operations: (24 March – 24 May; 69 days): average consumption per day is estimated
to be half the amount of operation phase (=8’000 l diesel per day)
••
operational period is 24/7
pre-operational period is 7 days a week, power generators are switched off from
22.00 – 07.00
Table 2: IBC diesel consumption
L diesel / 24 h duration L diesel
operations 16’000 41 x 24h 656’000
pre-operations 8’000 69 x 15h 345’000
total 1’001’0001
Based on estimates from FIFA TV, IBC power consumption is allocated as follows2:
••FIFA TV share: 10%
MRLs share: 90%
1 The result is supported by a quote from the power generation provider that diesel consumption at the IBC was “just around
1’000’000 L”
2 Models for allocation of power between FIFA TV, MRLs and other clients are estimated based on the information available
from the official booking system at the 2010 FIFA World Cup.
62014 FIFA World Cup™
Estimate of carbon footprint of the FIFA World Cup TV productions
3.1.2 BC
Actual diesel consumption data for BCs was not available from 2010 FIFA World Cup South
Africa. Instead, the diesel consumption was estimated, based on two extrapolation models
from FIFA TV.
System boundaries
••Manufacturing: not included, under responsibility of LOC
Inbound and outbound transport: not included, under responsibility of LOC
•Staging: power consumption included
Activity data
Model 1: estimation by venue
• match days: total of 20’000 l diesel is consumed on average per venue over all match-
days
• additional (non-match days; set-up): 10’000 l diesel is consumed on average per venue
Table 3: BCs diesel consumption by venues (model 1)
L diesel / venue L diesel (10 venues)3
match days (48h / match) 20’000 200’000
non-match days 10’000 100’000
total 30’000 300’000
Model 2: estimation by load
••Match days: 206kW load over 48 hours
Additional (non-match days; set-up): 50kW load over 50 days
•0.2 L diesel consumption per kWh
Table 4: BCs diesel consumption by load (model 2)
hours kW load L/kWh diesel L diesel
3’072h
match days 206 0.2 126’566
(64 matches x 48h)
14’400h
non-match days 50 0.2 144’000
(12 venues x 50d x 24h)
total 270’566
For the GHG inventory, the mean of both models is used, that is 285’000 L diesel
consumption4. Based on estimates from FIFA TV, BCs power consumption is allocated as
follows5:
•• FIFA TV share: 25%
MRLs share: 75%
3 Even though in Brazil a total of 12 stadia will be set up, the numbers are extrapolated with the South Africa number of
venues (10). With 12 venues, the diesel consumption per venue will be considerably lower, hosting only 5-6 matches
on average, compared to 6-7 matches.
4 FIFA TV considers both models valid, since “all estimations are within a +/- 20% range in any case”.
5 Models for allocation of power between FIFA TV, MRLs and other clients are estimated based on the information avail-
able from the official booking system at the 2010 FIFA World Cup
73.1.3 GHG emissions
The emission factor for diesel combustion was modelled from ecoinvent modules. It also includes
upstream emissions of oil extraction, refinement, and transport.
Table 5: GHG emissions of IBC and BCs power consumption
L diesel kg CO2e / L t CO2e (total) FIFA share t CO2e (FIFA)
IBC 1’000’000 3.16 3’160 10% 316
BCs 285’000 3.16 901 25% 225
total 1’285’000 4’061 541
3.2 Floodlight
For the 2014 FIFA World Cup Brazil, stadia floodlights need to provide 2’000 Lux minimum in
order to guarantee for HD TV quality. Before, 1’600 Lux was the quasi-standard for stadia: Hence,
the additional power consumption to provide the extra 400 Lux should be attributed to the FIFA
TV carbon footprint.
System boundaries
••manufacturing: not included, under responsibility of stadium authority
inbound and outbound transport: not included, under responsibility of stadium authority
•staging: power consumption included for extra 400 Lux
Activity data
• duration per match: from 3h before kick-off until 1h after final whistle plus extra 0.5h at reduced
level (=6h per match)
• non-match activities (official training, unilateral activities etc.): estimated to be another 6h per
match
• Cape Town stadium was taken as reference for the floodlight capacity with its 360 2kW spray
lights “ring of fire”6
• linear allocation was applied for the extra 400 Lux in the total 2’000 Lux (=20%)
Emissions
The emission factor for grid power in Brazil was taken from ecoinvent.
Table 6: GHG emissions of floodlight
kW floodlight
h kg CO2e / kWh t CO2e (total) FIFA share t CO2e (FIFA)
capacity
match 64 x 6 720 0.29 80 20% 16
non-match 64 x 6 720 0.29 80 20% 16
total 160 32
6 see 2010 FIFA World Cup - Host City Cape Town - Green Goal Legacy Report, p.28 for details
82014 FIFA World Cup™
Estimate of carbon footprint of the FIFA World Cup TV productions
4. Equipment
4.1 Tapes
Tapes are used to store and archive the TV productions.
System boundaries
••manufacturing: included, since the tapes are used only once.
inbound and outbound transport: included, tapes go back to FIFA HQ in Zurich,
Switzerland
•staging: indirect energy consumption through recording devices (included in energy
consumption of BCs and IBC)
Activity data
••total of 3’800 tapes was used at 2010 FIFA World Cup South Africa
number taken for 2014 FIFA World Cup Brazil without further adaption
•transportation is accounted for in the category “transportation of goods”
Emissions
The tapes have been modelled based on general data of LTO tapes (Linear Tape-Open). The
following estimates have been applied:
•• total weight: 0.3kg
casing: 0.17 kg plastic
• tape: 0.13 kg magnetite and PET
Table 7: GHG emissions of tapes
units kg CO2e / unit t CO2e
3’800 2.0 8
4.2 Cables
System boundaries
• manufacturing: included, since the cables are used at the FIFA World Cup primarily.
Afterwards they are donated or go into recycling.
••inbound transport: included, cables are sent from Europe to Brazil
staging: indirect energy consumption through plugged devices (included in energy
consumption of BCs and IBC)
•outbound transport: excluded, cables will remain in Brazil for reuse or recycling
3 ISO's guidance on social responsibility
9Activity data
BC’s:
••total of 1’200 km cables was used in South Africa
extrapolation with stadia quota 1.2 results in 1’440 km for Brazil
IBC:
••
total of 800 km cables was used in South Africa
number taken for Brazil without further adaption since IBC will have similar size in Brazil
Transportation is accounted for in the category “transportation of goods”
Emissions
The emission factor for cables was taken from ecoinvent. It was modelled as 50% “data
cable in infrastructure” and 50% “connector for computer”.
Table 8: GHG emissions of cables
km kg CO2e / m t CO2e
BCs 1’440 0.26 374
IBC 800 0.26 208
total 2’240 582
4.3 Furniture
System boundaries
• manufacturing: included, since furniture is used at the FIFA World Cup primarily.
Afterwards it is donated or goes into recycling
••inbound transport: included
staging: no emissions
•outbound transport: excluded, furniture will remain in Brazil for reuse or recycling
Activity data
BC’s:
••total of 6’000 units was used in South Africa
extrapolation with stadia quota 1.2 results in 7’200 km for Brazil
IBC:
••
total of 5’000 units was used in South Africa
number taken for Brazil without further adaption since IBC will have similar size in Brazil
102014 FIFA World Cup™
Estimate of carbon footprint of the FIFA World Cup TV productions
Emissions
The furniture has been modelled based on the myclimate-internal database. It was assumed
that all furniture is produced locally in one region in Brazil and transported 2’000 km by
road transport to their final destinations in the Host Cities. This distance is based on the
mean road distance of 1’660 km between Rio de Janeiro and Host Cities.7
The IBC furniture was specified by furniture type. For BCs furniture the same ratio was
applied to calculate an emission factor per average unit of furniture.
Table 9: weight and GHG emissions of different furniture types
IBC ratio kg CO2e / piece weighted kg CO2e
executive chair 600/5’000 160 19.2
basic chair 2’200/5’000 80 35.2
desk 900/5’000 160 28.8
waste bin 1’300/5’000 10 2.6
average unit 85.8
Table 10: GHG emissions of furniture at BCs and IBC
units kg CO2e / unit t CO2e
BCs 7’200 85.8 618
IBC 5’000 85.8 429
total 12’200 1’047
4.4 Uniforms
System boundaries
••manufacturing: included, since uniforms are produced for the FIFA World Cup
inbound transport: included; uniforms are sent from China to Brazil
•staging: emissions from cleaning energy are insignificant and are under the responsibility
of staff
•outbound transport: excluded, uniforms will remain in Brazil for recycling or be reused by
staff
Activity data
••total of 2’400 sets was used in South Africa
extrapolation with stadia quota 1.2 results in 2’880 sets for Brazil
•one set consists of 2 trousers, 3 t-shirts, 1 jacket, 1 sweater, 1 cape, and 1 cap
7 see Annex for all calculations of mean distances
11Emissions
The uniform has been modelled based on the myclimate-internal database on shirts with
cotton and synthetic fabrics. It was assumed that all uniforms are produced in China and
transported 20’000km by sea (Shanghai to Rio de Janeiro) plus 1’660km for mean road
distance between Rio de Janeiro and Host Cities.8
The following weights have been estimated, resulting in a total of 3kg:
••2 trousers (2 x 300 gr)
3 t-shirts (3 x 200 gr)
••
1 jacket (700 gr)
1 sweater (500 gr)
••
1 cape (500 gr)
1 cap (100 gr)
Table 11: GHG emissions of uniform manufacture
# sets kg kg CO2e / kg t CO2e
2880 8’640 50.5 436
4.5 Helicopter flights
System boundaries
••imanufacturing: not included
iinbound and outbound transport: included
•istaging: emissions from helicopter operations
Activity data
••ihelicopters are flying for 2h per match
iit is estimated that helicopters are rented from a regional provider, totalling 1 hour for
inbound and outbound transport per match
Emissions
The emission factor for helicopter transport was taken from ecoinvent (excl. the allocated
emissions from manufacturing).
Table 12: GHG emissions of helicopter flights
duration kg CO2e / h t CO2e
64 x 3h 96.5 19
8 see Annex for all calculations of mean distances
122014 FIFA World Cup™
Estimate of carbon footprint of the FIFA World Cup TV productions
4.6 International transportation of equipment
Activity data
• see Annex for all calculations of mean distances air freight (commercial):
- 70 tons equipment was shipped as commercial air freight bidirectional between Europe
and South Africa in 2010.
- extrapolation with stadia quota 1.2 results in 84 tons for Brazil
- average one-way distance was modelled as Zurich / Rio de Janeiro. Additionally,
1’238 km for distribution to one of the Host Cities was considered. This is the mean
flight distance between Rio de Janeiro and the Host Cities9
• sea freight:
- 590 tons sea freight was shipped bidirectional between Europe and South Africa in
2010
- extrapolation with stadia quota 1.2 results in 708 tons for Brazil
- average one-way distance was modelled as Rotterdam / Rio de Janeiro for the sea
leg10 and additional 2’460 km road leg (800 km for Zurich/Rotterdam and 1’660 km for
mean road distance between Rio de Janeiro and Host Cities)
Emissions
The emission factors were adapted from ecoinvent:
• air freight: emission factor for international air freight, multiplied by a factor of 2 to take
the non-CO2 effects of aviation emissions into account (myclimate 2010)
••sea freight: emission factor for transoceanic freight ship, adapted to container ship
road transport: emission factor for lorry, 7.5-16 t, EURO 4
Table 13: GHG emissions of transportation of goods
tons route km kg CO2e / tkm t CO2e
equipment
84 Zurich/Rio + Host Cities 2 x 10’620 2.125 3’791
(air freight)
equipment
708 Rotterdam/Rio 2 x 9’685 0.029 398
(sea; sea leg)
equipment
708 2 x 2’460 0.222 773
(sea; road leg)
total 4‘962
9 see Annex for all calculations of mean distances
10 Sea freight distances calculated using http://www.portworld.com/map/
135. Satellite transmission
System boundaries
Satellite transmission is used as service during the staging of the FIFA World Cup.
Two types of transmissions are included in this GHG inventory:
••from BCs to IBC
from IBC to media stations
Activity data
Per match the following satellite capacity is booked for 3 hours:
••for BC to IBC transmission: 4 transponder (36MHz)
for IBC to media stations transmission: 2 transponder (36MHz) and 2 transponder
(18MHz)
Emissions
Emission factors for satellite transmission are not publicly available to the best of
myclimate’s knowledge. The emissions have been estimated based on the corporate carbon
footprint of SES, a major satellite operator11. However, the quality of this estimation is
uncertain, especially whether or not the actual launches of satellites are accounted for, since
this is outsourced. It is clearly stated that SES included purchased goods and services, yet
details on outsourced services are missing.
Table 14: GHG emissions of satellite transmission
h transmission # transponders kg CO2e / transponder x h t CO2e
BCs to IBC 192 (64 matches x 3h) 4 3.4 2.6
IBC to media stations 192 (64 matches x 3h) 4 3.4 2.6
total 384 5.2
11 Emissions per 365 x 24 h: Quotient of total carbon footprint of SES in 2011(scope 1,2, and 3): 39'200 t CO2e
(see SES, 2012A), over total transponder capacity in 2011: 1'315 of 36MHz transponder (see, SES, 2012B, slide 11)
142014 FIFA World Cup™
Estimate of carbon footprint of the FIFA World Cup TV productions
6. Staff
6.1 International transport
International transport covers the outward and return journey of FIFA TV staff. Each person
travels to and from Brazil only once.
Activity data
••total FIFA TV staff at 2010 FIFA World Cup South Africa was 2’600 persons
extrapolation with stadia quota 1.2 results in 3’120 persons for Brazil
•FIFA TV estimated that staff will be mainly from Europe with around 10 per cent from
South America (= 312 persons)
•further it was estimated by FIFA TV that around 15-20% of the intercontinental flights will
be business class (=17.5%) and 80-85% economy class (=82.5%)
••
intercontinental flights were modelled as Zurich / Rio de Janeiro
flights within South-America were modelled as half-distance of Bogota / Rio de Janeiro
•
Rio de Janeiro was taken as hub for Brazil with one domestic flight. Mean flight distance
between Rio de Janeiro and Host Cities is 1’238 km12, therefore Rio de Janeiro / Salvador
(1’204 km) was taken for the emission calculation of the domestic flights.
Emissions
The flights were calculated using the myclimate flight calculator13, performing the following
steps:
• for each pair of airports, the flight distance is calculated with the great circle distance and
corrected with a detour factor
• fuel consumption is extrapolated with generic aircraft types (with a distinction being
made between short and long-haul flights), taking into account average seat utilization,
number of seats and cabin class
• to derive the global warming potential, the non-CO2 effects of aviation emissions are also
taken into account (myclimate 2010)
For further explanation and details of parameters, see myclimate (2010).
Table 15: GHG emissions of international transport
route km passengers t CO2e / round trip t CO2e
intercontinental Zurich/Rio/Zurich 18’763
491 8.18 4’016
Business Rio/Salvador/Rio + 2’408
intercontinental Zurich/Rio/Zurich 18’763 2’317
4.51 10’450
Economy Rio/Salvador/Rio + 2’408
South America Bogota/Rio 4’547
312 1.45 452
Economy Rio/Salvador/Rio + 2’408
total 3’120 14‘918
12 All flight distances calculated using the myclimate flight calculator (https://www.myclimate.org/nc/offsetting/co2-off-
setting/offset-your-flight.html). See Annex for calculation of mean distance between Host Cities.
13 https://www.myclimate.org/nc/offsetting/co2-offsetting/offset-your-flight.html
156.2 Accommodation
Activity data
••at 2010 FIFA World Cup South Africa, FIFA TV staff had a total of 65’000 room nights
extrapolation with stadia quota 1.2 results in 78’000 room nights for Brazil since there
will be on average more staff in Brazil than in South Africa
•FIFA TV estimated that staff will mainly stay at hotels of 3-star category, with around
100 persons to stay at hotels of 4-5 class category
Emissions
The emission factor for hotel stay was taken from the Carbon Footprint study of FIFA
(2010B). The myclimate database has carbon footprint data for several hotel classes.
Electricity consumption is a major source of GHG emissions associated with hotel stays.
Therefore the emission factors were adapted to Brazil, using the country mix of electricity
from ecoinvent. Further, emissions from other resource consumption, such as heating
demand and food, are included with a star-category specific term. The emission factor for
category 4/5-stars is the mean of the respective 4-star and 5-star emission factor.
Table 16: GHG emissions of accommodation
room nights kg CO2e / room night t CO2e
3-star hotel 75’500 12.9 974
4/5-star hotel 2’500 40.4 101
total 78’000 1’075
6.3 National transport
National transport covers the transport of FIFA TV staff in Brazil during the staging of the
2014 FIFA World Cup. The geographical characteristics of Brazil and its Host Cities had
an impact on national transport. While road transport was predominant in South Africa
for inter-city transport, charter flights will play an important role in Brazil, due to the large
distances between the Host Cities. On the other hand, public transport might play a more
important role in the intra-city transport in Brazil, compared to South Africa.
Activity data
• there will be 48 charter flights, each for around 120 passengers and an average duration
of 80 minutes
• daily staff transportation between accommodation and IBC / BCs was modelled as
50 km bus transport on average. Based on the room nights to staff quotient, an average
stay of 25 days was assumed (78’000 / 3120 = 25)
• at 2010 FIFA World Cup South Africa, a total of 3’000 Taxi Service trips took place for
FIFA TV staff between accommodation and IBC. Extrapolation with stadia quota 1.2
results in 3’600 trips for Brazil, estimated to transport 10 persons over 50 km on average.
162014 FIFA World Cup™
Estimate of carbon footprint of the FIFA World Cup TV productions
Emissions
• the emission factor for charter flights were calculated with the above described
myclimate flight calculator. Rio de Janeiro to Belo Horizonte was taken as reference flight.
Since this flight takes 75 minutes only, the respective emissions have been adapted by a
factor of 80/75.
• the emission factor for coach and shuttle transport was taken from ecoinvent.
Table 17: GHG emissions of national transport
passengers or trips kg CO2e / unit t CO2e
charter flights 48x120 passengers 129.9 748
50 km road (venue) 3’120 passengers daily, over 25 days 2.6 203
50 km road (social) 3’600 trips 26.1 94
total 1‘045
177. Summary of Results
As shown below, the carbon footprint of 2014 FIFA World Cup TV productions, which
corresponds to the responsibility of FIFA, is estimated at around 24’670 t CO2e. Major
contributor is international travel, being responsible for more than half of the emissions.
Another significant share with almost a quarter of the total footprint is caused by air freight.
Table 18: GHG emissions of 2014 FIFA World Cup TV productions
t CO2e %
power consumption (IBC&BCs), floodlights 573 2%
equipment, satellite transmission 2‘097 9%
air freight 3‘791 15%
sea freight 1‘171 5%
international travel 14‘918 61%
national travel 1‘045 4%
hotel stays 1‘075 4%
total 24‘670 100%
182014 FIFA World Cup™
Estimate of carbon footprint of the FIFA World Cup TV productions
8. Conclusions and
Recommendations
Ex-ante calculations of carbon footprints are subject to known and unknown uncertainties.
First of all, it is challenging to correctly define the scope of an event that will happen in the
future. Since the FIFA World Cup and its TV production are staged every four years, FIFA
knows very well the associated activities. Therefore, the uncertainties from the scope of the
carbon footprint analysis are considered to be irrelevant.
Secondly, the actual consumption data regarding the defined activities is difficult to
correctly estimate in advance. The effective consumption data can only be assessed
retrospectively. Again, the routine in performing the FIFA World Cup TV productions as
well as the experience of the people involved in this project reduced the uncertainties in this
area. Below, the major remaining uncertainties are specified.
Besides activity data, emission factors play an important role for the quality of the final
results. Adequate emission factors were available or could be modelled for all activities but
satellite transmission.
Power consumption at IBC and BCs
The quality of the actual consumption data is good. It is either based on 2010 FIFA World
Cup South Africa data (IBC) or has been validated with two different extrapolation models
(BCs) that differ by 10% only.
However, the allocation of power consumption to FIFA and the MRLs had to be
approximated from the official booking system at the 2010 FIFA World Cup. However, even
a margin of error of 100% in the allocation of FIFA’s share would increase the total carbon
footprint of FIFA World Cup TV productions by a mere 2% and is therefore not considered a
critical source of uncertainties.
Refrigerants
Air-conditioning systems can be a source of GHG emissions, if fugitive emissions of certain
types of refrigerants occur (see table 19). In this inventory, GHG emissions from refrigerants
could not be considered, since FIFA TV was not able to provide any details of the air-
conditioning system for Brazil at the time of the study completion. Since certain refrigerants
have a very high global warming potential (e.g. R-22 has a GWP about 1’800 times higher
than CO2), this aspect of the carbon footprint of the FIFA World Cup TV productions has
critical uncertainties and should be updated, once the specification for the air-conditioning
systems are available.
Table 19: GWP critical refrigerants
chemical group regulations
banned or phase-out by 2020 in most industrial countries
HCFCs, CFCs (e.g. R12,R22)
(Montreal Protocol)
PFCs (Fluorocarbons) covered in Kyoto Protocol
HFCs (Hydrofluorocarbons) covered in Kyoto Protocol
19Cables
The cable data has high accuracy with regard to the total length of the cables. However, the
specific weight of the cables is uncertain. For this study, the average cable was modelled
with ecoinvent modules, as 50% “data cable in infrastructure” and 50% “connector for
computer”. That results in a specific weight of 60 gr/m.
According to feedback of FIFA TV to the first draft of this study, the specific weight of
cables is more likely to be in the area of 400 to 600 gr/m. An average specific weight
of 500 gr/m would result in a total weight of 1’120 t for the cables. Since this amount is
inconsistent with the sea freight, which totals 708 t and includes further goods besides
cables, the specific weight was not adapted in the study.
Running the analysis with the higher specific weight would add 2’892 t CO2e emissions
(12%). Therefore, the weight of the cables is a critical uncertainty as well.
• Manufacturing: thicker cables have higher emission per m of cable, yet the relative
emission factor per kg of cable decreases.
- Besides “three-conductor cable“ with a specific weight of 1.04 kg / m, all other cables
in ecoinvent are thin cables with a specific weight of less than 0.075 kg / m. Therefore
the emission factor of “three-conductor cable” was taken and adapted to the specific
weight of 0.5 kg / m
- cable emissions: 2’240 km x 1.186 kg CO2e/m = 2’657 t CO2e (an extra 2’075 t CO2e)
• Transport: thicker cables have higher weight and therefore higher transport emissions
- relative sea freight emissions (one-way: sea leg + road leg): 0.83 t CO2e / t
- cables extra weight: 2’240 km x (500 gr/m – 60 gr/m) = 986 t
- additional transport emissions: 986 t x 0.83 t CO2e / t = 818 t CO2e
Staff
Accounting for more than 60% of the emissions, international travel of staff is the main
driver for the carbon footprint of FIFA World Cup TV production. On average, the
international travel emissions are 4.78 t CO2e per person. Therefore, a 10% change of the
total amount of staff would change the emissions from international travel by almost 1’500 t
CO2e, which corresponds to 6% of the total carbon footprint. Accordingly, the emissions
from national travel (extra 105 t CO2e) and accommodation (108 t CO2e) would change as
well. In total, a 10% change in staff number would change the carbon footprint by 7%.
The share of international staff is a further driver of international travel emissions. Due to
language challenges, the share of local employees will decrease from 15% (FIFA World Cup
2010) to 10% (FIFA World Cup 2014). With a 15% share of local employees, flight emissions
would change as follows:
•• intercontinental flights: decrease by 804 t CO2e
South American flights; increase by 227 t CO2e
In total, the emissions would be lower by 577 t CO2e (2%). Therefore, this issue is not
considered a critical source of uncertainties.
Satellite transmission
As mentioned in chapter 5, an emission factor for satellite transmission has been estimated
based on the corporate carbon footprint of a major satellite operator. Since it is uncertain,
whether or not the actual launches of satellites are accounted for, this is also a critical
uncertainty for which the margin of error cannot be calculated.
202014 FIFA World Cup™
Estimate of carbon footprint of the FIFA World Cup TV productions
9. Glossary & Abbreviations
Parts of this glossary were adopted from the Greenhouse Gas Protocol Corporate Standard (WRI and
WBCSD, 2004).
BCs Broadcasting Compound
Carbon dioxide A greenhouse gas
CO2-equivalent CO2-equivalents (CO2e) are the universal unit of measurement to indicate
the global warming potential (GWP) of each of the six greenhouse gases;
expressed in terms of the GWP of one unit of carbon dioxide. The term is
used to evaluate the release (or the prevention of the release) of different
greenhouse gases against a common basis.
Emission factor A factor allowing GHG emissions to be estimated from a unit of available
activity data (e.g. tons of fuel consumed, tons of product produced) and
absolute greenhouse gas emissions.
Greenhouse gas For the purposes of this study, greenhouse gases are the six gases listed
in the Kyoto Protocol: carbon dioxide (CO2), methane (CH4), nitrous oxide
(N2O), hydrofluorocarbons (HFCs); perfluorocarbons (PFCs), and sulphur
hexafluoride (SF6).
Greenhouse Gas Protocol A corporate accounting and reporting standard for greenhouse gas
emissions.
Global warming potential A factor describing the radiative forcing impact (degree of harm to the
atmosphere) of one unit of a given GHG relative to one unit of CO2.
Hydrofluorocarbon Hydrofluorocarbons (HFCs) are compounds derived from hydrocarbons
by partial replacement of hydrogen atoms by fluorine atoms.
Hydrofluorocarbons are greenhouse gases.
IBC International Broadcast Centre
LOC Local Organization Committee
Methane A greenhouse gas
MRL Media Right Licensees
Nitrous oxide Nitrous oxide (N2O), commonly known as “laughing gas”. A greenhouse gas.
Perfluorocarbon Perfluorocarbons (PFCs) are compounds derived from hydrocarbons by
replacement of hydrogen atoms by fluorine atoms. Perfluorocarbons are
greenhouse gases.
pkm Person kilometer
Radiative forcing The role of different greenhouse gases in global warming varies due to
their different properties. In scientific publications the contribution of a
greenhouse gas is referred to as radiative forcing.
2110. Literature
ecoinvent (2010) Ecoinvent database v2.2
FIFA (2010A) FIFA World Cup 2010: Preliminary Carbon Footprint for FIFA
FIFA (2010B) FIFA Carbon Footprint 2009
FIFA (2012) http://www.fifa.com/worldcup/destination/cities/index.html
[Accessed 20.6.2012]
Host City Cape Town (2011) 2010 FIFA World Cup - Host City Cape Town - Green Goal
Legacy Report
IPCC (2007) Climate Change 2007: The Physical Science Basis. Contribution
of Working Group I to the Fourth Assessment Report of the
Intergovernmental Panel on Climate Change. http://www.ipcc-
wg1.unibe.ch/publications [Accessed Apr, 2010]
myclimate (2010) myclimate calculation bases
https://www.myclimate.org/uploads/media/Calculation-bases_
EN_01.pdf
SES (2012A) http://www.ses.com/4519752/environmental-initiatives
[Accessed 20.6.2012]
SES (2012B) http://www.ses.com/10263205/120217_SES_FY_2011
_presentation__corrects_figs_p19_.pdf
[Accessed 20.6.2012]
WRI and WBCSD (2004) The Greenhouse Gas Protocol – A Corporate Accounting
and Reporting Standard (Revised Edition 2004). World
Resources Institute and World Business Council for Sustainable
Development.
222014 FIFA World Cup™
Estimate of carbon footprint of the FIFA World Cup TV productions
Annex
Table 20: distances of host cities from Rio de Janeiro
air distance (km) road distance (km)
Rio – Rio 0 0
Rio – Sao Paulo 353 450
Rio – Manaus 2‘839 4‘250
Rio – Fortaleza 2‘181 2‘650
Rio – Natal 2‘079 2‘600
Rio – Recife 1‘862 2‘300
Rio – Salvador 1‘204 1‘630
Rio – Cuiaba 1‘569 2‘000
Rio – Brasilia 918 1‘200
Rio – Belo Horizonte 345 450
Rio – Curitiba 374 850
Rio – Porto Alegre 1‘129 1‘550
Mean distance 1‘238 1‘660
Air distances were calculated with myclimate online flight calculator, road distances with
www.maps.google
23You can also read