Effect of Power Ultrasonic on the Expansion of Fiber Strands - MDPI
←
→
Page content transcription
If your browser does not render page correctly, please read the page content below
Article
Effect of Power Ultrasonic on the Expansion of
Fiber Strands
Frederik Wilhelm *, Sebastian Strauß , Raffael Weigant and Klaus Drechsler
 Fraunhofer Institute for Casting, Composite and Processing Technology IGCV, 86159 Augsburg, Germany;
 sebastian.strauss@igcv.fraunhofer.de (S.S.); raffael.weigant@igcv.fraunhofer.de (R.W.);
 klaus.drechsler@igcv.fraunhofer.de (K.D.)
 * Correspondence: frederik.wilhelm@igcv.fraunhofer.de

 Received: 29 March 2020; Accepted: 30 April 2020; Published: 8 May 2020

 Abstract: The present study investigates the effect of power ultrasonic on the expansion of fiber
 strands. A potential application of such expansion is in the production process known as closed
 injection pultrusion. The fiber strand in the pultrusion injection chamber is in compacted form, and so,
 any expansion of the fiber strand resulting from power ultrasonic should lead to improved fiber
 wetting. To investigate this, a wetted fiber strand was clamped on two sides and sonicated in the
 middle from below. The potential expansion of the fiber strand was visually determined through an
 observation window. The study concluded that power ultrasonic has a minimal to virtually negligible
 effect on the expansion of both glass and carbon fiber. The degree of expansion remains within a
 range of 3% maximum, with a standard deviation in the respective midpoint tests of up to 60% for
 glass fiber and over 100% for carbon fiber. This shows that the fibers are limited in their freedom
 of movement, and so no expansion can be achieved using power ultrasonic. A further increase in
 amplitude does not lead to any further expansion but to the destruction of the fibers.

 Keywords: power ultrasonic; expansion; carbon fiber; glass fiber; pultrusion; closed-injection pultrusion

1. Introduction
      The use of pultrusion in component production has attracted great attention in recent years,
due to such excellent properties as high strength-to-weight ratio and stiffness, and also due to the high
potential for automation. In most cases, the fibers are impregnated in an open impregnation bath. Here,
the choice is limited to matrix systems with a long processing time or pot life at room temperature [1].
      However, in order to further increase productivity, it is necessary to use highly reactive matrix
systems, such as polyurethanes [2,3]. Fiber impregnation then involves the use of a closed injection and
impregnation chamber (ii-chamber) rather than an open impregnation bath. A number of different types
of ii-chambers are already in use in industry [4–7]. However, the complete and uniform impregnation of
a fiber strand with a resin system, particularly in the case of carbon fibers, is still a major challenge with
this system [8]. While in an open impregnation bath, the fiber strands can be spread out, thus giving
the resin system a short flow path, in an ii-chamber, the fibers have to be impregnated as a compressed
strand. The effect of this is to reduce and significantly scatter the mechanical properties of the finished
component [9].
      One possible way of solving this issue is to integrate power ultrasonic (US) into the ii-chamber.
US has many applications, such as mixing, homogenizing and dispersing, and it is already in use in
numerous sectors (including the biological and chemical industries) [10–12]. The intended effect of US
is to expand the fiber strands through their transient cavitation. Transient cavitation occurs at sound
pressures with a power density of 10 W/cm2 . The tensile strength of the liquid is thereby exceeded [13],
so that cavities/bubbles that are either empty (true cavitation) or filled with gas or water vapor are

J. Compos. Sci. 2020, 4, 50; doi:10.3390/jcs4020050                                  www.mdpi.com/journal/jcs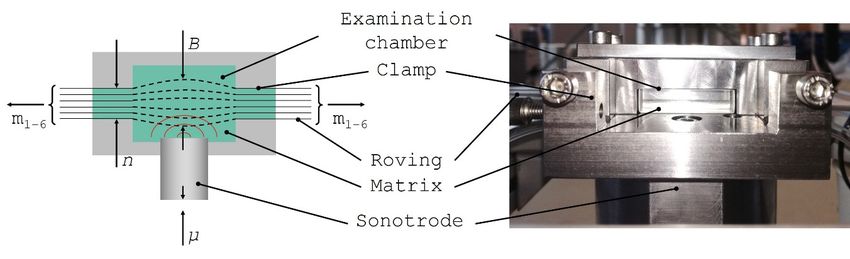
J. Compos. Sci. 2020, 4, x 2 of 8
J. Compos. Sci. 2020, 4, 50 2 of 8
sound pressures with a power density of 10 W/cm². The tensile strength of the liquid is thereby
exceeded [13], so that cavities/bubbles that are either empty (true cavitation) or filled with gas or
water vapor
formed in theare formed
liquid in the
[10,12]. liquid first
Newton [10,12]. Newton
coined first ‘cavitation’
the term coined the term ‘cavitation’
in 1704. in 1704. It had
It had previously been
previously
identified as been identified
material asinmaterial
spalling the earlyspalling
years ofinship
the propellers
early years[14–16].
of shipThe
propellers [14–16].
gas bubbles The over
expand gas
bubbles expand over several oscillation periods until their radius more than doubles
several oscillation periods until their radius more than doubles within half a period before collapsing within half a
period before collapsing within a few milliseconds [17]. The conditions prevailing
within a few milliseconds [17]. The conditions prevailing inside the gas bubbles include speeds of inside the gas
bubbles
50 to 150 include speeds of 50
m/s, temperatures ofto
up150
to m/s,
5000temperatures
K, and pressuresof upintothe
5000 K, and
range of 10pressures in the
9 to 1010 Pa range of
[10,13,18,19].
10 to 10
9
Figure
10 Pa [10,13,18,19].
1 contains a schematicFigure 1 contains aofschematic
representation the process.representation of the process.
p
High pressure
t
Sonotrode Low pressure
Figure 1. Formation
Figure 1. Formation of
of aa cavitation bubble during
cavitation bubble during sonication.
sonication.
The
Theeffect
effectof of US
US on on composites
composites manufacturing
manufacturing has has been
been previously
previously investigated.
investigated. These Thesehave have
demonstrated such benefits as enhanced mechanical properties
demonstrated such benefits as enhanced mechanical properties due to better impregnation, due to better impregnation,
improved
improvedfiber-matrix
fiber-matrix adhesion,
adhesion, and increased
and increased glass transition temperature
glass transition [20–23]. Improved
temperature component
[20–23]. Improved
properties
component properties were also demonstrated by the use of US in pultrusion [24]. However, have
were also demonstrated by the use of US in pultrusion [24]. However, few publications few
considered
publications thehave
influence of US on
considered thefiber distribution.
influence of US on Forfiber
excitations in the low
distribution. For frequency
excitationsrange,
in thea low
fiber
strand can be
frequency compacted
range, a fiberfurther
strandthan can would be possible
be compacted usingthan
further staticwould
compaction. Kruckenberg
be possible using staticet al.
investigated
compaction. Kruckenberg et al. investigated the compacting curve for glass fiber and carbon fiberof
the compacting curve for glass fiber and carbon fiber fabrics at an excitation frequency
1fabrics
to 10 Hz at [25]. They found
an excitation that an of
frequency increase
1 to 10inHz fiber volume
[25]. They content
found that of upantoincrease
16% is possible for glass
in fiber volume
fiber fabrics,
content of up with up to
to 16% is 6% for carbon
possible fiberfiber
for glass fabrics. Gutiérrez
fabrics, with up et to
al.6%conducted
for carbon similar
fiber investigations
fabrics. Gutiérrez with
comparable results [26]. Glass fiber fabrics were stimulated during
et al. conducted similar investigations with comparable results [26]. Glass fiber fabrics werecompaction and the compaction curve
recorded
stimulated for during
a frequency range ofand
compaction 10 tothe300 Hz and amplitude
compaction of 50 tofor
curve recorded 100aµm. A higher
frequency compaction
range was
of 10 to 300
achieved than with static
Hz and amplitude of 50 compaction,
to 100 µm. Aespecially at low frequencies,
higher compaction was achieved accompanied
than with bystatic
an increase in fiber
compaction,
especially
volume at low
content of frequencies,
about 10%. The accompanied by an increase
greater compaction in fiber to
was assumed volume
be duecontent of about
to the more 10%. The
homogeneous
greater compaction
distribution of the fibers was[27].
assumed to be duestimulation
The vibration to the moreled homogeneous
to better spreadingdistribution
of the of the fibers
fibers and in[27].
turn,
toThe vibration
a more uniform stimulation led to better
fiber distribution [28]. spreading of the fibers and in turn, to a more uniform fiber
distribution
Yamahira[28]. et al. showed that US can be employed to attain specific fiber alignments [29]. A beaker
Yamahira
was filled with an et al. showed
aqueous that solution
sugar US can becontaining
employedpolystyrene
to attain specific
fibers,fiber
whichalignments
were then [29]. A beakerat
irradiated
was filled with
frequencies of 25anand aqueous
46 kHz. sugarThissolution
formedcontaining
a standingpolystyrene
wave in the fibers, which
aqueous weresolution,
sugar then irradiated
and the
at frequencies of 25 and 46
fibers aligned themselves with this wave. kHz. This formed a standing wave in the aqueous sugar solution, and the
fibers
Thealigned themselves with
aforementioned this wave.
publications presented the positive effect of the vibration excitation or
The aforementioned publications
sonication on the fiber distribution. Investigation presented the of thepositive
effecteffect of the vibration
was limited excitation and
to the compaction or
sonication on the fiber distribution. Investigation of the effect was
orientation of the fibers. However, they did not consider fiber movement during acoustic irradiation tolimited to the compaction and
orientation
quantify the of the fibers.
possible However,
expansion, theywould
which did not consider
result in thefiber
localmovement
increase induring acousticreferred
permeability irradiation
to at
to quantify
the beginning. the possible expansion, which would result in the local increase in permeability referred
to atThis
the beginning.
study therefore focuses on the direct, visual expansion of the fiber strand during sonication,
This study
correlated to total therefore
area. This focuses
enableson theus todirect, visual expansion
understand the effect of of the
US fiber strand
on fiber during
strand sonication,
expansion and,
correlated to total
in turn, permeability. area. This enables us to understand the effect of US on fiber strand expansion and,
in turn, permeability.J. Compos. Sci. 2020, 4, x 3 of 8
2. Materials and Methods
J. Compos. Sci. 2020, 4, 50 3 of 8
2.1. Materials
Preliminary investigations have shown that the Biresin® CR141 epoxy resin system made by
2. Materials
Sika, Bad Urach, and Germany,
Methods which is used as standard in the pultrusion process, becomes cloudy after
only a short period of sonication [30]. Any expansion of the fiber strand that might have occurred is
2.1. Materials
then no longer visible.
In order to investigations
Preliminary avoid clouding, havea silicone
shown that oil the Biresin® CR141
(KORASILON ® M100 made by Obermeier in Bad
epoxy resin system made by Sika,
Berleburg,
Bad Urach, Germany)
Germany, whichis usedisinstead.
used as It has a viscosity
standard of 100 mPa·s
in the pultrusion and becomes
process, is thus, comparable
cloudy aftertoonly
the a
epoxyperiod
short resin ofsystem. The [30].
sonication substitute medium has
Any expansion already
of the been that
fiber strand usedmight
successfully, as reported
have occurred is thenin no
publications
longer visible. in similar fields [1,31].
The
In type to
order of avoid
glass fiber to be used
clouding, here isoil
a silicone 3030 with 4800®tex,
SE(KORASILON made
M100 madeby 3BbyinObermeier
Herve, Belgium,
in Bad
while the carbon fiber is CT50-4.0/240-E100 with 50k, made by SGL Carbon,
Berleburg, Germany) is used instead. It has a viscosity of 100 mPa·s and is thus, comparable to Wiesbaden, Germany.
the epoxy resin system. The substitute medium has already been used successfully, as reported in
2.2. Methods in similar fields [1,31].
publications
The
A testtype of glasswas
chamber fiber to be used
developed to here is SEdetermine
visually 3030 withthe 4800 tex,of
effect made
US on byfiber
3B indistribution
Herve, Belgium,
and
while the the
quantify carbon
extentfiber
to is CT50-4.0/240-E100
which with 50k,
US is able to expand made
a fiber by SGL
strand. Carbon,
Figure Wiesbaden,
2 shows Germany.
the schematic (left)
and the real-life assembly (right) of the test chamber. In addition, the schematic representation shows
2.2. Methods
the manipulated variables mass m, amplitude u and number of rovings n. The expansion B is shown
as the
A test chamber Itwas
test variable. indicates
developedthe extent to which
to visually the areathe
determine of effect
the fiber strand
of US is expanded
on fiber by US,
distribution and
expressed
quantify theasextent
a percentage.
to which US is able to expand a fiber strand. Figure 2 shows the schematic (left)
and theBelow the test
real-life chamber,
assembly US isofcoupled
(right) the test into the examination
chamber. In addition, chamber with a frequency
the schematic of 20 shows
representation kHz.
The diameter of the sonotrode is 20 mm. The fiber strand is clamped on
the manipulated variables mass m, amplitude u and number of rovings n. The expansion B is shown the left and right and has a
fiber
as thevolume contentItofindicates
test variable. 65% in thisthe area.
extentTheto fiber
which volume
the areacontent
of theisfiber
determined
strand isbyexpanded
the pultrusion
by US,
process.
expressed as a percentage.
Figure 2. Test chamber: schematic representation (left) and real-life assembly (right, [32]).
Figure 2. Test chamber: schematic representation (left) and real-life assembly (right, [32]).
Below the test chamber, US is coupled into the examination chamber with a frequency of 20 kHz.
The manipulated variables for the test chamber result from the following parameters:
The diameter of the sonotrode is 20 mm. The fiber strand is clamped on the left and right and has a fiber
• Mass per roving mn: The rovings are pulled continuously during pultrusion and are therefore
volume content of 65% in this area. The fiber volume content is determined by the pultrusion process.
under tension. In the test chamber, the preload on the rovings is simulated by employing an
The manipulated variables for the test chamber result from the following parameters:
additional weight per roving. This corresponds to the actual stress occurring in the chamber
• Mass geometries
per roving(conical
mn : Theand drop-shaped)
rovings are pulled[4,6]. The stressduring
continuously is based on the values
pultrusion and arefrom the
therefore
preliminary investigation and varies within the range 250 to 500 g per roving
under tension. In the test chamber, the preload on the rovings is simulated by employing an [30].
•additional
Numberweight
of rovings n: The layer
per roving. This thickness
corresponds is adjusted by varying
to the actual stressthe numberinofthe
occurring rovings. A
chamber
number(conical
geometries of rovings
andof between 2 and
drop-shaped) 6 corresponds
[4,6]. The stress is to a layer
based thickness
on the of between
values from 2 and 6
the preliminary
mm. The number
investigation of rovings
and varies determines
within the range 250 thetoaverage profile
500 g per roving thickness
[30]. in pultrusion.
• •Number Amplitude u: The
of rovings amplitude
n: The range can
layer thickness be varied
is adjusted bywithin
varying the
therange from
number of 12 to 48 µm.
rovings. Any
A number
further increase in amplitude will cause direct damage to the fiber [33].
of rovings of between 2 and 6 corresponds to a layer thickness of between 2 and 6 mm. The number
Silicone
of rovingsoildetermines
is injectedthe
intoaverage
the testprofile
chamber at a pressure
thickness of 1 bar by means of a pneumatic
in pultrusion.
pressure pot. The fiber strand in the test chamber can be viewed through the observation window
• Amplitude u: The amplitude range can be varied within the range from 12 to 48 µm. Any further
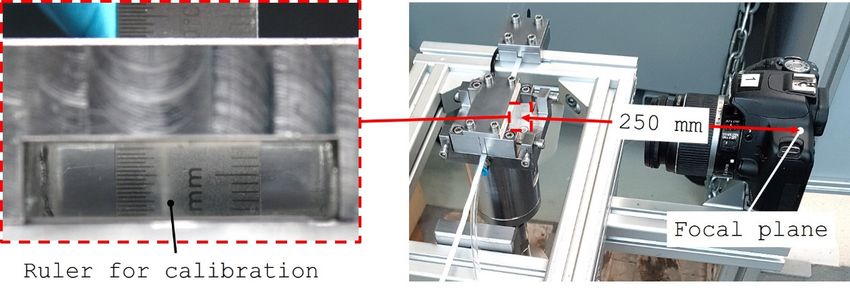
(Figure 3). A camera (EOS 500D, Canon, Tokyo, Japan, 15.1 megapixels) records the condition before
increase in amplitude will cause direct damage to the fiber [33].
Silicone oil is injected into the test chamber at a pressure of 1 bar by means of a pneumatic
pressure pot. The fiber strand in the test chamber can be viewed through the observation windowJ. Compos. Sci. 2020, 4, 50 4 of 8
J. Compos. Sci. 2020, 4, x 4 of 8
(Figure 3). A camera (EOS 500D, Canon, Tokyo, Japan, 15.1 megapixels) records the condition before
and
andduring
duringsonication.
sonication.Afterwards,
Afterwards, the
the percentage changesin
percentage changes inthe
theareas
areaswith
withand
andwithout
withoutsonication
sonication
are determined
are determinedand
andevaluated.
evaluated.One
One millimeter
millimeter corresponds to 76
corresponds to 76pixels
pixelson
onthe
thedigital
digitalimage.
image.
Figure 3. Evaluation of expansion B using a camera system (right), showing the viewfinder image of
Figure 3. Evaluation of expansion B using a camera system (right), showing the viewfinder image of
the observation chamber (left), where a calibration ruler can be seen.
the observation chamber (left), where a calibration ruler can be seen.
The manipulated variables—weight per roving, amplitude, and number of rovings—determine
The manipulated variables—weight per roving, amplitude, and number of rovings—determine
the experiment setup. For the manipulated variables and the glass fiber and carbon fiber materials,
the experiment setup. For the manipulated variables and the glass fiber and carbon fiber materials,
the experiment test plan is as shown in Table 1.
the experiment test plan is as shown in Table 1.
Table 1. Test plan for the test rig with corresponding manipulated variables.
Table 1. Test plan for the test rig with corresponding manipulated variables.
Manipulated Variables Variable Unit
Manipulated Variables Variable Unit
Level 1 Level 2
Level 1 Level 2 Midpoint
Midpoint
Weight per
Weight per roving m
roving m g g 250
250 500 500 375 375
Amplitude
Amplitude u u µmµm 1212 48 48 30 30
Number Number of rovings n
of rovings n - - 22 6 6 3 3
All tests are performed once, except for the midpoint test, which is repeated three times. This
All tests are performed once, except for the midpoint test, which is repeated three times.
enables a statement to be made about scatter in the experiment setup. All tests are carried out in the
This enables a statement to be made about scatter in the experiment setup. All tests are carried out in
sequence given in Table 2.
the sequence given in Table 2.
Table 2. Sequence of test steps.
Table 2. Sequence of test steps.
Section Activity
Section Link rovings Activity
to weights
Insert Link
rovings into test
rovings chamber
to weights
Setup
Close test
Insert rovings intorigtest chamber
Setup
Close test
Calibrate US rig
Calibrate
Open ball valve US pot
of pressure
Start Flush test chamberOpen
with silicone oil for 30 s at a pot
ball valve of pressure pressure of 1 bar
Start Start self-timer
Flush test chamber (5 images
with silicone oil forafter
30 s10ats)a pressure of 1 bar
5 s no(5US
Start self-timer images after 10 s)
u = 12 µm 5 s with US
5 s no US
5 images at an amplitude of 12 µm; deactivate sonication
u = 12 µm 5 s with US
5 s no US
5 images at an amplitude of 12 µm; deactivate sonication
u = 48 µm 5 s with US
5 images at an amplitude of 48noµm;
5 s USdeactivate sonication
u = 48End
µm 5 s with US
Close ball valve of pressure pot
5 images at an amplitude of 48 µm; deactivate sonication
Dismantling Open test chamber and clean
End Close ball valve of pressure pot
3. Results Dismantling Open test chamber and clean
The aim of the test chamber is to characterize the effect of US on the expansion of a fiber strand.
When it expands, the permeability of the fiber strand increases, thus, facilitating impregnation. TheJ. Compos. Sci. 2020, 4, x 5 of 8
J. Compos. Sci. 2020, 4, 50 5 of 8
test rig enables explicit investigation of the effect of expansion, by allowing fiber movements to be
viewed through an observation window (Figure 3).
3. Results
3.1. Expansion
Theofaim
Glass
of and Carbon
the test Fiber Strand
chamber is to characterize the effect of US on the expansion of a fiber strand.
When4itshows
Figure expands,
thethe
testpermeability of the
results for glass fiber
fiber strand
(left) andincreases, thus,
carbon fiber facilitating
(right). impregnation.
The measuring The test
points
are as rig enables
follows: explicit
fiber type[Ginvestigation
≙ Glass, C ≙of Carbon]_mass[g]_number
the effect of expansion, by allowing fiber movements to be viewed
of rovings[-]_amplitude[µm].
through an observation window (Figure 3).
The expansion range for glass fiber extends from −1.5% to 2.5% and for carbon fiber from −0.5%
to 8.5%. With the exception of an outlier in the carbon fiber test series, the amount of expansion is in
3.1. Expansion of Glass and Carbon Fiber Strand
the low single-digit range. The midpoint test shows that the measurements can be expected to display
a high degreeFigure 4 shows
of scatter. Athe test results
standard for glass
deviation fiber
of up to (left)
60% forandglass
carbon fiber
fiber and(right). The measuring
over 100% for carbonpoints
are asdetermined
fiber were follows: fiber type[G
in the =ˆ Glass,
respective C= ˆ Carbon]_mass[g]_number
midpoint tests. of rovings[-]_amplitude[µm].
Figure 4. Measurements resulting from the investigation of glass fiber expansion (left) and carbon fiber
Figure 4. Measurements resulting from the investigation of glass fiber expansion (left) and carbon
expansion (right).
fiber expansion (right).
The expansion range for glass fiber extends from −1.5% to 2.5% and for carbon fiber from −0.5%
3.2. Analysing the Effect of Manipulated Variables
to 8.5%. With the exception of an outlier in the carbon fiber test series, the amount of expansion is in
Inthe
order to determine
low single-digit the The
range. effect of the test
midpoint individual
shows that manipulated variables,
the measurements canall results were
be expected to display
analyzed in effect
a high degreediagrams.
of scatter.Figure 5 is andeviation
A standard example of of up
how to effect
60% fordiagrams (2 and
glass fiber and 3) of individual
over 100% for carbon
manipulated variables
fiber were can beinformed
determined from a test
the respective setup (1)
midpoint with two manipulated variables (a and b)
tests.
and the test variable y. The multi-dimensional test setup is reduced to the dimension of the
3.2. Analysing
manipulated theand
variable Effectthe
of Manipulated
mean valueVariables
per stage determined from the individual measuring
points. TheIneffect
order to determine the effect of the variable
of a particular manipulated individual is manipulated
determined by linear interpolation.
variables, all results wereThe
analyzed
effect is
indeemed positive if
effect diagrams. the test
Figure 5 isvariable increases
an example as the
of how manipulated
effect diagrams (2variable
and 3) ofincreases,
individualas shown
manipulated
in the variables
effect diagram
can be(2). Otherwise,
formed from athe effect
test is negative
setup (see manipulated
(1) with two (3) in Figure 5).
variables (a and b) and the test
variable y. The multi-dimensional test setup is reduced to the dimension of the manipulated variable
and the mean value per stage determined from the individual measuring points. The effect of a
particular manipulated variable is determined by linear interpolation. The effect is deemed positive if
the test variable increases as the manipulated variable increases, as shown in the effect diagram (2).
Otherwise, the effect is negative (see (3) in Figure 5).
Figure 6 shows the effect of US on the glass fiber for the test variable (expansion B). The effect
remains within a range of 3%. Transferred to the reference area without sonication, the area undergoes
only minimal change as a result of US. The manipulated variable weight per roving has the greatest
positive effect on expansion, followed by amplitude. The effect decreases with increasing layer
thickness. The midpoint test shows an average build-up of 0.8%, with a minimum value of 0.5% and
a maximum value of 1.4%. In comparison, the effect on expansion for all manipulated variables is
largely hidden in the scatter of the test setup.
Figure 5. Transfer of test space (1) to effect diagrams (2) and (3).manipulated variables can be formed from a test setup (1) with two manipulated variables (a and b)
and the test variable y. The multi-dimensional test setup is reduced to the dimension of the
manipulated variable and the mean value per stage determined from the individual measuring
points. The effect of a particular manipulated variable is determined by linear interpolation. The
J. effect
Compos.isSci.
deemed
2020, 4, positive
50 if the test variable increases as the manipulated variable increases, as shown
6 of 8
in the effect diagram (2). Otherwise, the effect is negative (see (3) in Figure 5).
J. Compos. Sci. 2020, 4, x 6 of 8
J. Compos. Sci. 2020, 4, x 6 of 8
Figure 6 shows the effect of US on the glass fiber for the test variable (expansion B). The effect
remains within
Figure a range
6 shows of 3%.
the effect Transferred
of US to the
on the glass fiberreference area
for the test without
variable sonication,
(expansion the effect
B). The area
undergoes only minimal change as a result of US. The manipulated variable weight
remains within a range of 3%. Transferred to the reference area without sonication, the area per roving has
the greatest only
undergoes positive effect change
minimal on expansion, followed
as a result of US.byThe
amplitude. The effect
manipulated decreases
variable weightwith
per increasing
roving has
layer thickness. The midpoint test shows an average build-up of 0.8%, with a minimum value
the greatest positive effect on expansion, followed by amplitude. The effect decreases with increasing of 0.5%
and a maximum value of 1.4%. In comparison, the effect on expansion for all manipulated
layer thickness. The midpoint test shows an average build-up of 0.8%, with a minimum value of 0.5% variables
isand
largely hidden in
a maximum the scatter
value of 1.4%.ofInthe test setup. the effect on expansion for all manipulated variables
comparison,
Figure5.5.Transfer
Figure Transferof
oftest
testspace
space (1)
(1) to
to effect
effect diagrams
diagrams (2)
(2) and (3).
is largely hidden in the scatter of the test setup.
Figure 6. Effect diagram for the expansion of glass fiber [30]. Manipulated variables from left to right:
mass,
Figureamplitude
Figure6.6.Effect and number
Effectdiagram
diagram for ofexpansion
forthe
the rovings. of
expansion ofglass
glass fiber
fiber [30].
[30]. Manipulated variables from left to right:
mass,
mass,amplitude
amplitudeand andnumber
numberofofrovings.
rovings.
A similar situation can be observed in the effect diagram for carbon fiber in Figure 7. The
manipulated
AAsimilar variable
situation
similar weight
can
situation can beperobserved
be observedroving
in thehas,
in like
effect
the the amplitude,
diagram
effect for carbonfor
diagram the
fiber greatest
in
carbonFigure positive
fiber7. effect
TheFigure
in manipulatedon
7. The
expansion.
variable
manipulated Asvariable
weight in the
per glass
roving
weightfiber
has, per tests,
like the thehas,
effect
amplitude,
roving on
the
like expansion
greatest
the decreases
positive
amplitude, effect
the with
on increasing
expansion.
greatest positive As layer
in
effect the
on
thickness.
glass fiber tests, the effect on expansion decreases with increasing layer thickness.
expansion. As in the glass fiber tests, the effect on expansion decreases with increasing layer
thickness.
Figure 7. Effect
Figure 7. Effectdiagram
diagramfor
forthe expansion
the of of
expansion carbon fiber
carbon [30].[30].
fiber Manipulated variables
Manipulated fromfrom
variables left toleft
right:
to
mass,
right: amplitude
mass, and number
amplitude and of rovings.
number of rovings.
Figure 7. Effect diagram for the expansion of carbon fiber [30]. Manipulated variables from left to
right: mass, amplitude and number of rovings.
4. Discussion
4. Discussion
This study investigated the effect of US on the expansion of a fiber strand. The focus of the study
4. Discussion
This study investigated the effect of US on the expansion of a fiber strand. The focus of the study
was
was onon quantifying
quantifying the
the effect
effect during
during sonication.
sonication.
This
The study investigated
investigation the
demonstrateseffect
thatof both
US on the expansion
ultrasonic of a fiber
amplitude and strand. The focus
fiber tension
tension haveof the study
The investigation demonstrates that
was on quantifying the effect during sonication. both ultrasonic amplitude and fiber have aasimilarly
similarly
positive
positive effect onon the
the expansion of
of aa fiber strand. The
The fact
fact that
that the
theexpansion
expansionincreases
increases withincreasing
increasing
Theeffect
investigation expansion
demonstrates fiber
thatstrand.
both ultrasonic amplitude and fiber tension withhave a similarly
fiber
fiber tension
tension cannot
cannot be explained
explainedofdirectly. This is because
because as as the
the fiber
fiber tension
tension increases,
increases, any
anypotential
potential
positive effect on thebeexpansion directly. This is
a fiber strand. The fact that the expansion increases with increasing
expansion
fiber tension would require
cannot correspondingly
be explained higher
directly. This externalas
is because forces. However,
the fiber tensionsince a relative
increases, increase
any potential
in the fiber would
expansion strand require
was indeed determined,higher
correspondingly the fiber strandforces.
external is correspondingly
However, sincemore compact
a relative at a
increase
higher fiber tension. However, US has a small to virtually negligible effect on
in the fiber strand was indeed determined, the fiber strand is correspondingly more compact at a the expansion of both
glass
higherand carbon
fiber fiber.However,
tension. The expansion
US haslies withintoavirtually
a small range of negligible
maximumeffect 3%, with a standard
on the expansion deviation
of both
of up to 60% for glass fiber and over 100% for carbon fiber, as determined in the
glass and carbon fiber. The expansion lies within a range of maximum 3%, with a standard deviation midpoint tests. ThisJ. Compos. Sci. 2020, 4, 50 7 of 8
expansion would require correspondingly higher external forces. However, since a relative increase in
the fiber strand was indeed determined, the fiber strand is correspondingly more compact at a higher
fiber tension. However, US has a small to virtually negligible effect on the expansion of both glass and
carbon fiber. The expansion lies within a range of maximum 3%, with a standard deviation of up to
60% for glass fiber and over 100% for carbon fiber, as determined in the midpoint tests. This means
that the fibers are limited in their freedom of movement, with the result that no expansion can be
achieved by US. Any further increase in amplitude will not lead to further expansion but to destruction
of the fibers. The fiber volume content is in direct correlation to the expansion. A minimal reduction in
the fiber volume content in the compaction area investigated is equivalent to a minimal increase in
permeability. Applied to pultrusion, the mechanical expansion of the fiber strand by US causes only a
slight improvement in impregnation. Any improvement to the mechanical properties of the pultruded
components as a result of US, as shown in Paper [24], can thus not be attributed to expansion of the
fiber strand but to an impact on the resin system.
Author Contributions: Conceptualization, F.W.; methodology, F.W., S.S.; validation, F.W., S.S., and R.W.;
investigation, S.S., R.W.; data curation, F.W., R.W.; writing—review and editing, F.W., S.S., R.W., K.D.; visualization,
F.W., R.W.; project administration, F.W.; funding acquisition, F.W. All authors have read and agreed to the published
version of the manuscript.
Funding: This research and development project is partly funded by the German Federal Ministry for Economic
Affairs and Energy (BMWi) within the Framework Concept “Central Innovation Program for SMEs” and managed
by the Project Management Agency AiF Projekt GmbH. The facilities and key technology equipment in Augsburg
are funded by the Region of Bavaria; City of Augsburg; BMBF and European Union (in the context of the program
“Investing In Your Future”—European Regional Development Fund).
Conflicts of Interest: The authors declare no conflict of interest.
References
1. Bezerra, R. Modelling and Simulation of the Closed Injection Pultrusion Process. Ph.D. Thesis, Karlsruher Institut
für Technologie (KIT), Karlsruhe, Germany, 2017.
2. Connolly, M.; King, J.; Shidaker, T.; Duncan, A. Pultruding Polyurethane Composite Profiles: Practical Guidelines
for Injection Box Design, Component Metering Equipment and Processing. In COMPOSITES; United States of
America: Columbus, OH, USA, 2005.
3. Strauß, S.; Senz, A.; Ellinger, J. Comparison of the Processing of Epoxy Resins in Pultrusion with Open Bath
Impregnation and Closed-Injection Pultrusion. J. Compos. Sci. 2019, 3, 87. [CrossRef]
4. Brown, R.J.; Kharchenko, S.; Coffee, H.D.; Huang, L. System for Producing Pultruded Components. U.S. Patent
8597016 B2, 3 December 2013.
5. Goldsworthy, W.B. Pultrusion Machine and Method. U.S. Patent 3556888, 19 January 1971.
6. Koppernaes, C.; Nolet, S.G.; Fanucci, J.P. Method and Apparatus for Wetting Fiber Reinforcements with
Matrix Materials in the Pultrusion Process Using Continuous in-Line Degassing. U.S. Patent 53150890,
17 December 1991.
7. Thorning, H. Fiberline Design Manual; Fiberline Composites: Kolding, Denmark, 2003.
8. Wilhelm, F. Closed injection pultrusion. In Proceedings of the Travelling Conference ReHCarbo, Shanghai,
China; Jeonju, Korea; Bangkok, Thailand, 23–26 October 2017.
9. Wilhelm, F.; Wiethaler, J.; Karl, R. Power ultrasonic in closed injection pultrusion. In Proceedings of the
ECCM18—18th European Conference on Composite Materials, Athen, Greece, 24–28 June 2018.
10. Peuker, U.A.; Hoffmann, U.; Wietelmann, U.; Bandelin, S.; Jung, R. Sonochemistry. In Book Ullmann’s
Encyclopedia of Industrial Chemistry; Wiley-VCH Verlag GmbH & Co. KGaA: Weinheim, Germany, 2012.
11. Bogoeva-Gaceva, G.; Heraković, N.; Dimeski, D.; Stefov, V. Ultrasound assisted process for enhanced
interlaminar shear strength of carbon fiber/epoxy resin composites. Maced. J. Chem. Chem. Eng. 2010, 29,
149–155. [CrossRef]
12. Mason, T.J.; Lorimer, J.P. Applied Sonochemistry. In The Uses of Power Ultrasound in Chemistry and Processing;
WILEY-VCH Verlag GmbH & Co. KGaA: Weinheim, Germany, 2002.
13. Hayek-Boelingen, V.M. Wege zum Kontaminationstoleranten Kleben. Ph.D. Thesis, Universität Bundeswehr,
München, Germany, 2004.J. Compos. Sci. 2020, 4, 50 8 of 8
14. Chen, D.; Sharma, S.K.; Mudhoo, A. Handbook on Applications of Ultrasound. In Book Sonochemistry for
Sustainability; CRC Press Taylor & Francis Group: Boca Raton, FL, USA, 2012.
15. Noltingk, B.E.; Neppiras, E.A. Cavitation produced by Ultrasonics. Proc. Phys. Soc. B 1950, 63, 674–685.
[CrossRef]
16. Newton, I. Opticks or a Treatise of the Reflections, Refractions, Inflections & Colours of Light; Dover Publ: New York,
NY, USA, 1979.
17. Ohl, S.W.; Klaseboer, E.; Khoo, B.C. Bubbles with shock waves and ultrasound: A review. Interface Focus
2015, 5, 1–15. [CrossRef] [PubMed]
18. Suslick, K.S.; Hammerton, D.A.; Cline, R.E. The sonochemical hot spot. J. Am. Chem. Soc. 1986, 108, 5641–5642.
[CrossRef]
19. Santos, H.M.; Lodeiro, C.; Capelo-Martinez, J.-L. Ultrasound in Chemistry. In Analytical Applications. The Power
of Ultrasound; WILEY-VCH Verlag GmbH & Co. KGaA: Weinheim, Germany, 2009.
20. Huang, Y.D.; Liu, L.; Qiu, J.H.; Shao, L. Influence of ultrasonic treatment on the characteristics of epoxy
resin and the interfacial property of its carbon fiber composites. Compos. Sci. Technol. 2002, 62, 2153–2159.
[CrossRef]
21. Liu, L.; Shao, L.; Huang, Y.; Jiang, B.; Zhang, Z. Effect of ultrasound on epoxy resin system and interface
property. In Proceedings of the 13th International Conference on Composite Materials (ICCM13), Beijing,
China, 25–29 June 2001.
22. Qiao, J.; Li, Y.; Li, L. Ultrasound-assisted 3D printing of continuous fiber-reinforced thermoplastic (FRTP)
composites. Addit. Manuf. 2019, 30, 100926. [CrossRef]
23. Bogoeva-Gaceva, G.; Dimeski, D.; Heraković, N. Effect of sonication applied during production of carbon
fiber/epoxy resin composites evaluated by differential scanning calorimetry and thermo-gravimetric analysis.
Maced. J. Chem. Chem. Eng. 2011, 30, 189–195. [CrossRef]
24. Tessier, N.J.; Kiernan, D.; Madenjian, A.; Moulder, G. Epoxy matrix pultrusions enhanced by ultrasonics.
Mod.Plast. 1986, 63, 86–90.
25. Kruckenberg, T.; Ye, L.; Paton, R. Static and vibration compaction and microstructure analysis on plain-woven
textile fabrics. Composites Part A 2008, 39, 488–502. [CrossRef]
26. Gutiérrez, J.; Ruiz, E.; Trochu, F. High-frequency vibrations on the compaction of dry fibrous reinforcements.
Adv. Comp. Mat. 2013, 22, 13–27. [CrossRef]
27. Gutiérrez, J.; Ruiz, E.; Trochu, F. Exploring the behavior of glass fiber reinforcements under vibration-assisted
compaction. J. Tex. Inst. 2013, 104, 980–993. [CrossRef]
28. Meier, R. Über das Fließverhalten von Epoxidharzsystemen und Vibrationsunterstützte Harzinfiltrationsprozesse.
Ph.D. Thesis, Technische Universität München, München, Germany, 2017.
29. Yamahira, S.; Hatanaka, S.-I.; Kuwabara, M.; Asai, S. Orientation of Fibers in Liquid by Ultrasonic Standing
Waves. Jap. Jou. Ap. Phy. 2000, 39, 3683–3687. [CrossRef]
30. Weigant, R. Analyse der Auswirkungen von Leistungsultraschall auf die Aufbauschung von Glas- und
Kohlenstofffasern. Bachelor’s Thesis, Hochschule München, München, Germany, 2018.
31. Bezerra, R.; Wilhelm, F.; Henning, F. Compressibility and permeability of fiber reinforcements for pultrusion.
In Proceedings of the ECCM16–16th European Conference on Composite Materials, Seville, Spain,
22–26 June 2016.
32. Karl, R. Untersuchung der Auswirkung von Ultraschall in der Pultrusion zur Verbesserung der Durchtränkung
von Faserpaketen. Master‘s Thesis, Hochschule München, München, Germany, 2017.
33. Christensen, S.; Stober, E.J. Vibration Assisted Processing of Viscous Thermoplastics. U.S. Patent 6592799,
15 July 2003.
© 2020 by the authors. Licensee MDPI, Basel, Switzerland. This article is an open access
article distributed under the terms and conditions of the Creative Commons Attribution
(CC BY) license (http://creativecommons.org/licenses/by/4.0/).You can also read